
October MacroEdge Ozone Pro Report #03: Opportunities for the Left Tail, Euphoria in Corporate Credit, the Fossil Frontier
This Institutional Report (#03) is the last time the IR will be delivered through the MacroEdge Substack, and from November onward it will be available through the Dashboard & IR Substack. #MacroEdge

Critical Points Discussed
Dual-Speed Economy and Data Blindness: The U.S. economy runs at two speeds—headline growth fueled by fiscal expansion and capex, while labor and consumption deteriorate. With a government data blackout obscuring key metrics, private-sector intelligence now defines the real macro view as policymakers navigate blind.
Speculative Euphoria and Fiscal Dominance: Markets are gripped by belief in a “new normal,” sustained by endless policy intervention. Retail inflows, leveraged trading, and AI exuberance have inflated multi-asset bubbles, while wealth concentration within the top 10% amplifies systemic imbalance and fragility.
Energy as the AI Bottleneck: The AI capex cycle has made energy the toll gate for digital expansion. Natural gas stands at the center of this power demand surge, positioning select producers and midstream firms for asymmetric upside as hyperscalers build trillion-dollar infrastructure.
Credit Complacency and Hidden Fragility: Corporate credit spreads remain near record tights despite mounting delinquencies and consumer stress. Beneath stable surface metrics, defaults are quietly rising in private markets, setting the stage for an abrupt repricing as the 2026–27 maturity wall approaches.
Institutional Research Team
Don Johnson - MacroEdge Chief Economist
Six - MacroEdge Head of Research
John Insall - MacroEdge Macro Analyst
Good evening MacroEdge Readers,
The US economy continues to operate at a dual speed. The wealth effect, capex spend, and tariff bullwhip effects have shown strong headline economic performance, with the labor market continuing to exhibit significant signs of weakness. The effects of a near total reversal in immigration create the conditions for continued weakness in labor growth, with the government shutdown creating a substantial blind spot in economic data, just as the Fed has restarted its cutting cycle. The current environment has been one of expectations of decelerations in growth, despite active fiscal support and a hyperactive hyperscaler capex boom. RealGDP’s Q3 revision to 3.8% questions the need for the cuts the STIR market is pricing. However, delinquencies and defaults are rising, along with the reversal of labor conditions that took the labor market to one of its strongest states in history.
There is substantial divergence between the goods and services economies. Measures of “old economy” performance have shown significant weakness, while tech-heavy “new economy” metrics show continued strength. Manufacturing surveys suggest entrenched high pricing while new orders tread water.
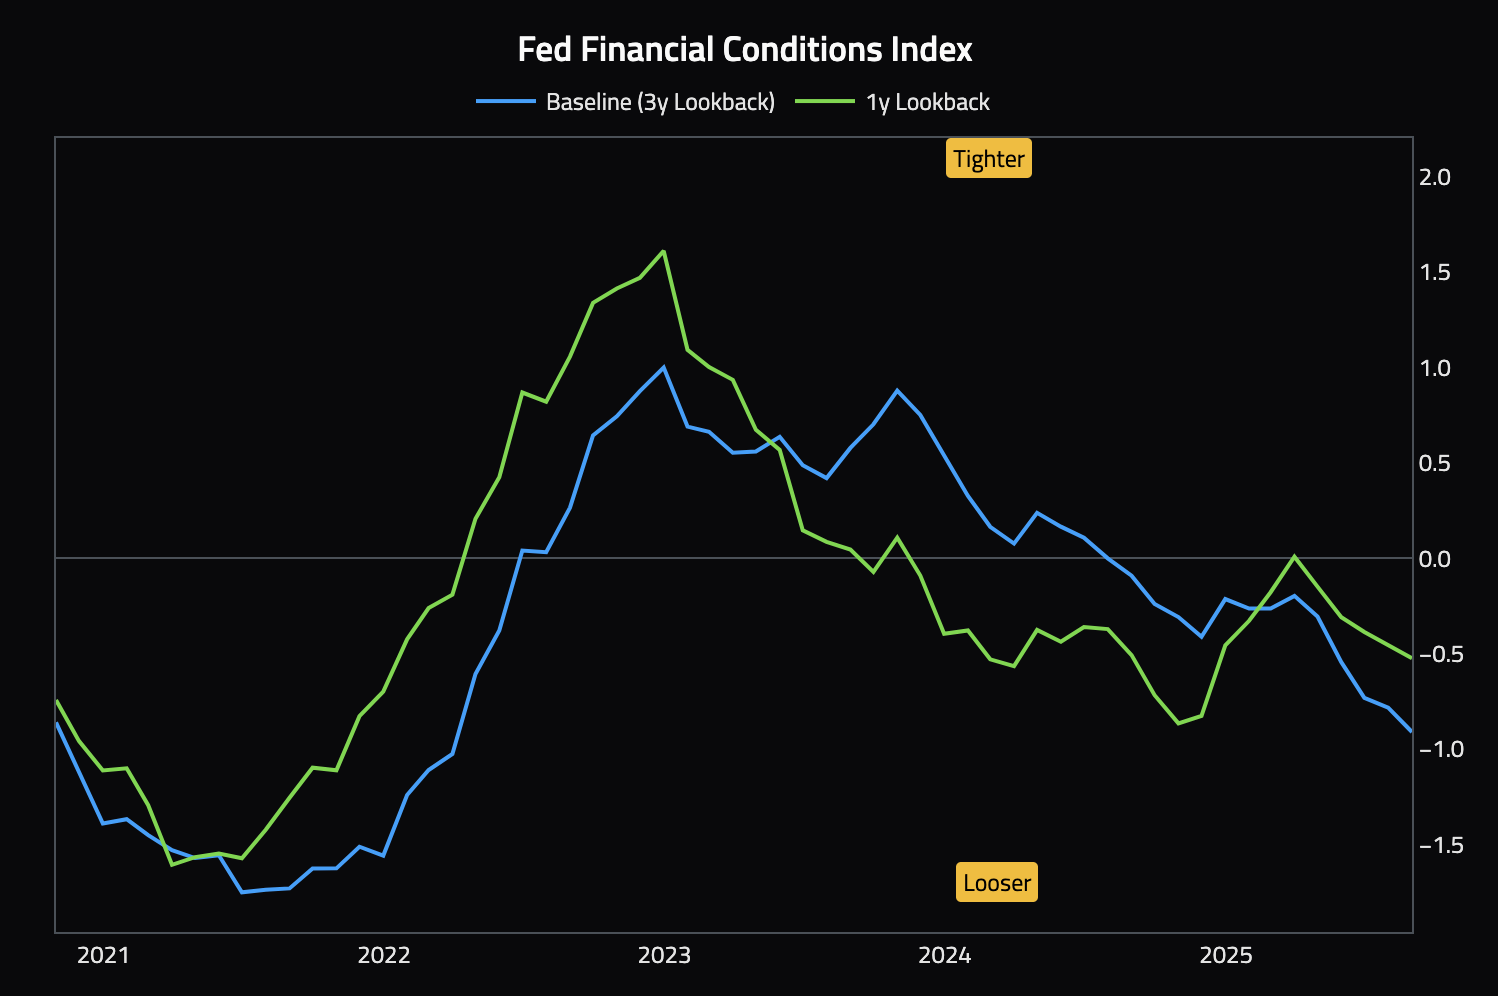
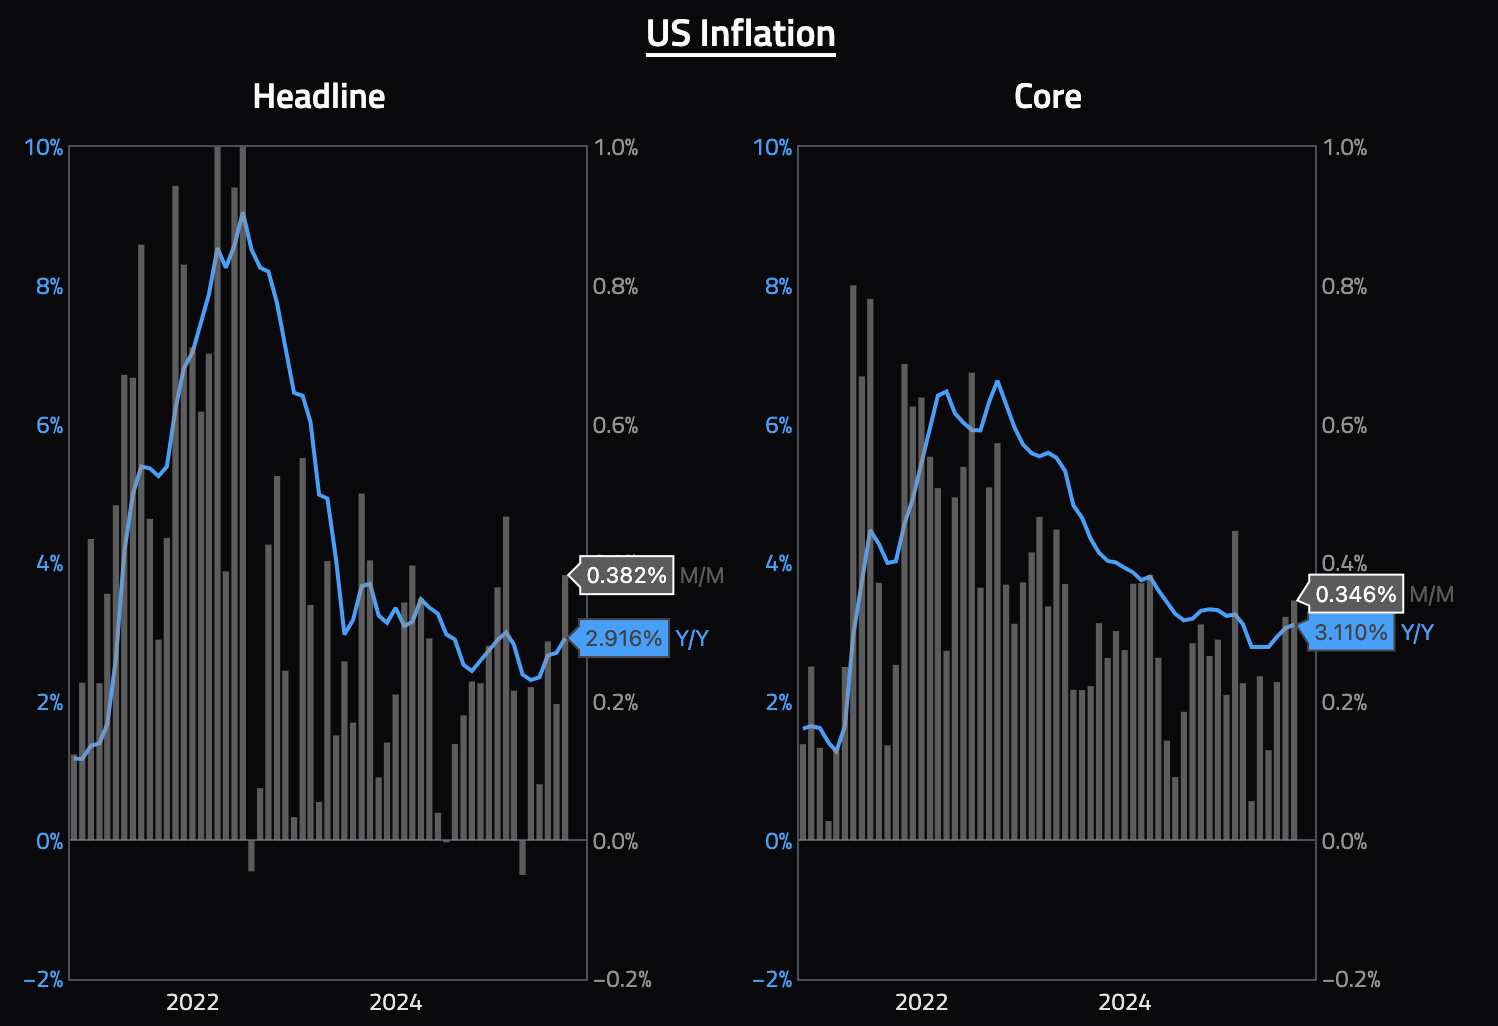
Inflation has remained sticky, with the last leg proving difficult and the Fed continuing to move the goalposts on the timeframe expected to return to its 2% target, despite years of above trend inflation. The fiscal side’s repeated statements to the effect of growing out of the debt, while putting enormous pressure on the Federal Reserve to lower interest rates to help stimulate growth. This dynamic draws parallels to the post WW2 era when they ran inflation and growth hot, cutting debt to GDP roughly in half.
Perhaps the most significant factor in Q4 will be the Supreme Court’s decision on tariffs. Should the court uphold the tariffs, we can expect a meaningful headwind to growth, as evidence has shown that the vast majority of tariffs are, in fact, being paid by US economic participants. Should the tariffs be reversed, we would look to short bonds, as trillions of dollars in future tax receipts are removed from the outlook, and their drag on growth eliminated.
Broad equity valuations are rich, with extreme concentration in the Mag 7 at the index level, dragging SPX forward PE ratio up to 23. Equity exposure at the index level now grants high levels of exposure to the artificial intelligence thematic, just as Mag 7 earnings growth is set to decelerate. Enormous capex announcements seem to hit the tape daily now, hugely rewarding the stock prices of the partners providing the infrastructure. Deep fiscal deficit spending continues to provide the largest tailwind to risk assets. Earlier this year, we saw just how rapidly risk will reprice should fiscal policy take away the punch bowl.
China’s withholding of rare earth elements has put natural resources in prime focus, as globalization reverses. Primary areas of interest in the equity markets are miners of, and the infrastructure providers to natural resources and critical minerals supply chains. The trend of reducing reliance on foreign providers of critical resources is one that we expect to persist, and one that is still in its infancy, while the effects on the demand curves of the underlying commodities is still unclear.
The energy and healthcare sectors look extremely attractive on a relative and investment basis. Last month, we covered healthcare with a spotlight on UNH, and the outlook has not changed there. Although the most attractive entries into select healthcare names have been captured, the sector still enjoys large tailwinds from boomers entering their peak consumption years.
From a factor lean, capital with medium to long term holding periods is likely to be rewarded in small cap value, especially as large cap growth valuations are highly extended. We saw enormous outperformance in small cap value following the peak in the tech bubble, and expect that when multiples stop expanding in tech, this cycle will exhibit meaningful parallels.
Tech in the meantime continues to power higher, and echoes and expectations of a repeat of 1999 are growing. Fiscal deficit spending, now with Japan joining the party, and procyclical expansionary fiscal policy, and a White House put under equity prices seem to have created the perfect storm for such stocks to move higher.
Opportunities for the Left Tail: Are we Fantasizing in a New Normal? - Don Johnson (@DonMiami3), Chief Economist
Good early October MacroEdge Institutional Research Community,
As we turn into the fourth quarter, which usually goes by quick due to the holiday season and many of us traveling - we’re starting the subject of my portion of the Institutional Research Report (#03) - with a question: are we fantasizing about a new normal? I am wrapping up the intro & final details to this Institutional Research report from California, a state I’ve seldom come to visit, but have had a fantastic experience this go around.
In past market cyclical downturns & in identifying tops - similar market participant behavior has been observed - mass retail investment, households getting involved in the action, an increase in margin debt driving equities higher, and most importantly: the belief in a new normal.
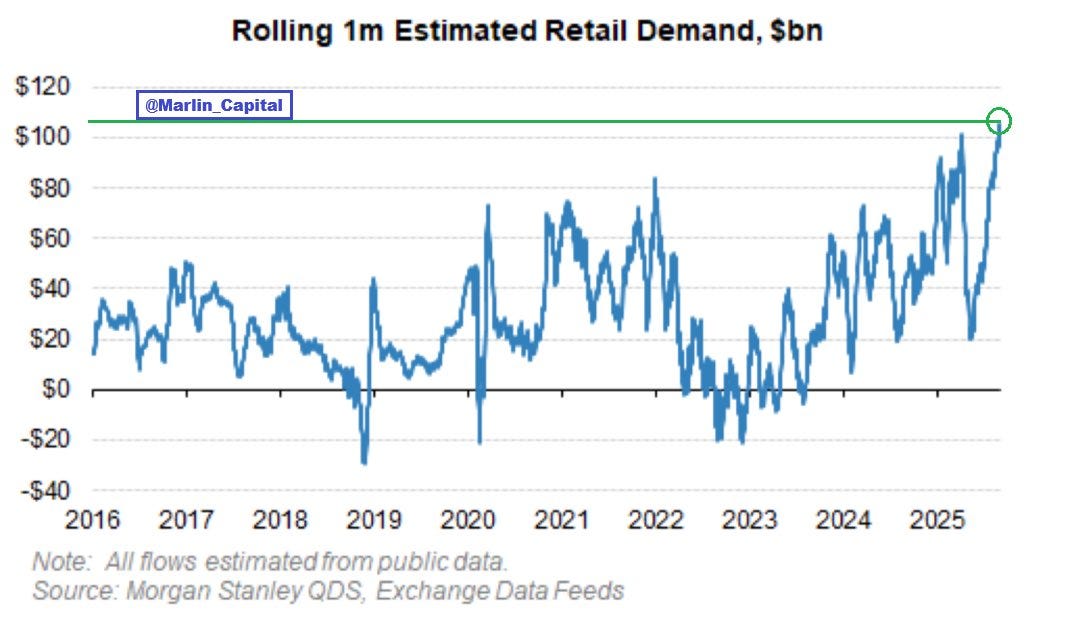
While the belief is grand, and what drives market speculation and bubbles to new highs, it rarely is sustainable with this combination of factors involved. Even though we (or I) might hold more belief than ever in the fact that fiscal, and even monetary policymakers will move quicker than ever to intervene & prop up asset prices, of which their holders drive a larger % of our economy than ever before, it still doesn’t make markets infallible to significant periods of volatility and extended drawdown. Take for example, the retail inflows of the last month, which totalled over $100bn:
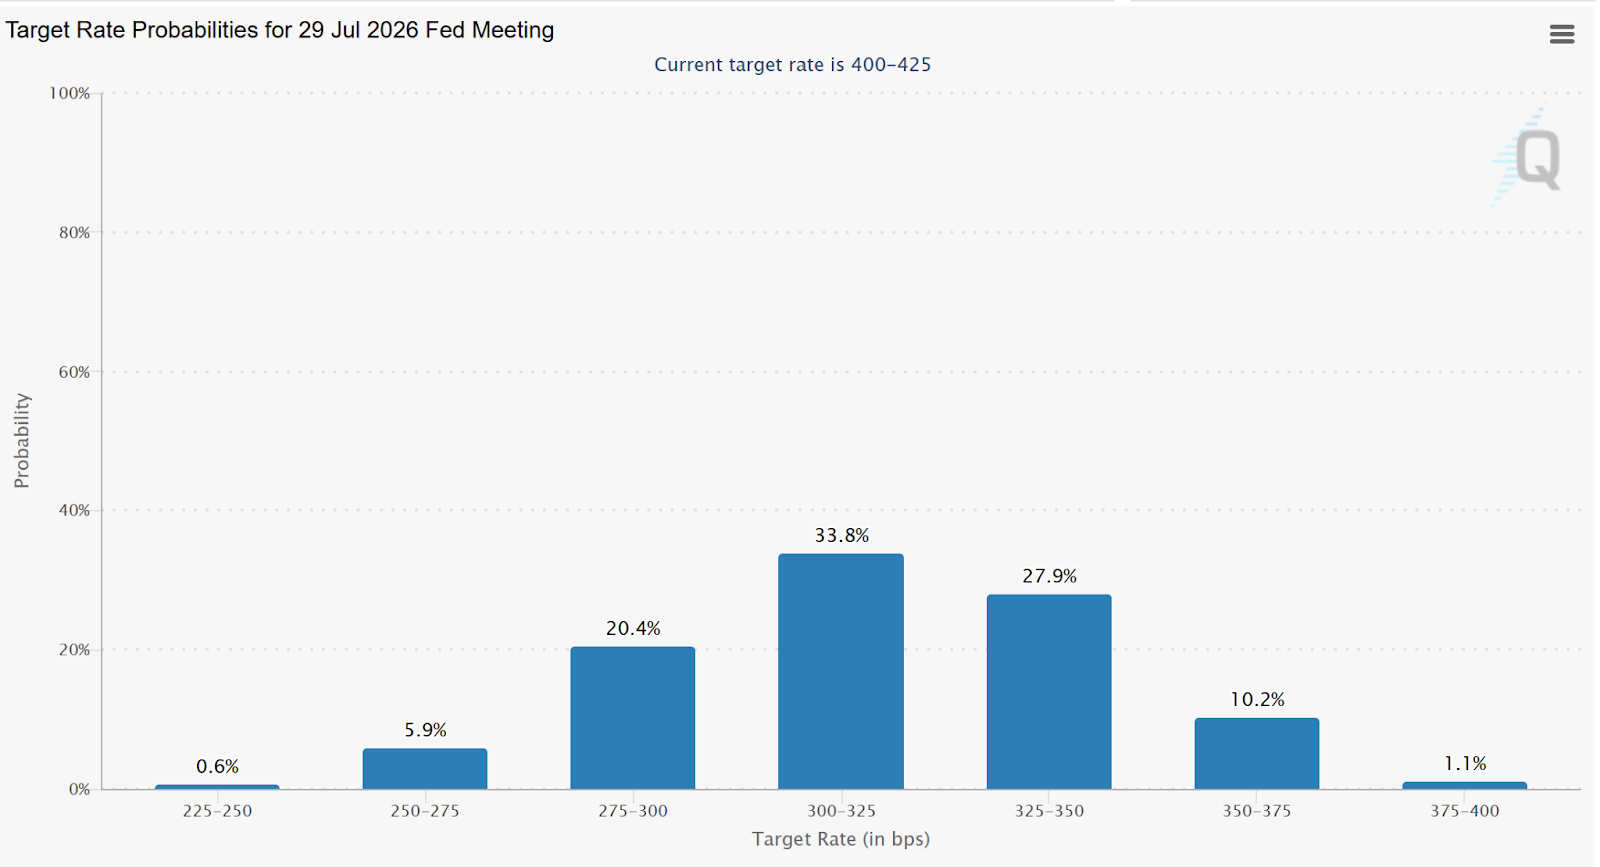
I haven’t ever experienced a bubble so broad where a conversation in the background, or one that I am involved in, deviates into ‘AI’, ‘LLMs’, unicorn fairy dust coins, or whatever the latest delusion potion of the day is for grand riches & a modern society powered by people speculating and gambling en masse from their smartphones doesn’t seem like a sustainable one, thus assumably based on history - this one will face a similar ending - though from a timing standpoint we cannot assume because we are in a bubble it has to stop going up. Take for example, societies where their domestic currencies have failed and investors lose trust in every single asset class except speculation, performance of equity markets on paper and in data looks brilliant. Top portfolio strategists are now calling for 50 & even 100% years ahead as the Fed prepares what now looks to be two more consecutive rapid rate cuts, as other global central banks around the globe continue to rapidly reduce rates. While the inflation genie may be smaller than he was back in 2021, gold & other commodities continue to paint warning signals for a significant global macro event that hasn’t yet dented equity markets in the US.
For those wondering about what MacroEdge Institutional Research is, what we’re building, how we’re delivering it, and how to become an Institutional Research client, you can learn more by getting in touch with our team and on the Institutional Research page of our website, below:
For existing MacroEdge Ozone clients, you can now transition your account over to an Institutional Research one by visiting your legacy Ozone account, & in the ‘Account Management’ section, select MacroEdge Institutional Research. You will be sent a link within 1 business day to complete that transition over your account and any sub-users you would like to add to the profile. You will also be able to do this on the updated Institutional Research Substack, which will be discoverable at MacroEdgeIR(dot)Substack.com. You can also complete the signup process directly at the link below:
For those that submitted a MacroEdge Institutional Research trial request form back in September, we haven’t yet processed outbound invite link emails, and we apologize for the delay. Please stay tuned as we return from travel to receive an email by the end of Friday. Trial access will be valid for a full 30-days upon registration, with no charge. Note that with an IR account, your Ozone account will be disabled and upgraded automatically to the dashboard interface, which includes account management.
Sections of ‘Are we Fantasizing in a New Normal?’
The Era of Protecting the Asset Class Continues
Retro Japan Facts
Flying Blind with Data - Relying on Private Sector Data
Employment Situation Continues to Worsen
Piloting a Left Tail Strategy - the Global Macro Strategy Portfolio (GMSP)
Bubbles Mean Opportunity - Looking at the Super Bubbles
Homebuilder Struggles are a Major Red Flag
Carry Trade Reload & Dollar Death & Debasement
The Era of Protecting the Asset Class Continues
In this section, it’s key to realize and understand the realities of a very complex economy that we find ourselves in today - this section is not designed to take a position one way or the other for or against the macro backdrop of fiscal dominance and pro-asset policies that we see today, but rather lay out the situation and outline how we can make money from this backdrop.
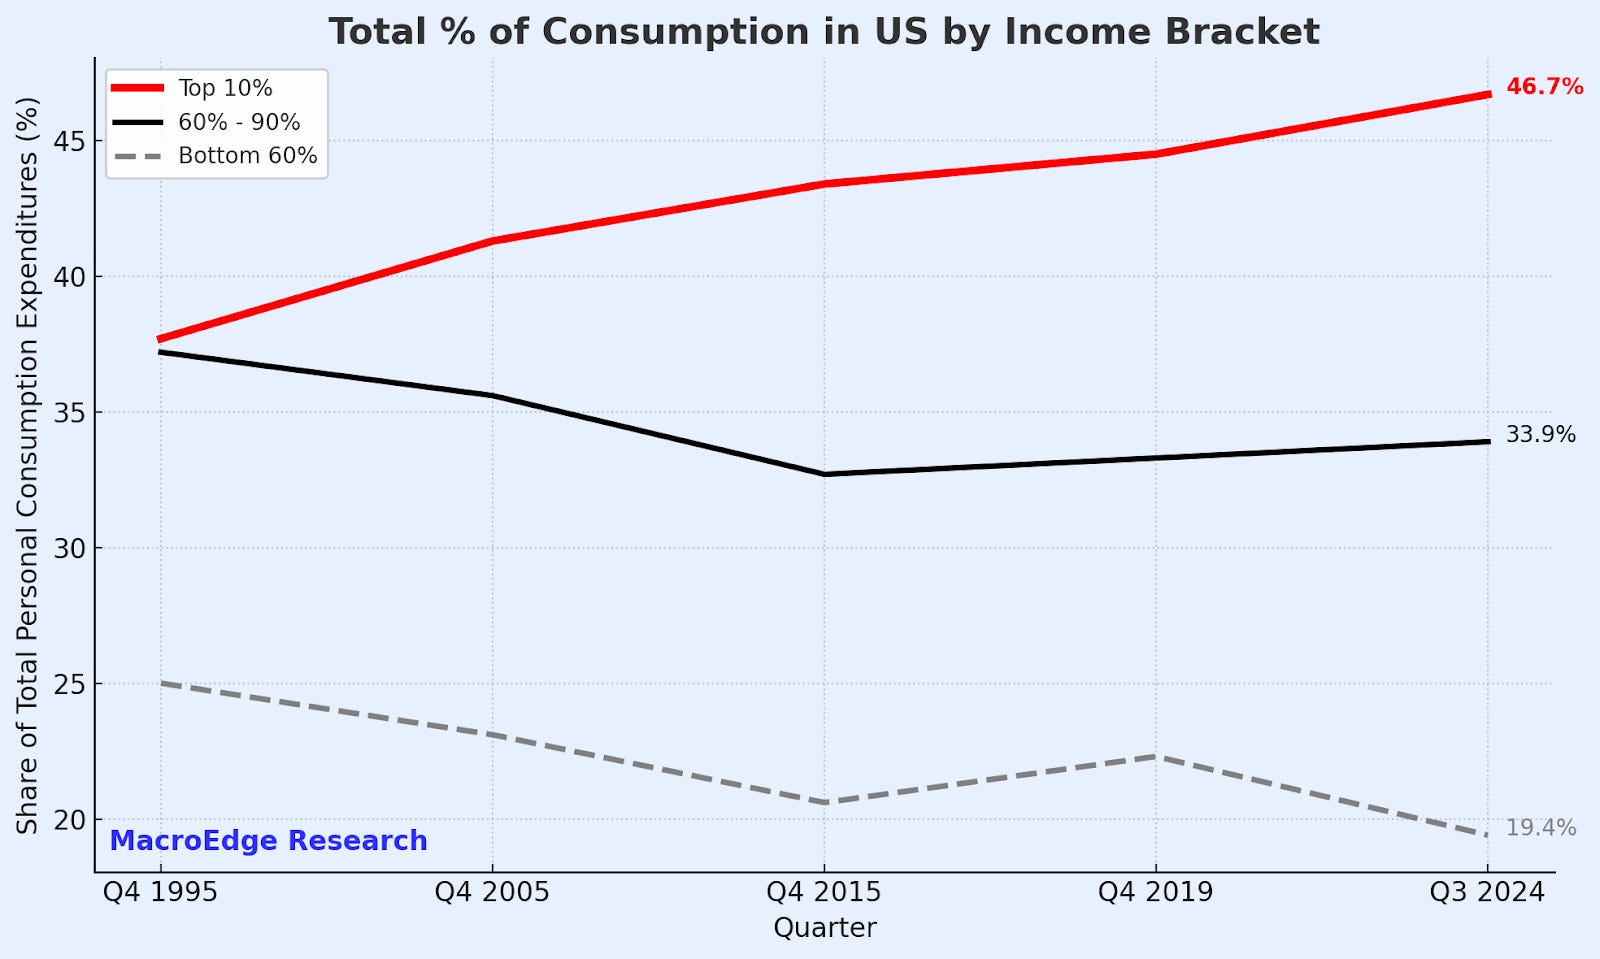
While the phrase - the equity market and Wall Street are not Main Street - rings true to a degree today, still, there are many reasons why it no longer rings true, concurrently. A larger portion of consumer spending than ever before come from the top 1 and 10% of the American income base. At the very top of that pyramid, we have the true ‘asset class’ - a limited portion of the population setting fiscal (and to a degree, even monetary) policy - leaving us to ask whether or not the American middle class was a roughly 7-decade anomaly from the post-WWII days.
When we’re defining the ‘asset class’ - we can narrowly label it as those who see significant benefit from nominal asset price appreciation - whether it be in real estate, cryptocurrency, equities, bonds, what have you.
The equity market is cold-hearted - especially in a stagflationary environment. We’ve seen equity action go completely bananas this year - even as the bottom 50% of consumers have struggled immensely (look at everything from who’s purchasing homes, to who’s purchasing goods, cars, you name it…). Take a look at the trend in consumption from 1995, with the most glaring category being the bottom 60%:
Do we care? I’m not here to run for office nor is that a desire - but the facts are the facts on the situation.
Retro Japan Comparison
Flying Blind with Data - Relying on Private Sector Data (ie: MacroEdge)
With the government shutdown now being used as a tool to conceal critical economic data from those analyzing it, we’re shifting into a ‘new world’ in the macro-sphere. Not only does this make our situation a lot more challenging, it’s encouraging firms like our own to develop our own ways of tracking what the heck is even going on with our massive, and very-complex economy.
With incompetence and fraud leading from the top down of government in blocking visibility into our key data, it’s up to private sector firms like our own to lead the way on transparency and reporting going forward, as this data concealment will now be a tool used going forward, and as with many things involving politics and politicians, it’s unlikely to be a one-off event.
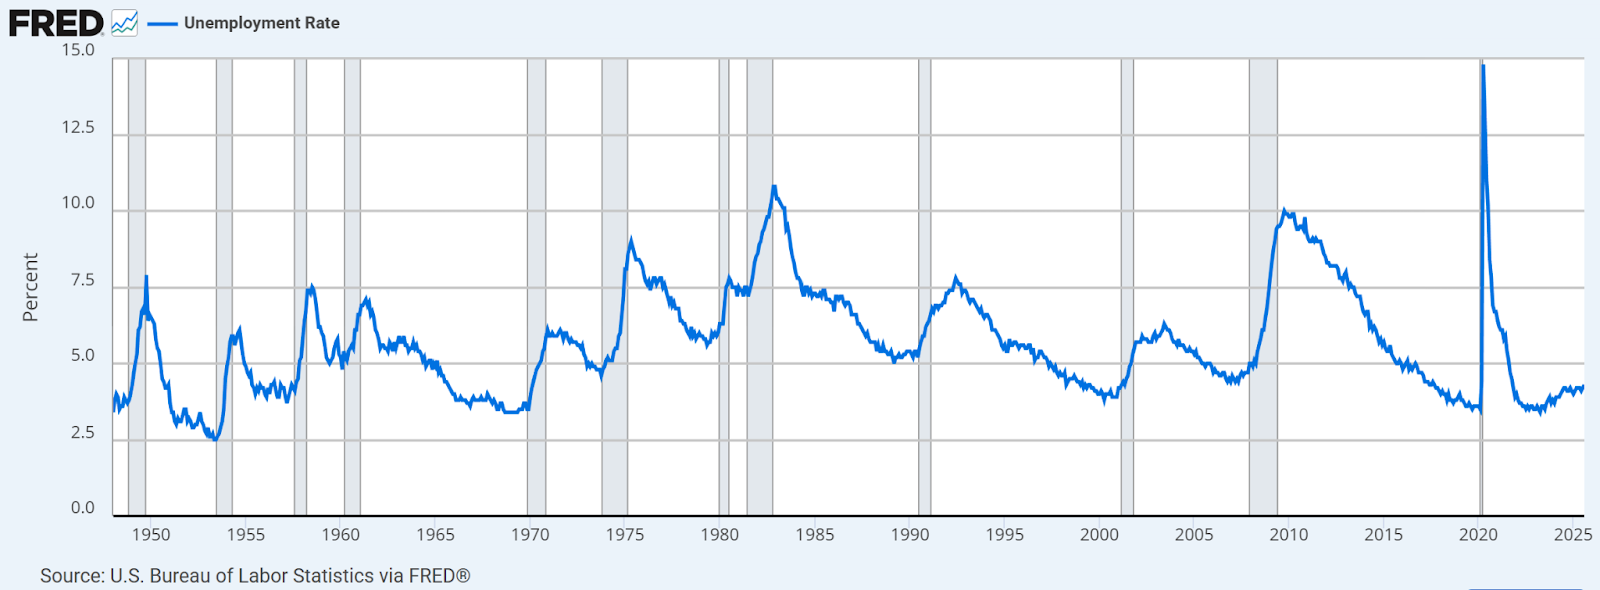
Employment Situation Continues to Worsen
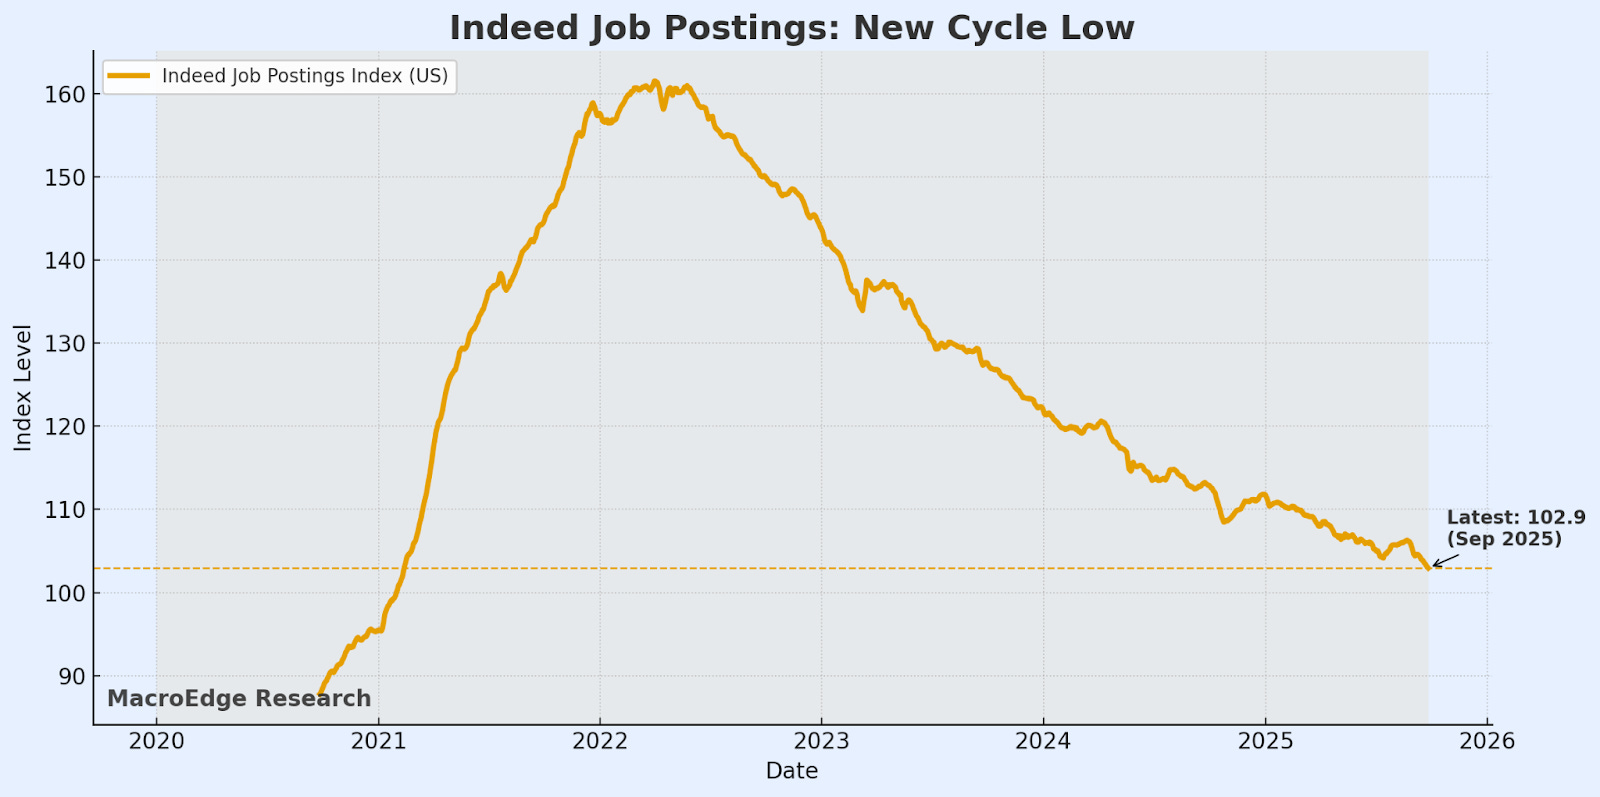
Regardless of how one wants to cut it - this is the weakest jobseeker and job market since 2010 or so. Retail hiring this year will be the softest since 2009, and the labor market continues to trend weaker - with layoffs still quite elevated, job cuts high, and job postings continuing to decline. I don’t need to beat a dead horse here since we’ve been talking about the softening trend here going on two years.
Piloting a Left Tail Strategy – the Global Macro Strategy Portfolio (GMSP)
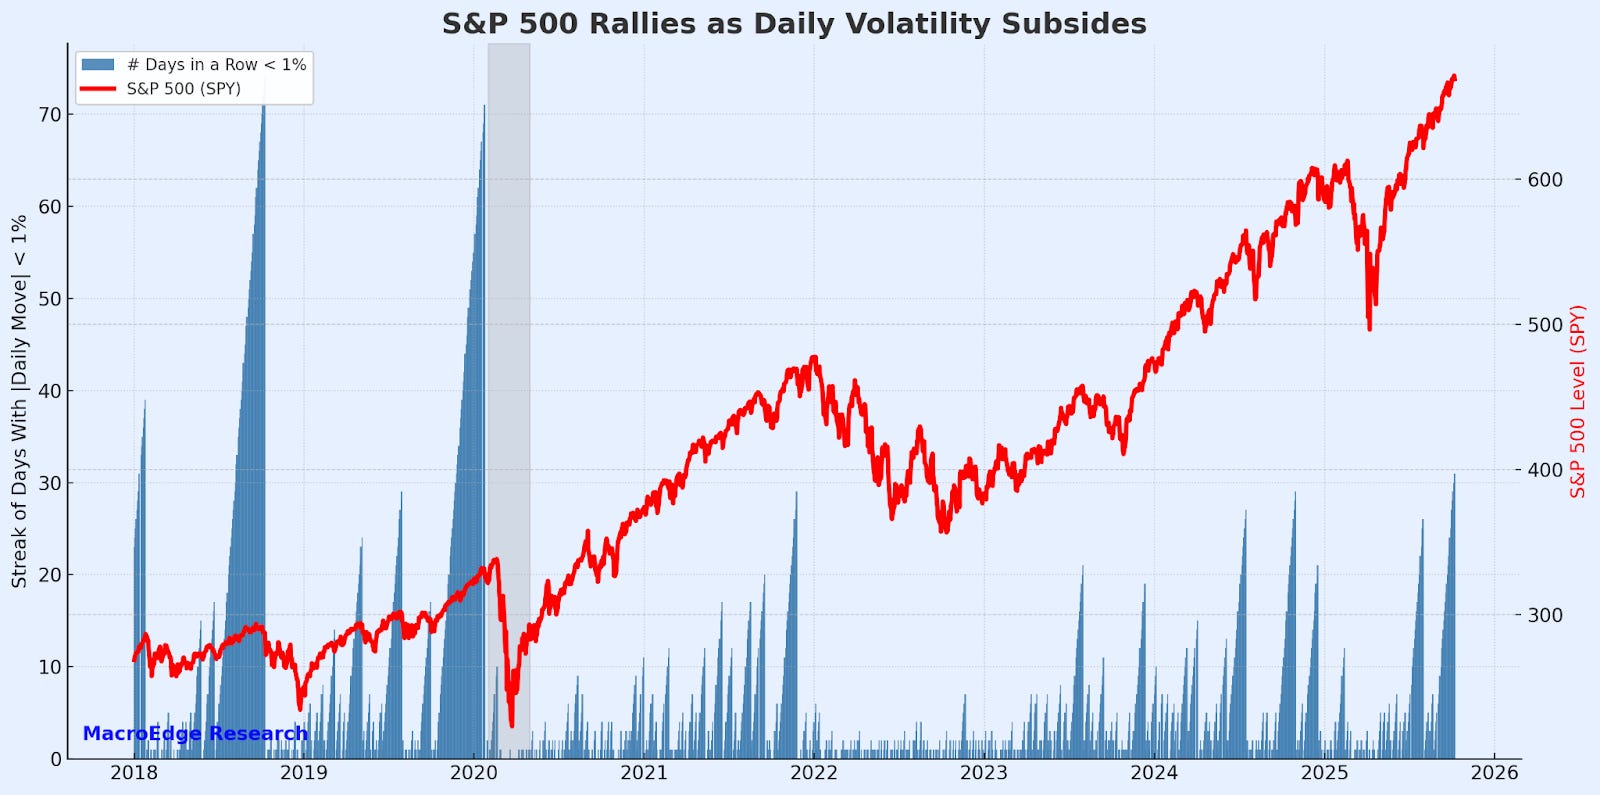
In piloting the Global Macro Strategy Portfolio (GMSP), we’re looking for major inflection points for both upside & downside. In the run-up from the April intervention lows, we’ve broken through gravity and have found ourselves in quite possibly the most obnoxious retail gambling spree since the peak-Dotcom days, and the late 80s in Japan, from a data standpoint. Speculation has run wild, as noted in the data - with the largest retail inflows on record, and we’re getting back into an environment that has warranted more caution in the past 8 years of data collection, such as with the number of days with less than a 1% move in the SPY:
The Global Macro Strategy Portfolio (GMSP) is built to exploit imbalance. While the rest of the market hides behind diversification and benchmarks, we target inflection. The portfolio seeks out the exact moment when stability fractures and reality resets. Every position is an act of conviction, not conformity. GMSP carries the same philosophical DNA as Universa, engineered to protect structural integrity while unleashing explosive convexity when the world misprices risk. It is not passive capital. It is a living system of asymmetry, designed to multiply when others freeze.
This strategy is built for disruption. It thrives on the tension between belief and truth, between what the crowd assumes and what data reveals. Left-tail and right-tail events are not threats; they are engines of return. One side monetizes crisis, the other transformation. GMSP is not here to blend in. It exists to find the edges of the map, to profit from dislocation, and to turn volatility into opportunity. When the next regime shift arrives, this portfolio will not simply withstand it. It will own it.
Bubbles Mean Opportunity - Looking at the ‘Super’ Bubbles
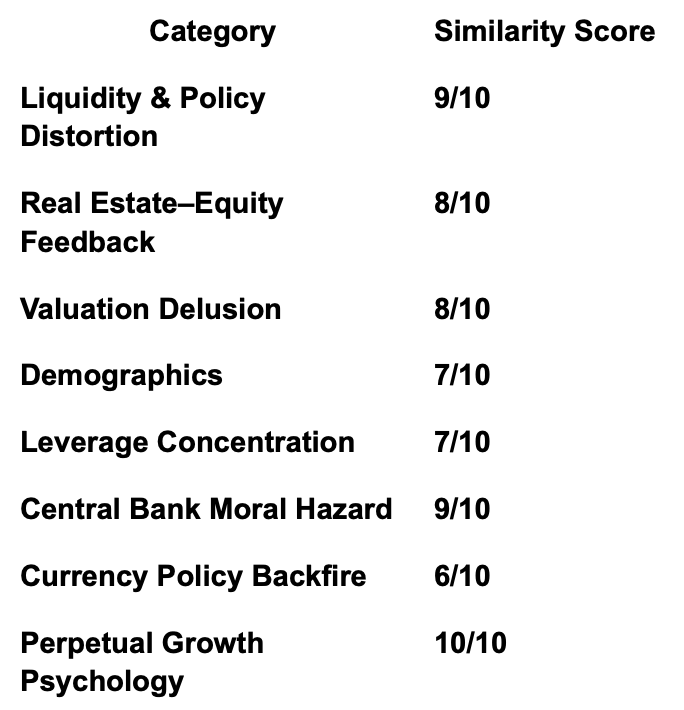
While popular portfolio strategists & TV pundits of today are considering this to be a ‘smaller’ bubble than the one in 2000 - they’re really missing the mark. At the point we’re at between housing, AI/equities, and cryptocurrency - we find ourselves with something much larger.
Where is the opportunity in this? Well, as we and others fantasize in this new normal - a lot of opportunity is presenting itself under the surface, yet again.
Outside of the ‘super’ bubbles - there’s a lot of sectors that haven’t participated… Looking at energy at just one of those examples, as well as other global equity markets in places like New Zealand. On the other hand, in identifying where the current bubbles far, one doesn’t have to be overly selective in discovering them… Take for example Spain’s IBEX35 in example #1, the most overbought since early 2007, backed by ECB easing and large migration from South America as drivers.
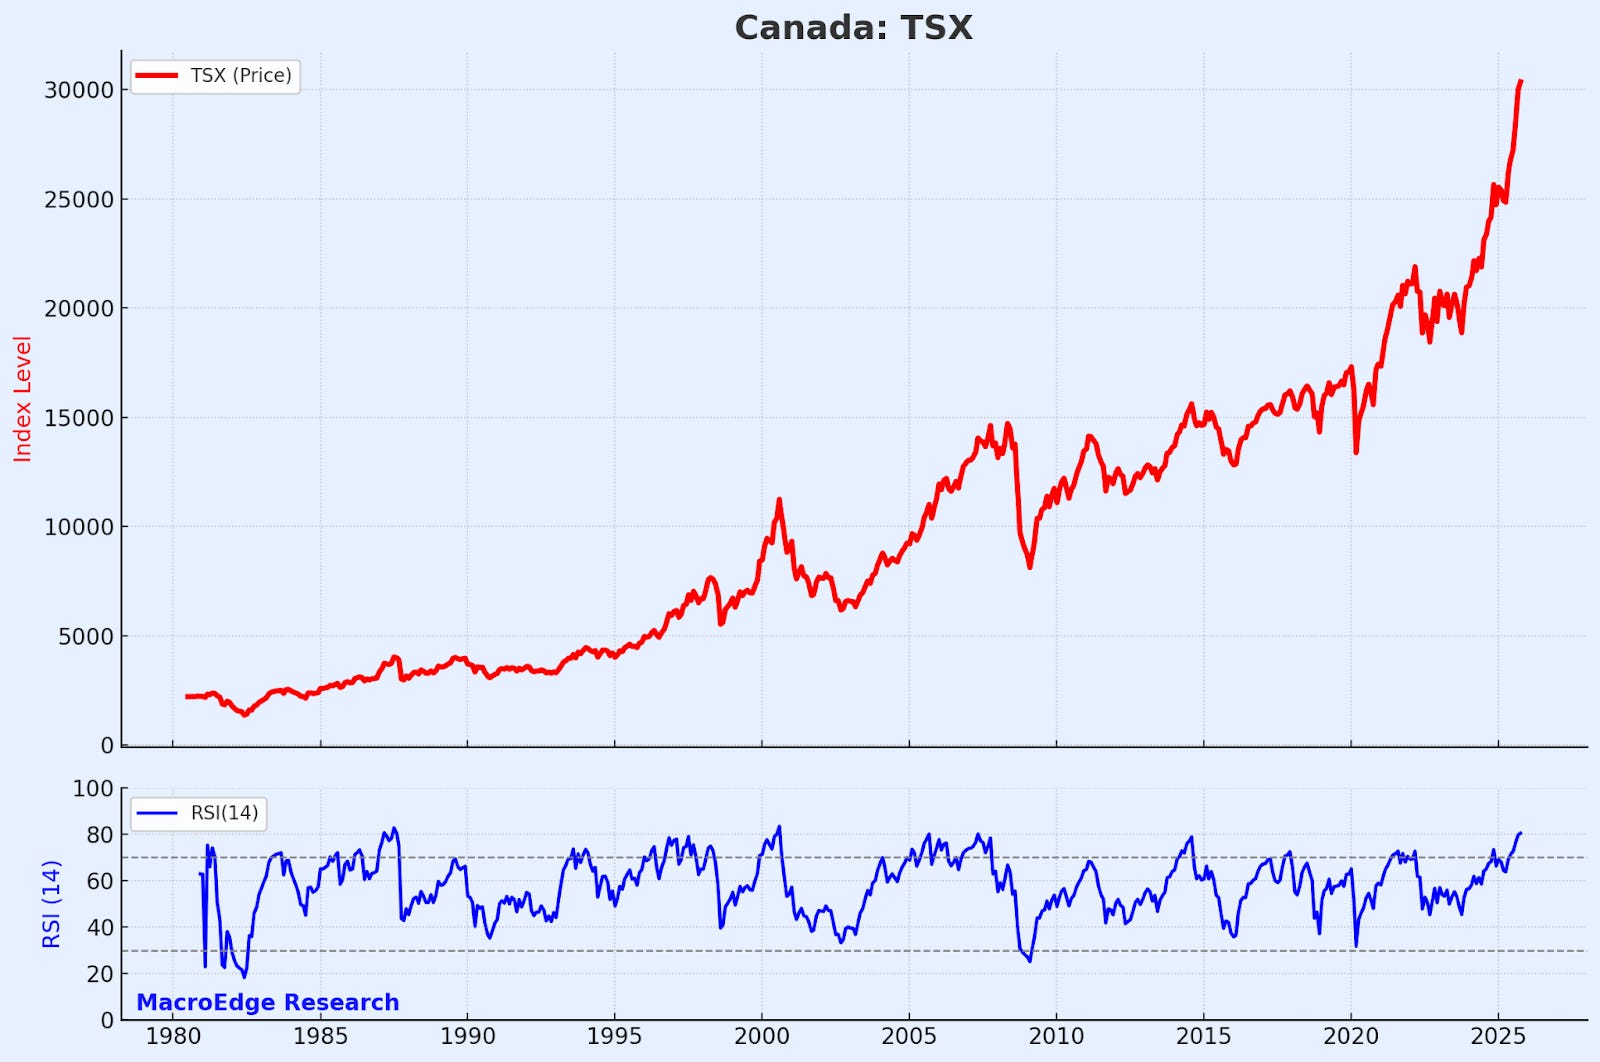
Not AI top of the list you might say? We’ll get there - but we can turn our attention to Canada next, where the Bank of Canada is embarking on a rapid easing cycle as the labor market continues to melt away, mortgage arrears rise sharply, and inflation has begun ticking higher:
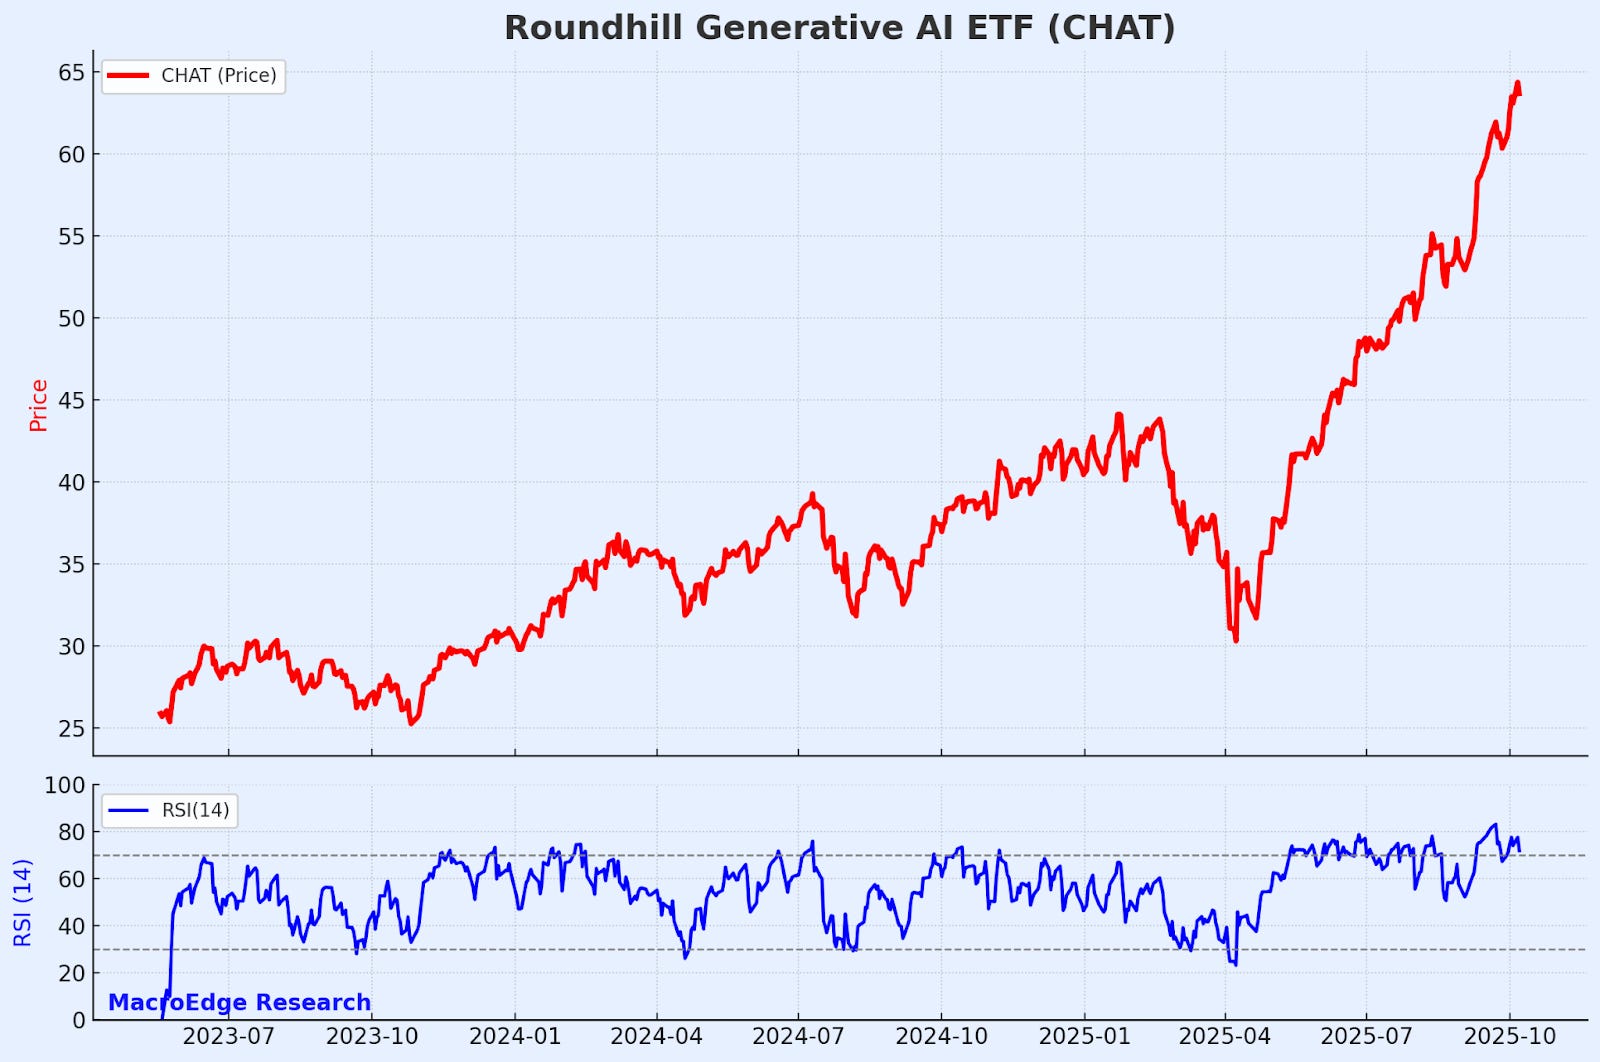
Bubble #03: Generative AI, of which 90% or more has zero positive profit impact, and most firms report no positive impact in their own implementation processes:

The terminology growing in popularity is ‘slop’... it’s not that there isn’t useful adoptive application for generative AI & LLMs, it’s that the current priced impact is about 1000x ahead of where the technology currently stands. With issues with freshwater and power likely to surge into the lens of policymakers, especially as midterms come into view, and as these issues come into a broader light, don’t think that this road to Valhalla is one that is going to continue to accelerate straight up past Jupiter:
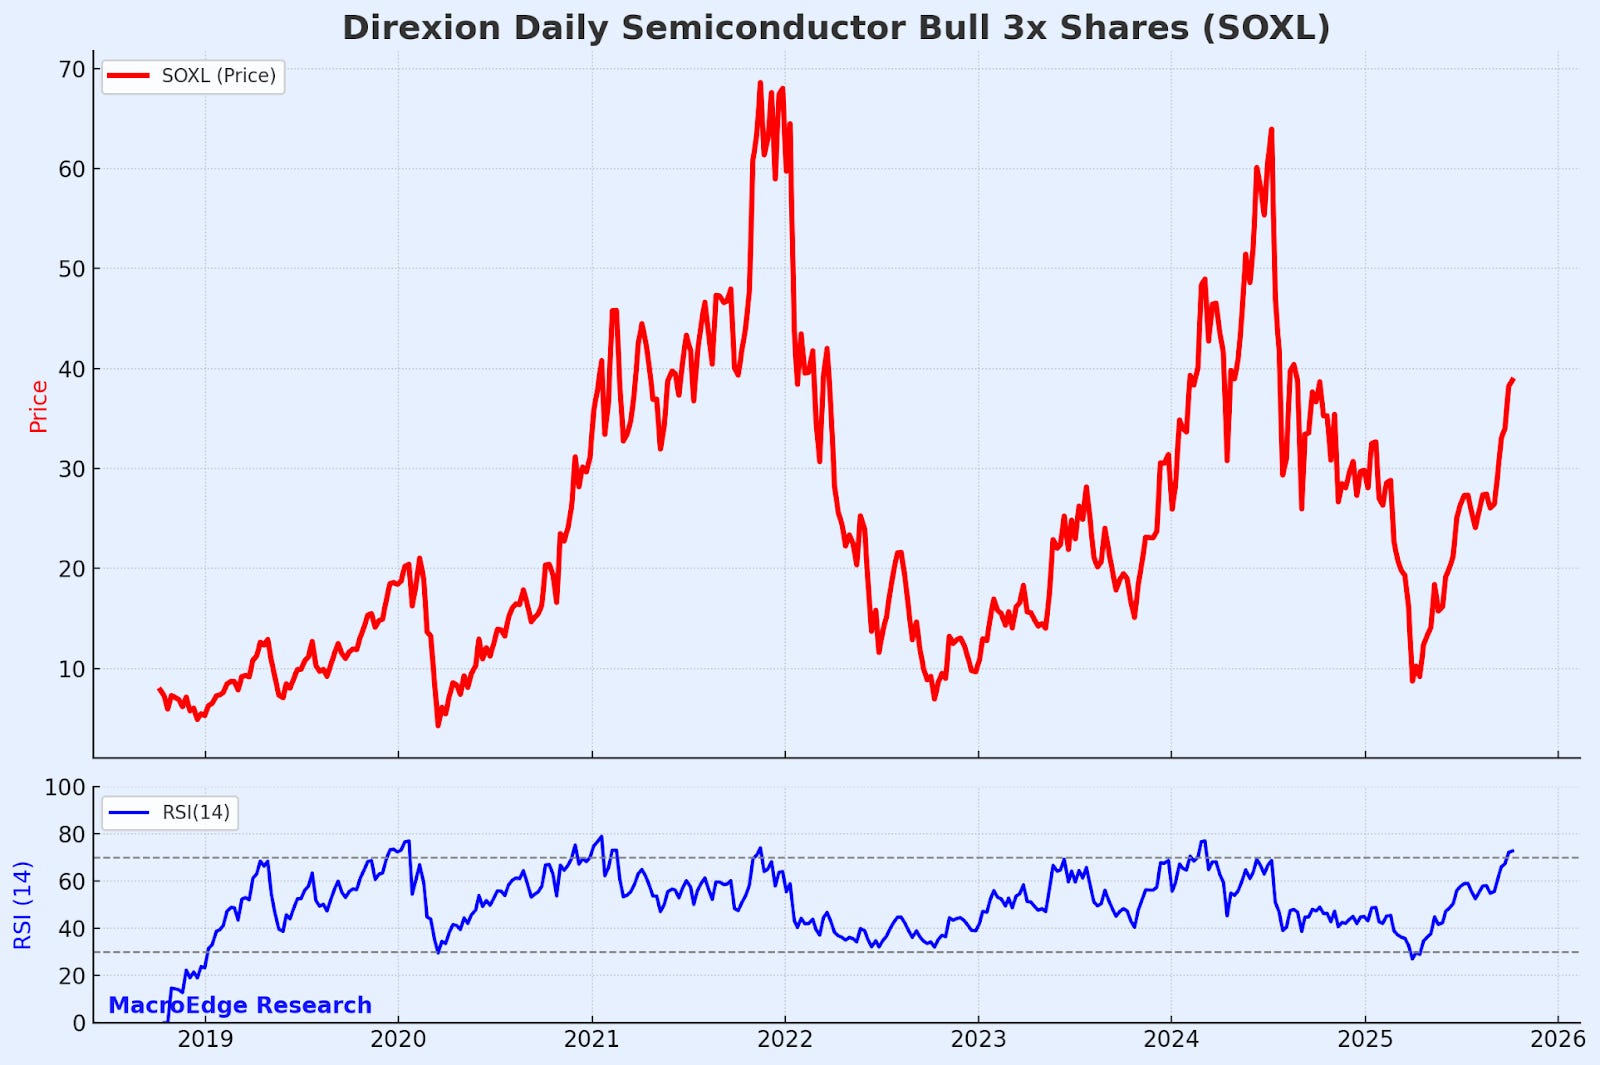
Bubble #04: The 3X leverage bubble. With hundreds of these new ‘ultra’ leveraged products coming online and available to retail - historically, the launch of these products en masse has been a major red flag, especially when their purchasers don’t have a clue how they even operate… SOXL (Semiconductor) stands out like a sore thumb again from the April lows:
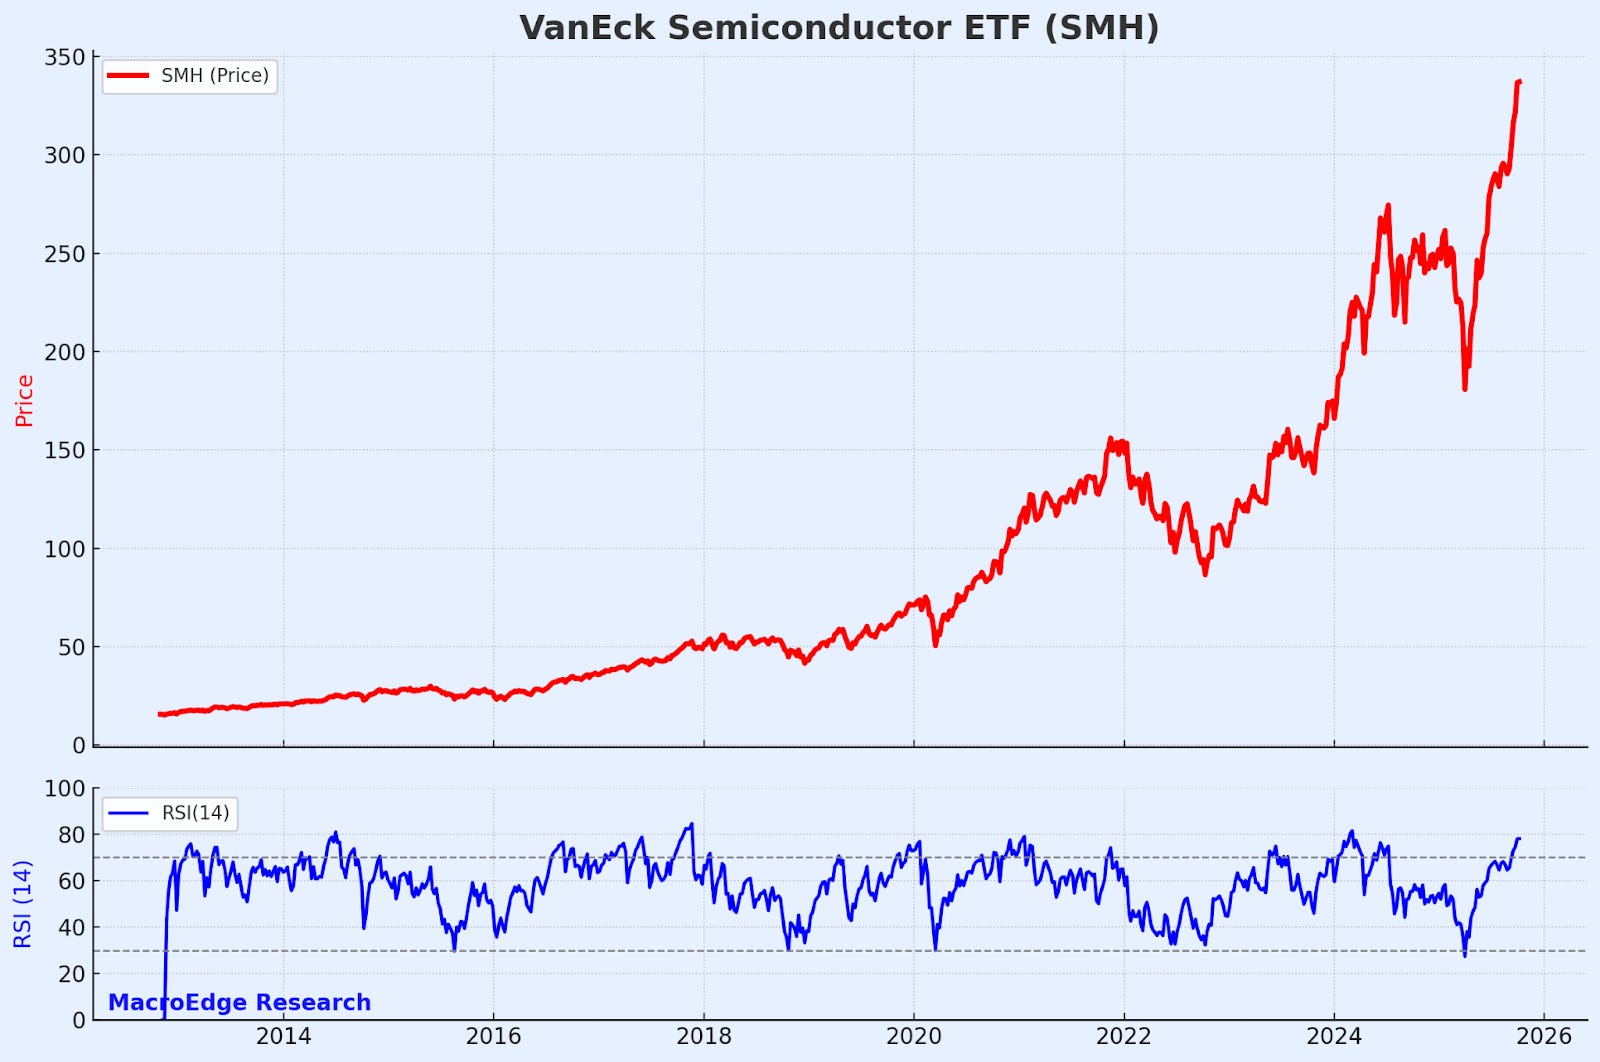
Bubble #05: the semiconductor sector, propped up on complex financial deals and LOIs of late, it’s astonishing how far the can kicking went from the April lows. At the helm of much of the ‘nonsense’ are Huang and Su, who just happen to ironically or (un) be related - if you think that semiconductors aren’t a cyclical sector and this is going to continue unabated for the next decade - I strongly encourage additional research on the space.
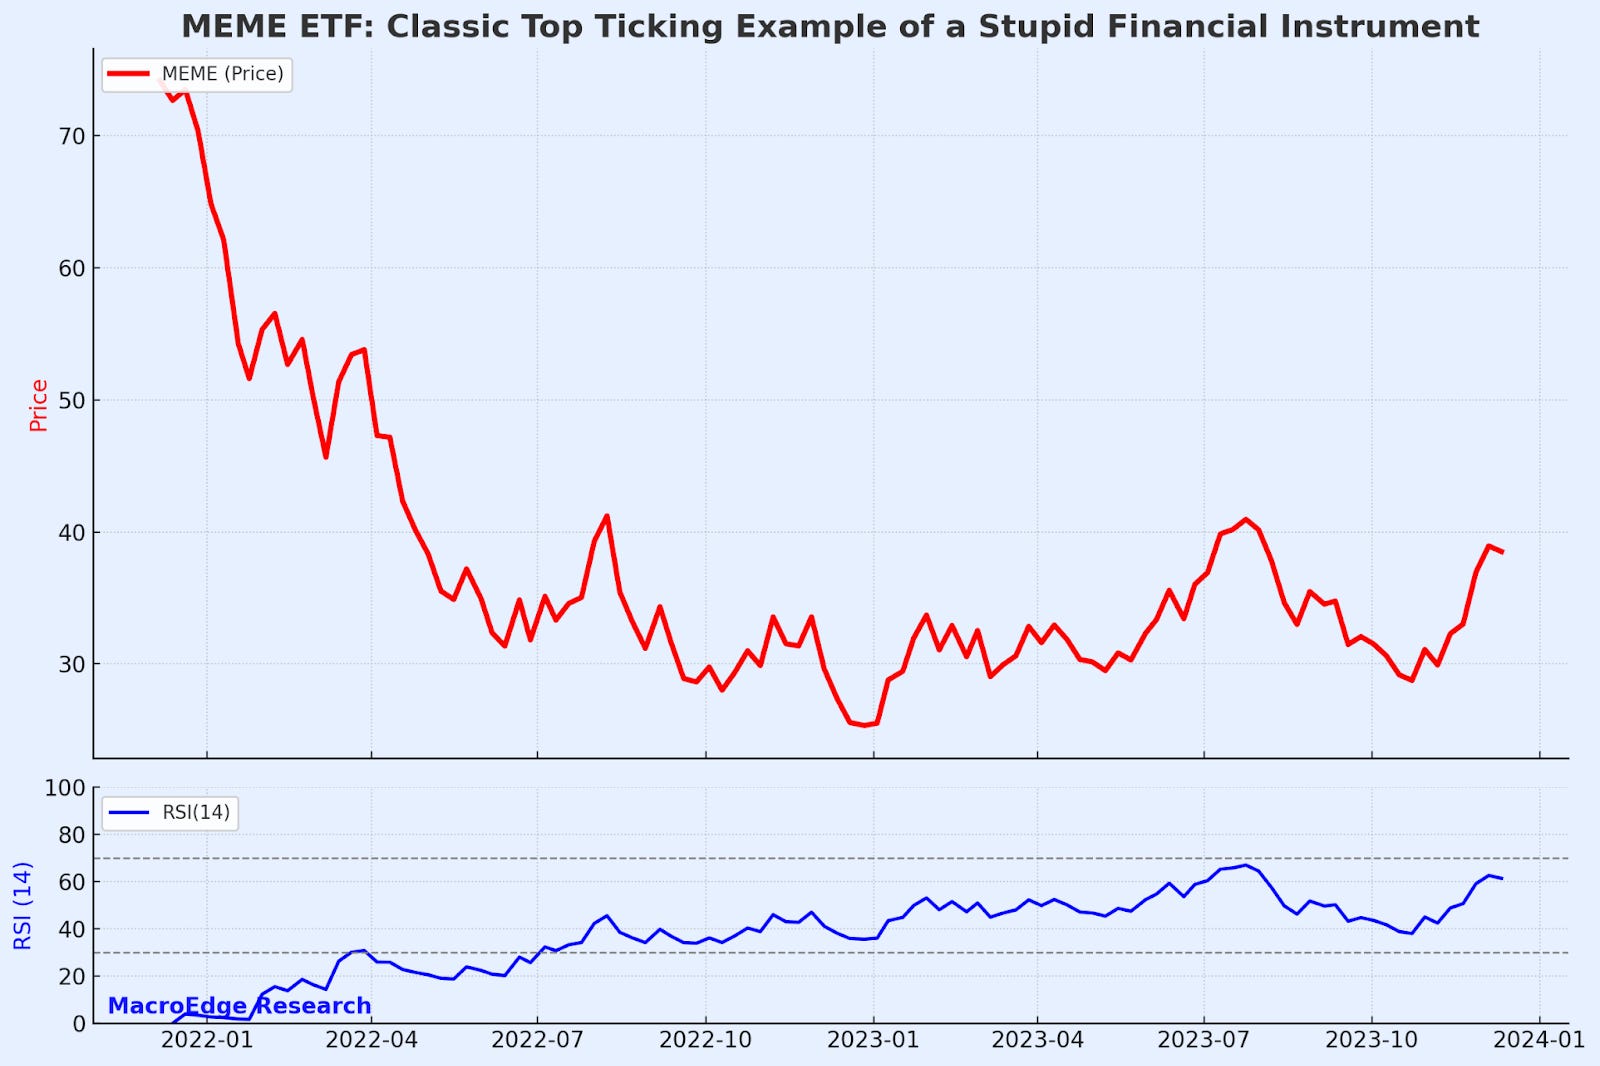
Note past examples of stupid, gambling like instruments marking major tops:
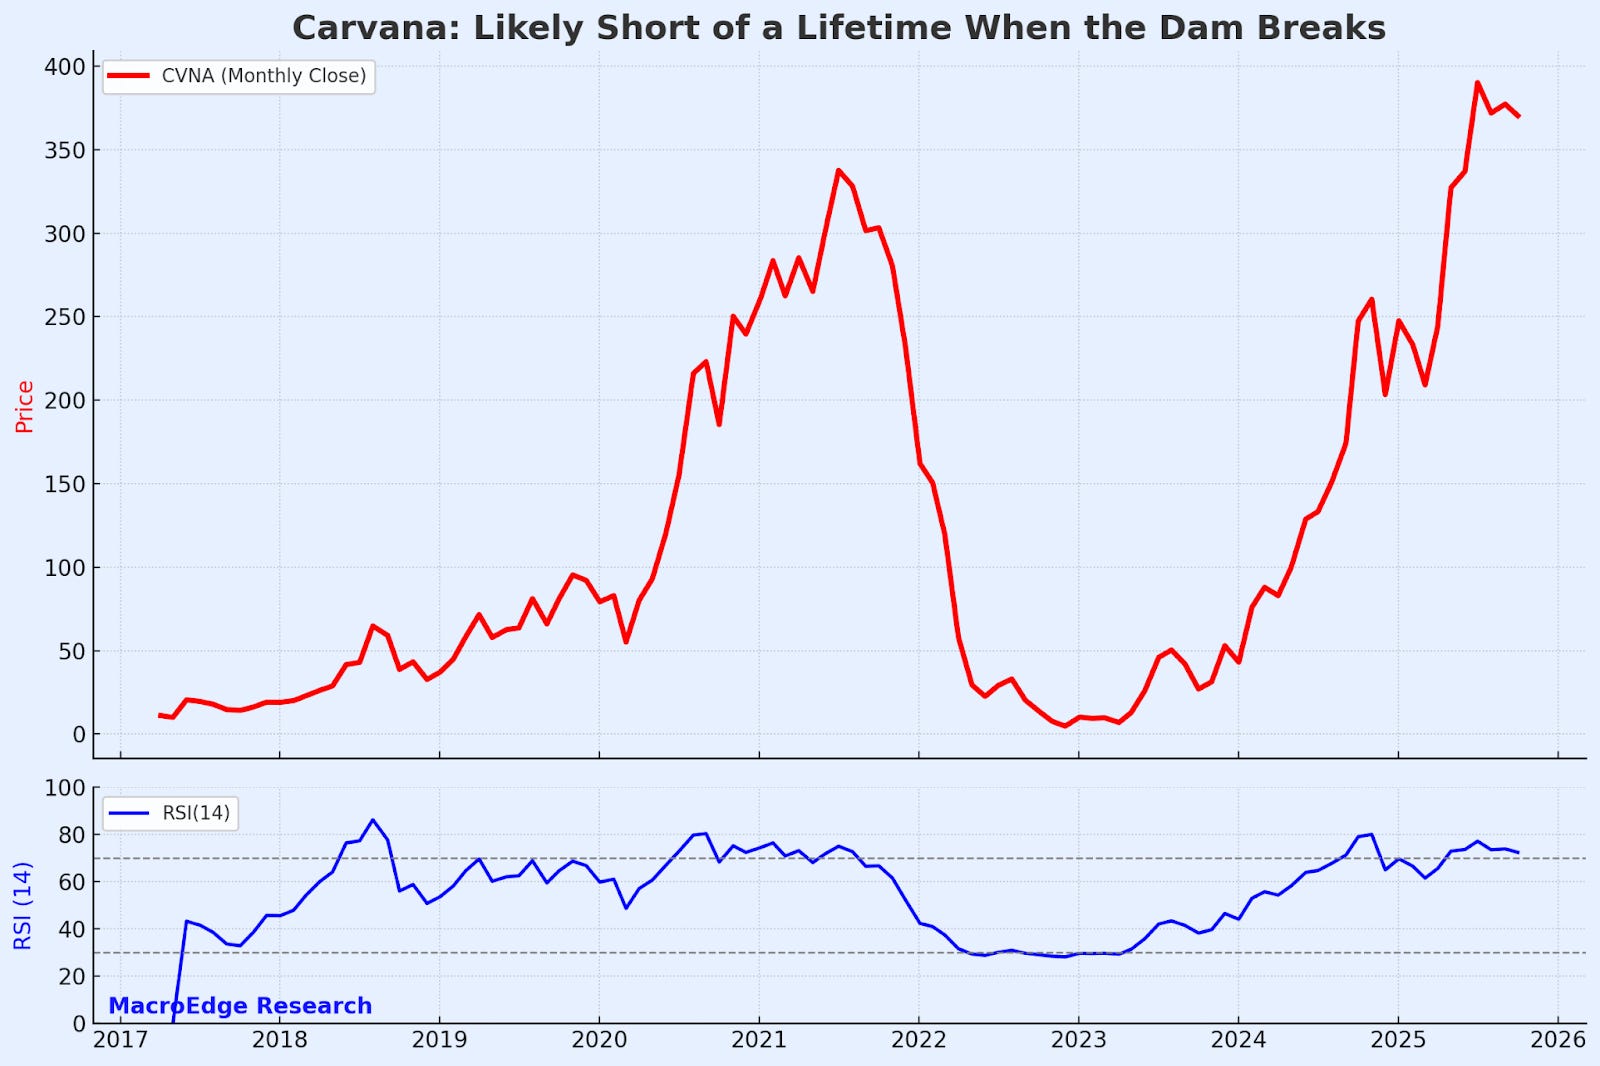
Bubble #07: The Subprime Auto Bubble
There’s so much more here, but this gives us a starting point in the sheer number of bubbles floating around in markets today…
I might be a little bit old fashioned here, but a tweet I sent out today resonated positively with those value-aligned on a pro-human approach to business. There’s a strong and very unique opportunity for businesses that place a pro-human & pro-experiential approach to their customer treatment and business development practices, which have been abandoned by many large firms today. Take for example your major airline, or even your small logistics operator - are they really aware of how their customers are doing, or do they even care? Making life more difficult for customers is something that is going to cost these firms in the long run, as they pile on vaporware bills in the expectation that it’s going to drive some magical impact that just isn’t there.
Homebuilder Struggles are a Macro Red Flag
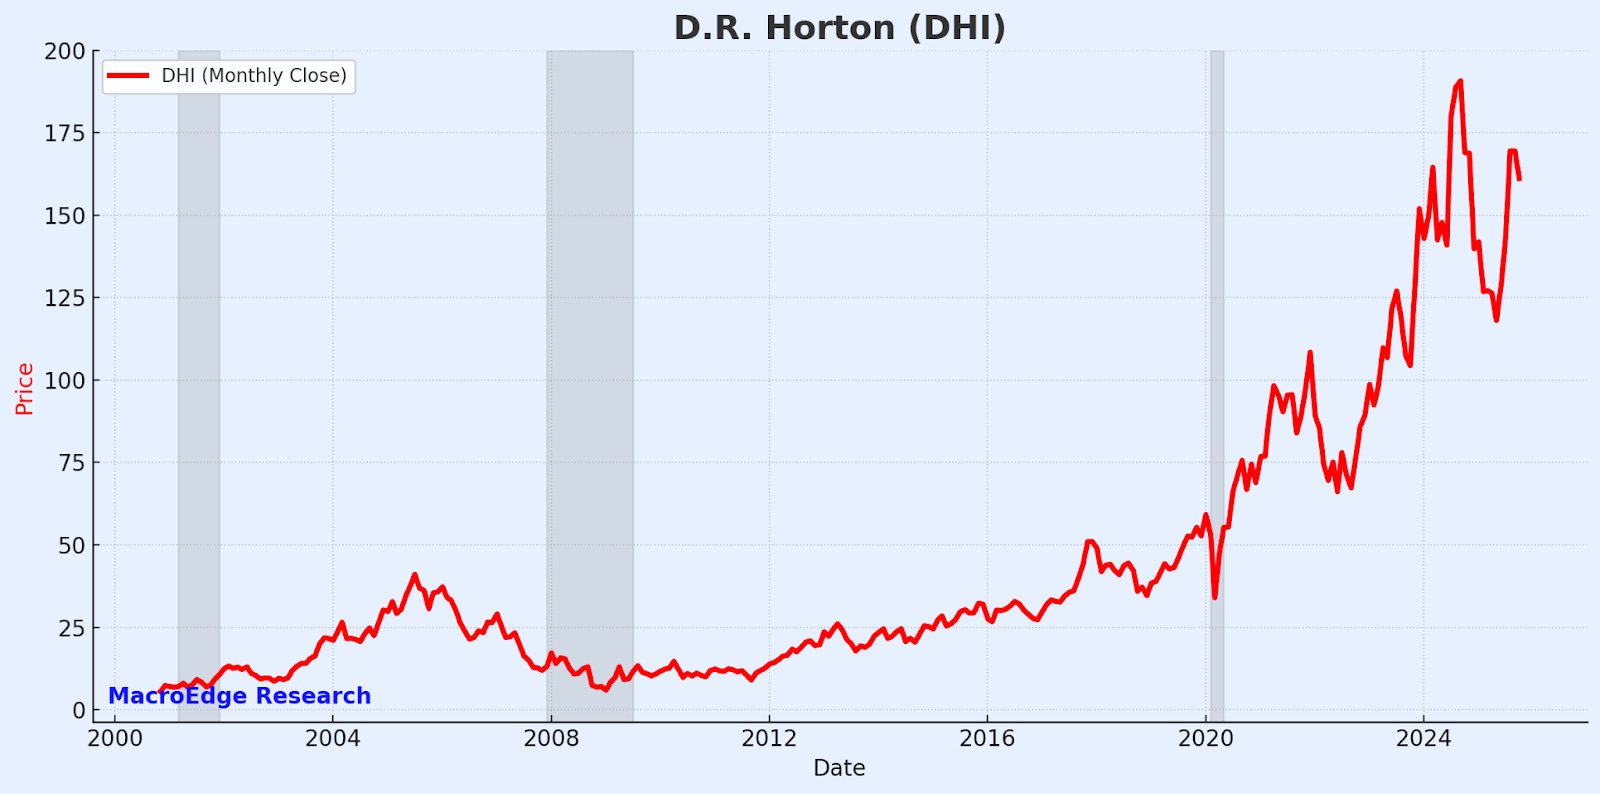
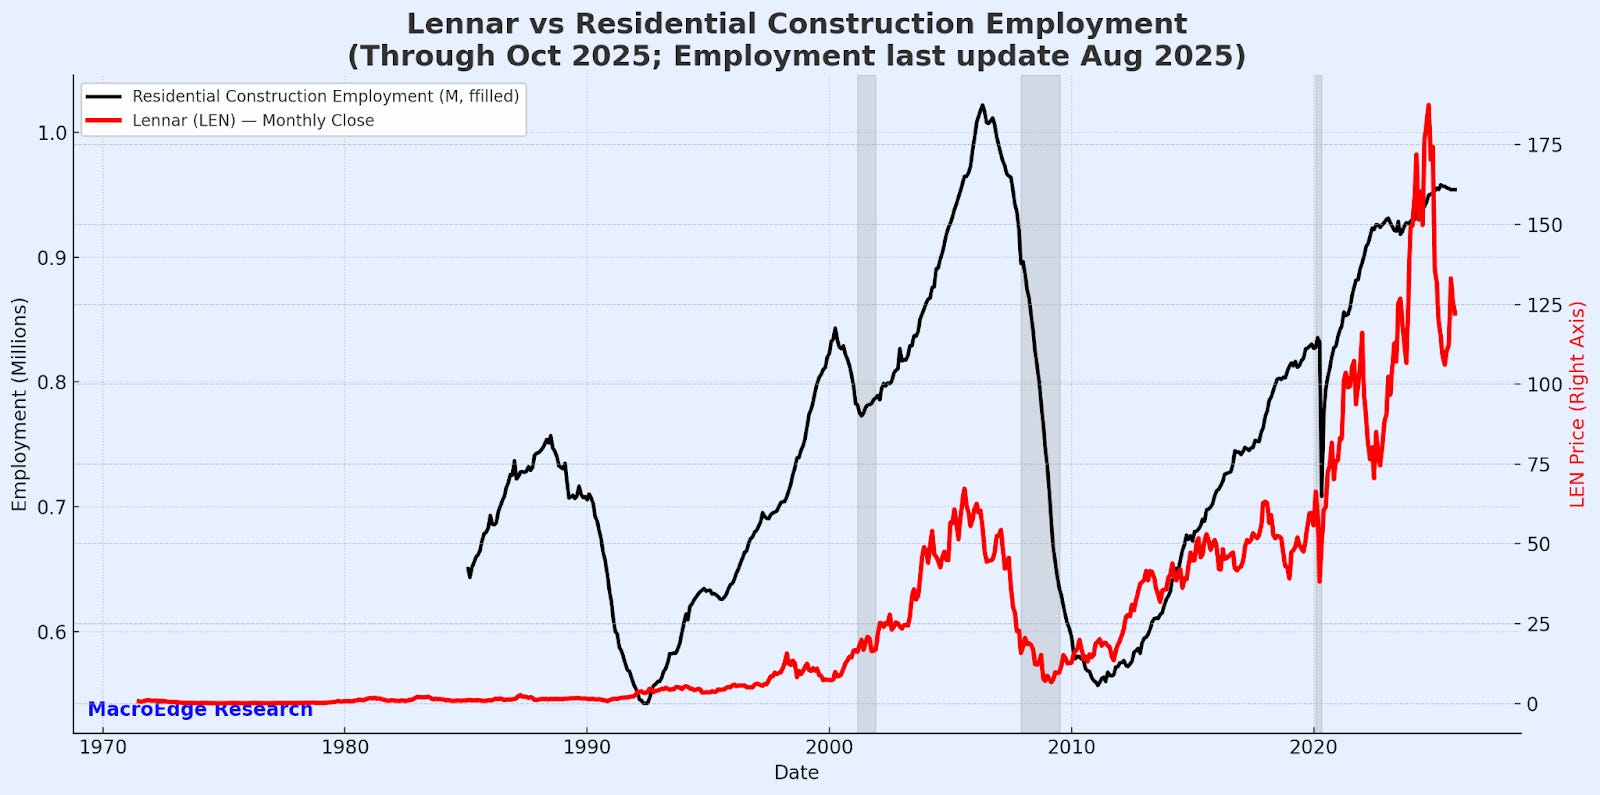
Homebuilders are flashing major warning signals as leading indicators to the broader macro picture - take for example three major, and very different homebuilders:
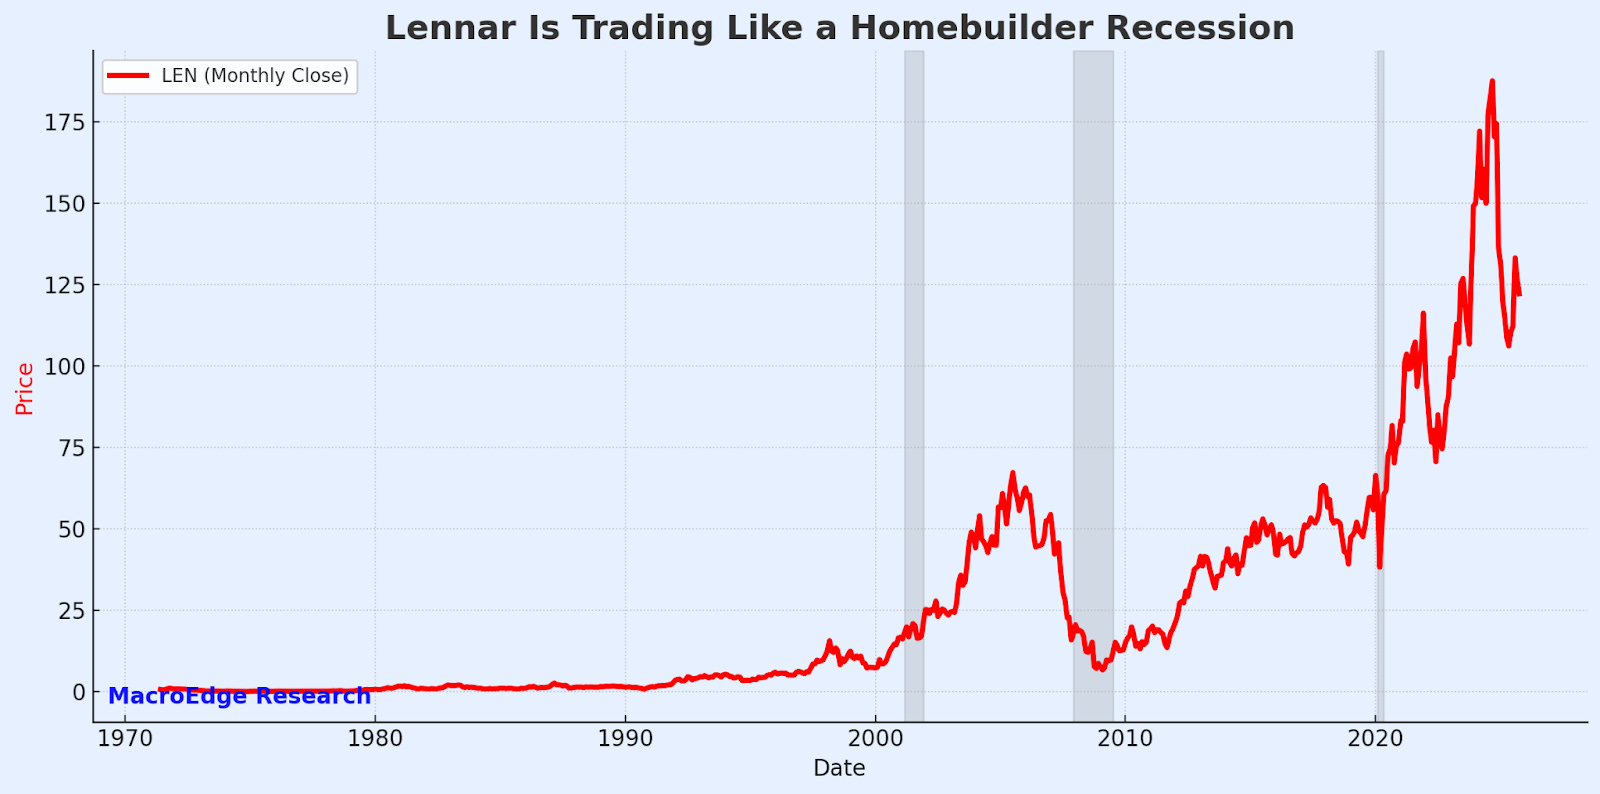
(LEN) Lennar above is trading like it’s in a recession… which it is, alongside other major homebuilders… note the leading nature of the builders before the GFC…
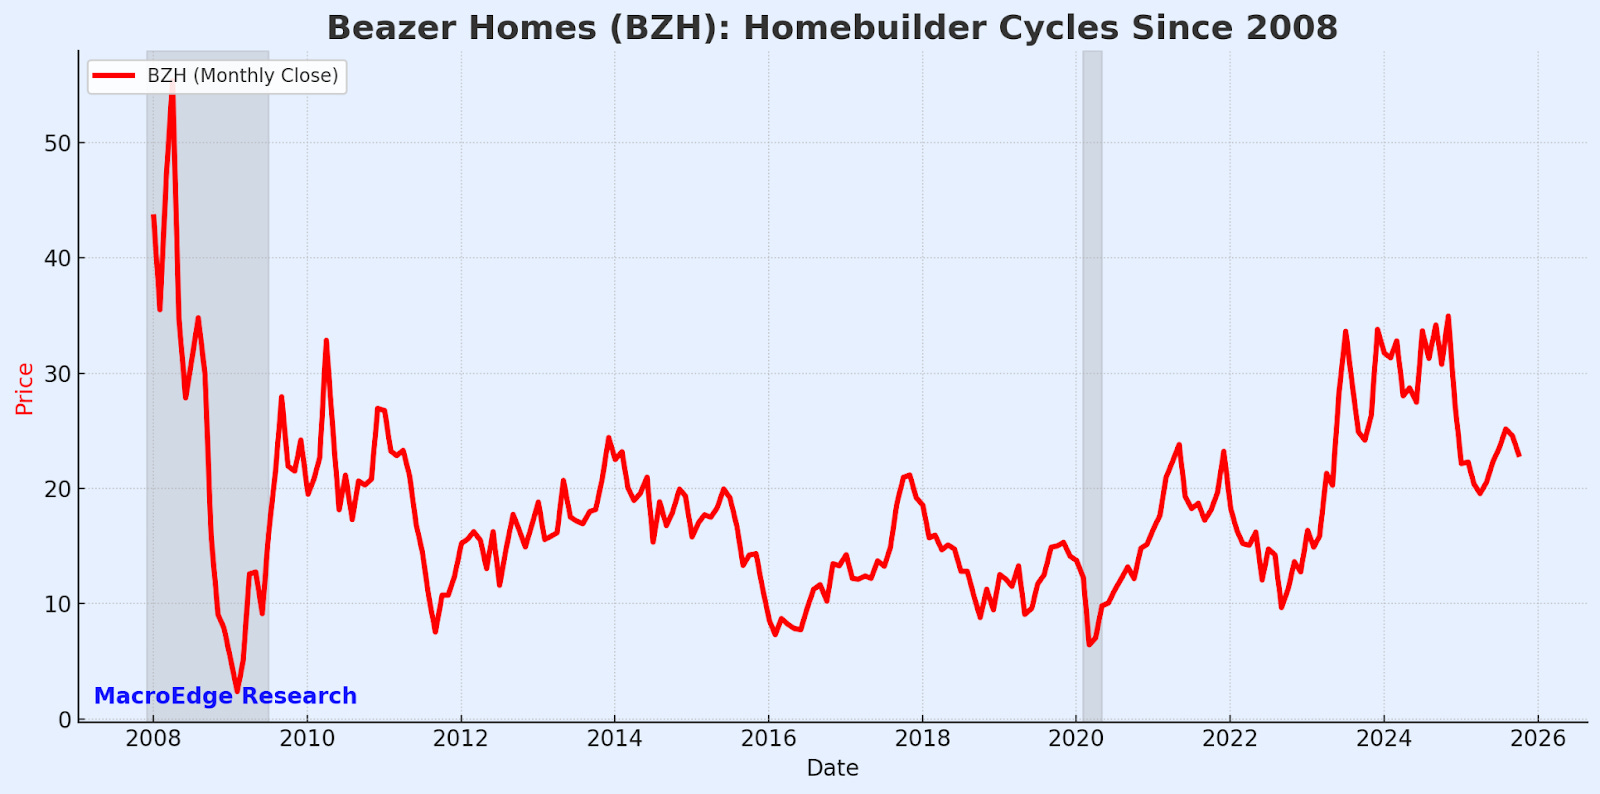
(BZH) below:
(TOL) below:
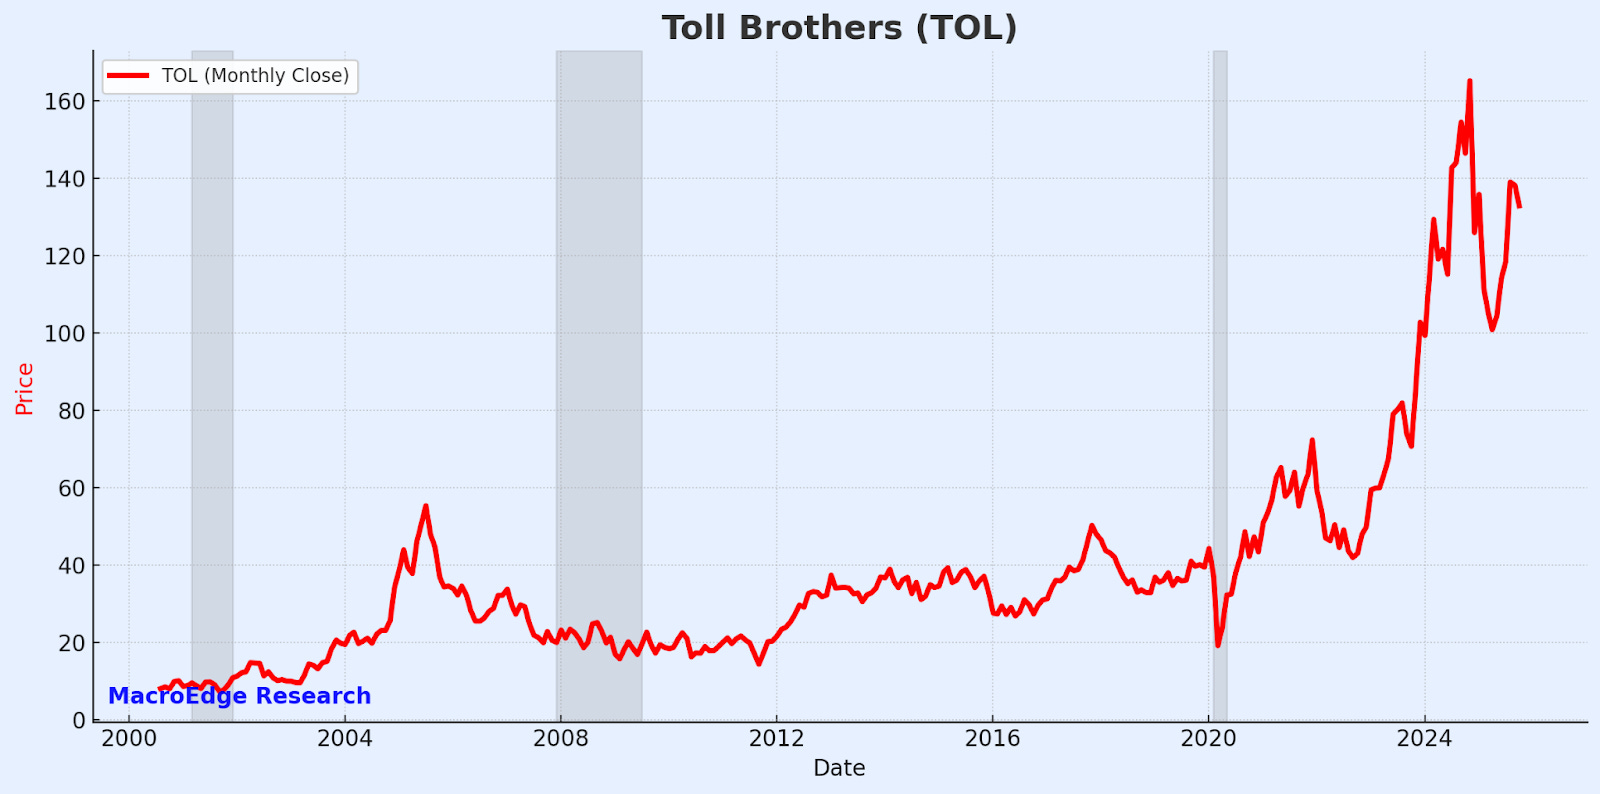
(PMH)
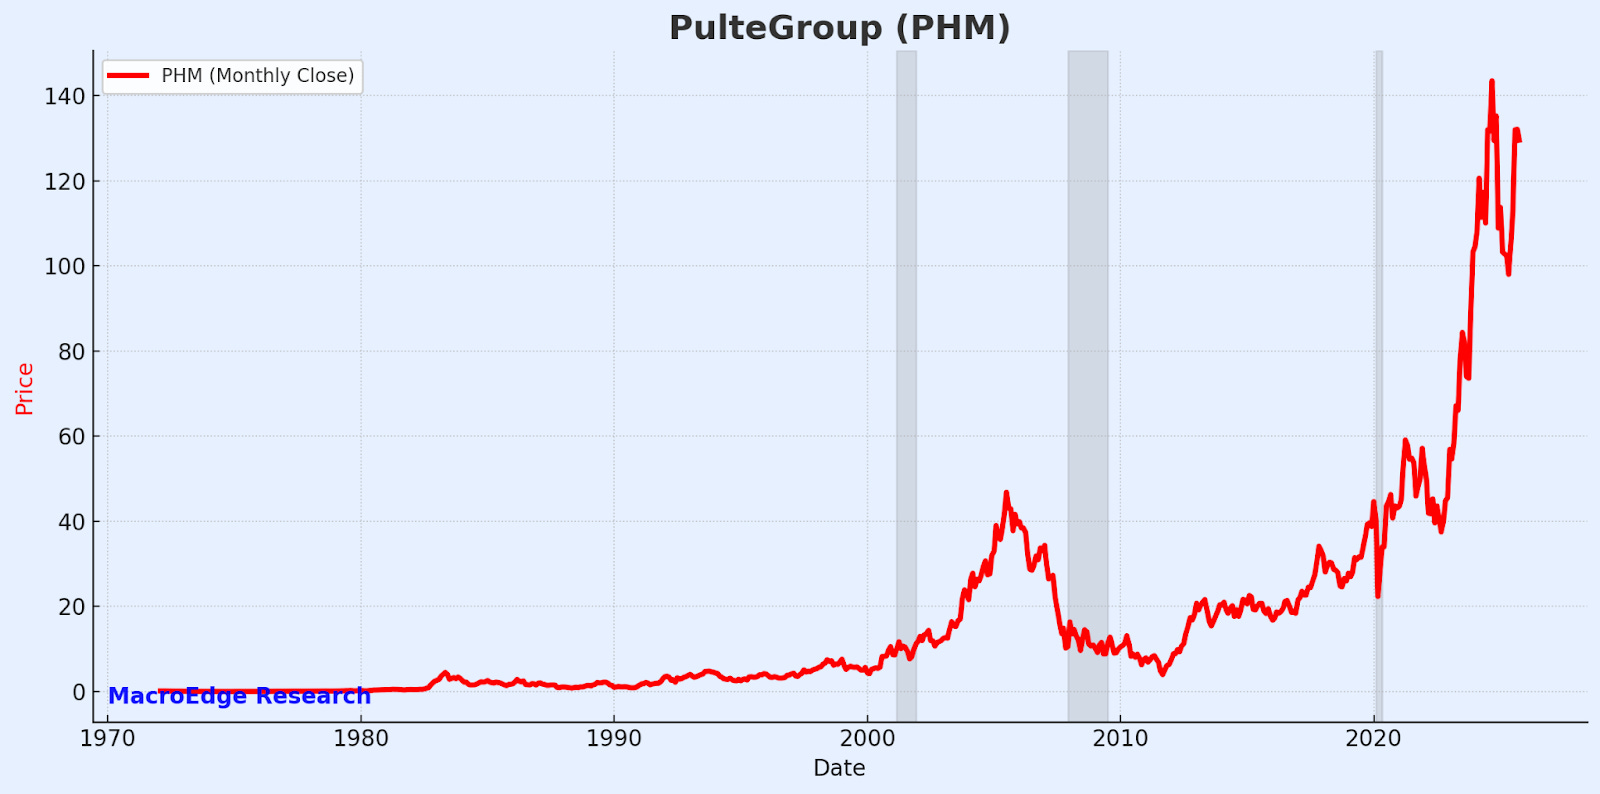
(DHI)
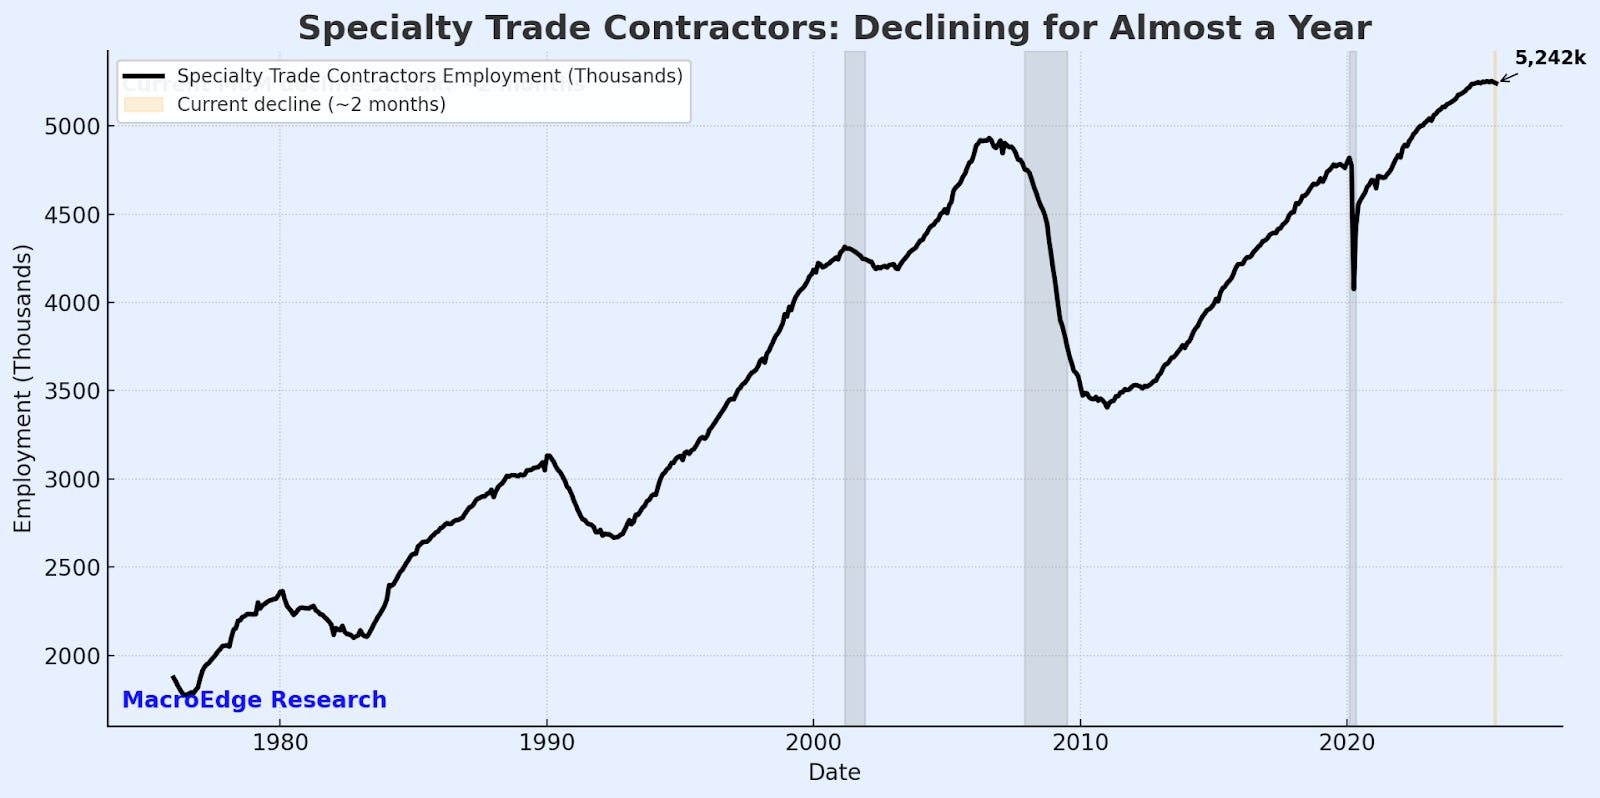
Without the latest employment report for September - it’s hard to guess where employment landed for a single month, but the trend in sector employment was very clear:
Even more so in the sector ‘specialty contracting’...:
Carry Trade Reload & Dollar Death & Debasement
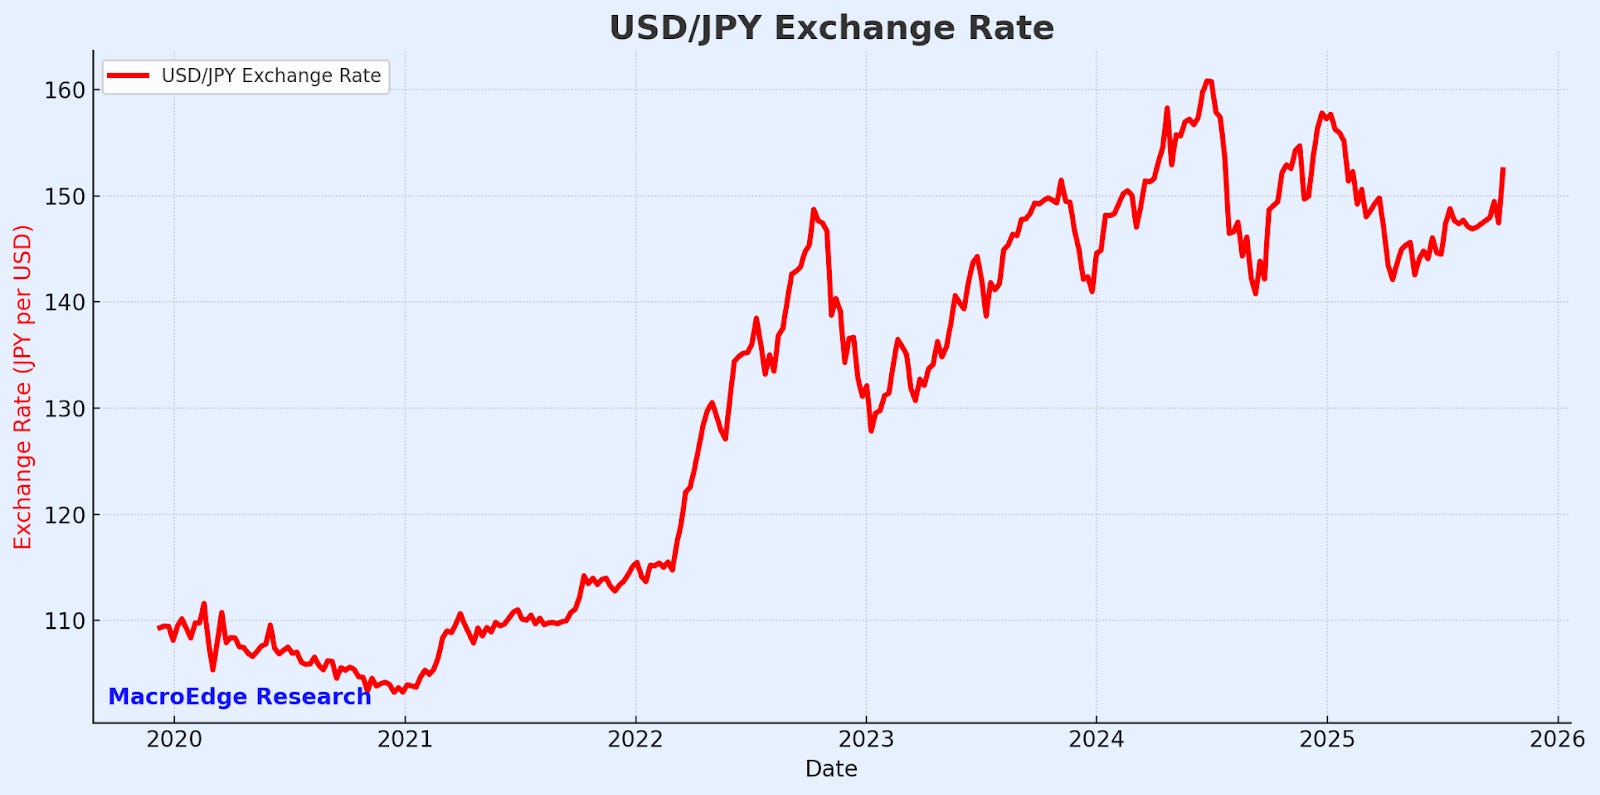
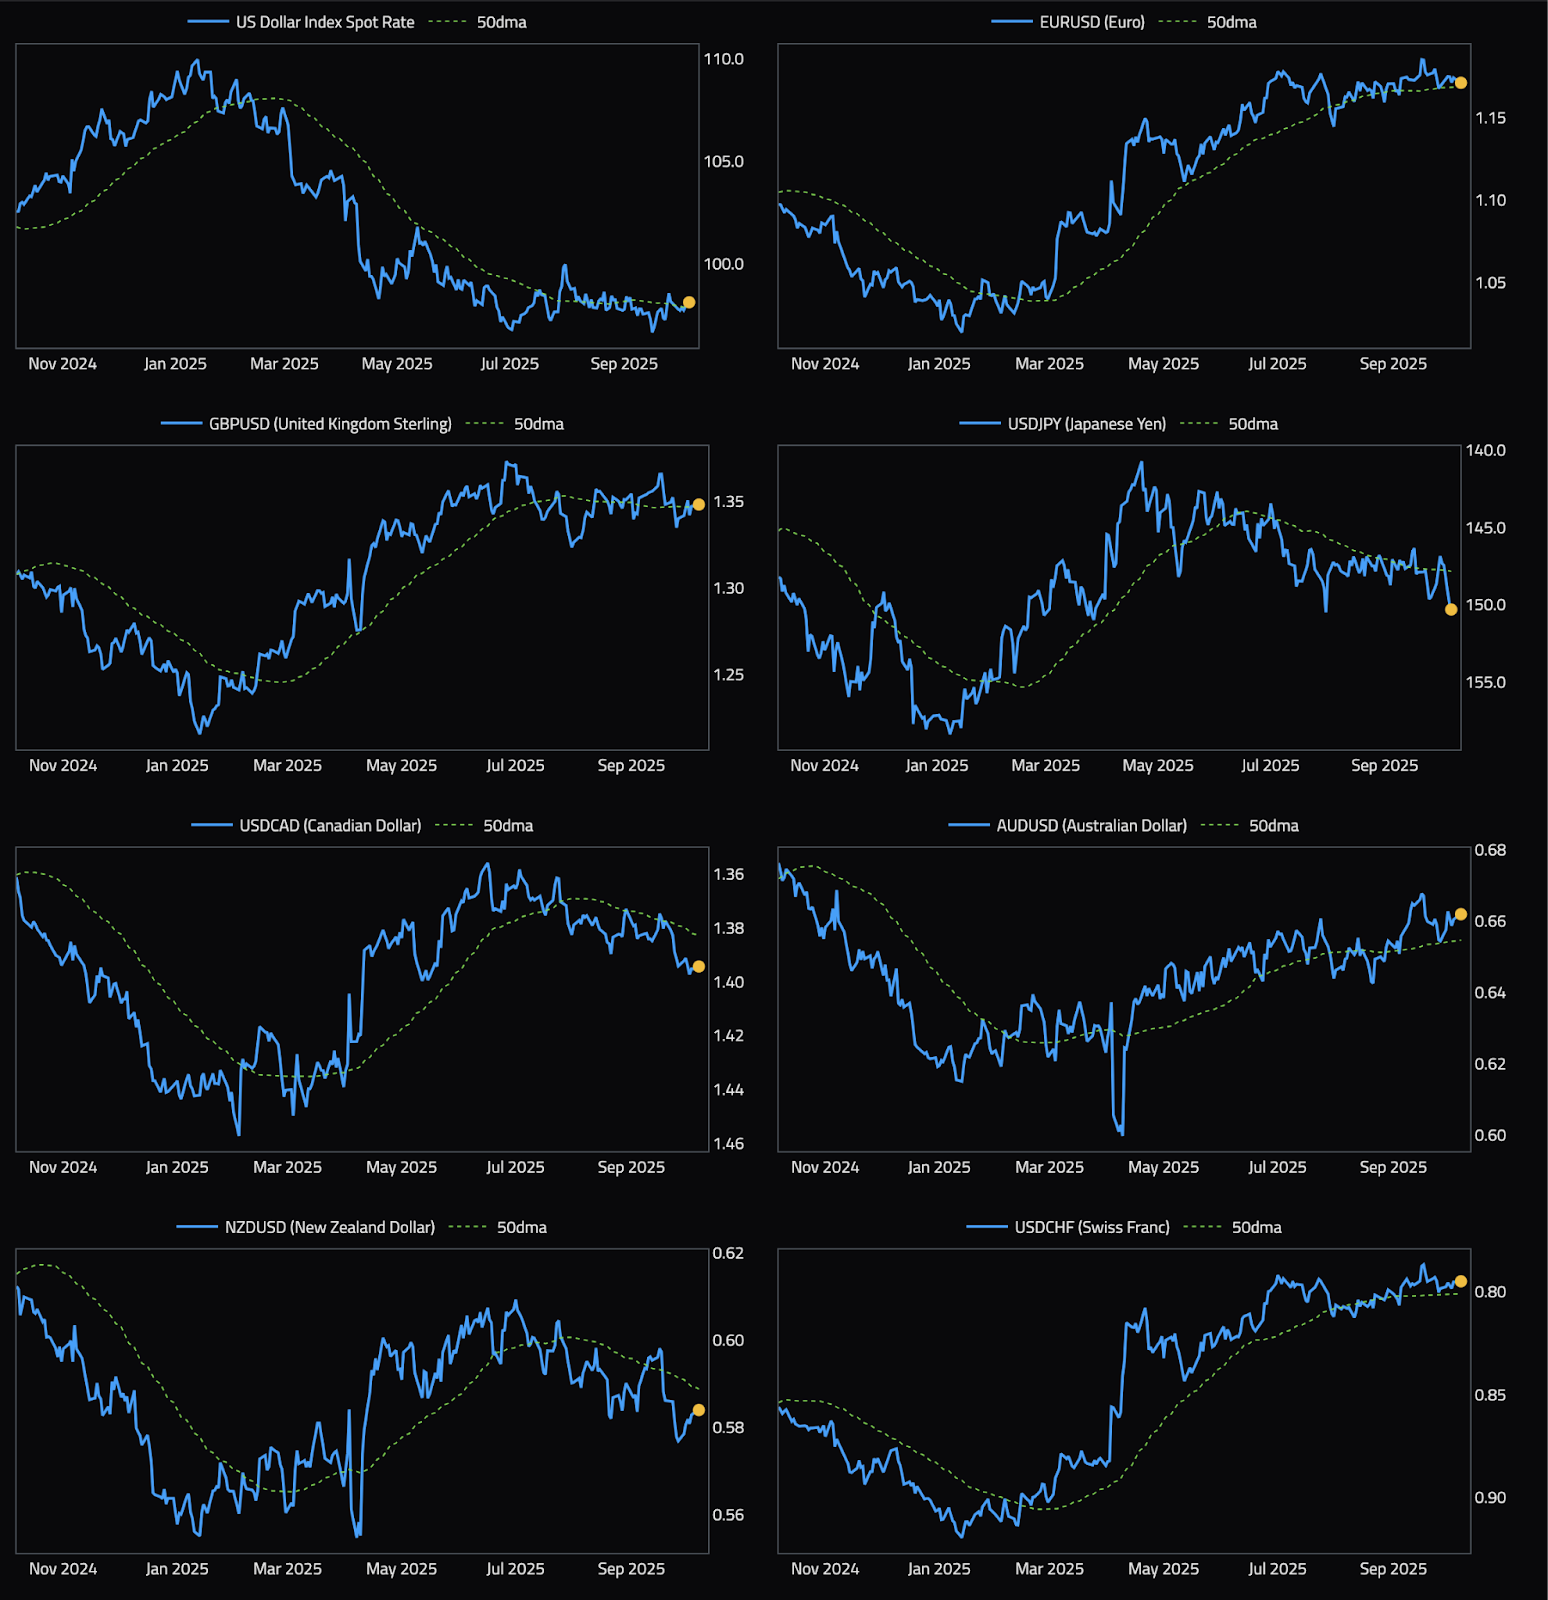
While we’ve covered gold extensively from our inception in 2023 - and reaped many of the benefits of global fiat flails - more context is always needed as to what is driving the move and a deeper view of the global macro lens - there’s been a lot of chatter about the health of the Dollar (especially through the lens of DXY and versus gold) this year - which has highlighted continuing debasement of our domestic currency. Another way that I am viewing this, and have since early September, is that while our situation is severe and needs fixing - let’s compare it to other countries like Japan, which is seeing the Yen carry trade winds back up…
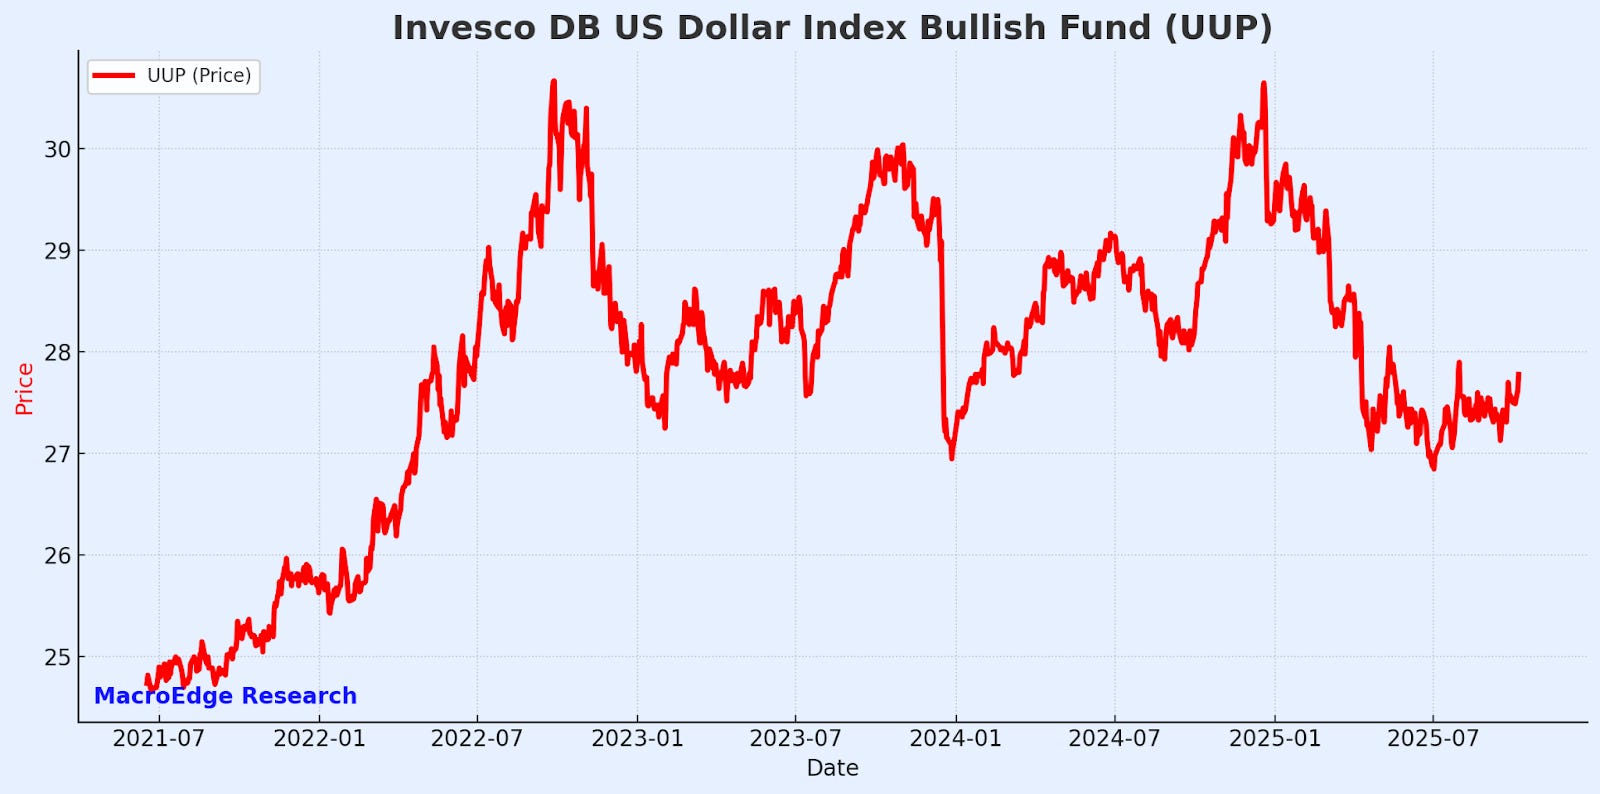
UUP - a long from September Macro Note, and a Don favorite for now:
The dollar itself has major issues, like most fiat currencies, largely due to a political class being unable to unwind explosive and compounding fiscal spending. Going back to the pandemic days (March-April 2020) one of my core beliefs in the fact that the government would never be able to quell its addiction to the new money has largely played out. Today, we’re running pandemic shutdown spending levels, with little indication from policymakers to stop - in part because they are unable to recognize any short-term pain for longer-term societal benefit. This is immediately reflected in more complicated data like demographic data (birth rates and mass migration). Gold has already sniffed this out, and it’s telling us everything we’ve already been talking about for the better part of a year:
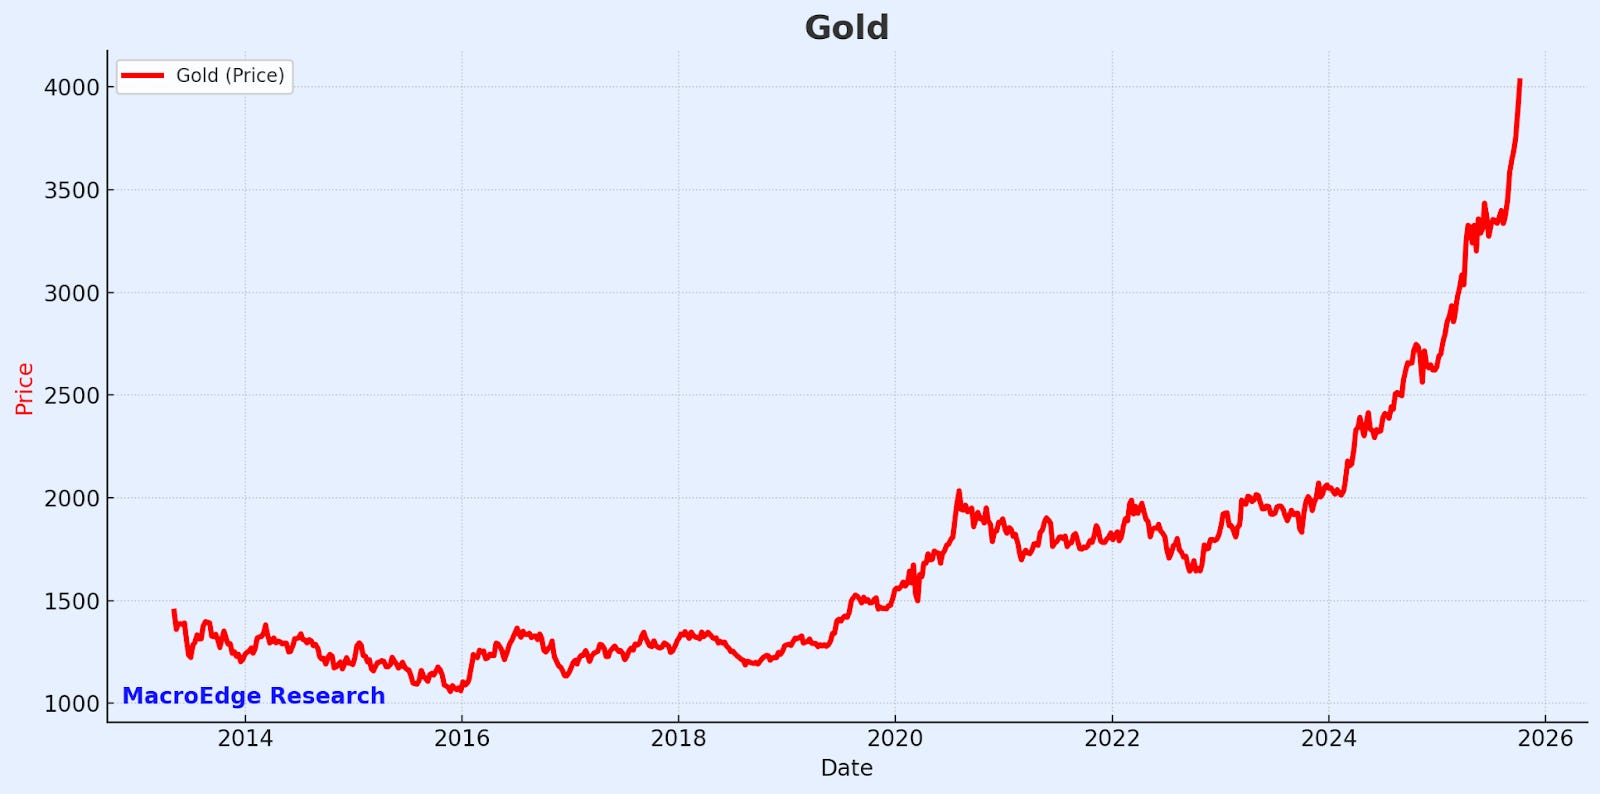
It might look different this time, but history tends to rhyme…
Access MacroEdge Institutional Research below, for four weeks:
View Full Version as PDF

MacroEdge Institutional Research Chart Book - October 2025
The Fossil Frontier - Six Finance (@SixFinance), Head of Research
While the tech sector continues to power to near blistering valuations in a reflexive loop of capex spend, the bottleneck sector and toll taker to creating digital god is energy. The narrative driving the current market euphoria is and has been the transformative potential of artificial intelligence. While I will not take the time to dispute the significance of AI,
The entire thesis here effectively boils down to this: IF AI capex and datacenter buildout meet projections, the energy sector is probably coming along for the ride.
AI-driven hyperscaler capex is enormous and rising; a recent oracle deal sets the precedent for AI buildout to be done with debt instead of free cash flow. Citigroup has raised the forecast for AI infrastructure spending to exceed $2.8 trillion through 2029, versus earlier estimates of $2.3 trillion. If these capex numbers materialize, that AI spend will consume more electricity on an annual basis than New York, Pennsylvania, and Illinois combined.
Natgas producers and midstream companies - especially those that have yet to ink data center deals - are cheap on a relative basis to certain peers and the broader market, providing a reasonable margin of safety with a high degree of upside optionality.
Oil prices sit at the bottom of their trading range, with geopolitical tensions again accelerating.
Oil glut fears provide a compelling entry point into the sector on both a relative basis against a frothy broader market, as well as being a beneficiary of the stated fiscal policy to grow our way out of the federal debt.
We expect that if capex projections do in fact materialize(which is of course a BIG if, but will be taken as given currently), the energy sector will enjoy broader tailwinds than the current dynamics where only select energy firms with announced deals, and the nuclear sector are lifted by demand for excess power.
Natural gas is increasingly seen as the only widely available, scalable, and dispatchable option to meet surging AI data center demand due to grid limitations and the slow pace of renewable deployment.
For 2025 and at least the next several years, natural gas is expected to provide about half(possibly more) of the total power used by AI data centers in the US, closely tracking the broader fossil fuel share globally due to its scalability and grid constraints on electric infrastructure.
While hyperscalers will use renewables for portions of their power demand, they simultaneously require on-demand power for large AI clusters where resiliency and grid stability can be critical. The fastest marginal solution is natural gas. Comstock Resources, a core long in our book, remains attractively levered to higher realized natural gas prices and nearby gas to power opportunities. Producers with direct exposure to U.S. gas markets (CRK, CNX, AR, RRC) are trading in ~6–10x EV/EBITDA zones with FCF yields in the mid single digits, materially cheaper on a relative basis than many of the long-duration tech names funding the capex, and attractive given the high probability demand ramp from hyperscaler projects. Midstream names (WMB) trade at higher multiples reflecting lower cyclicality and longer contracts, but they offer leverage to incremental firm transport and capacity awards. Letters of intent or memorandums of understanding will likely deliver substantial equity appreciation for offtake agreements in data center adjacent gas firms.
We view the natural gas sector as a convex relative trade into a medium-term AI infrastructure cycle. The hyperscalers’ capex commitments (well documented in hyperscaler capex guidance and ongoing data center buildout announcements) create durable incremental electricity demand. Natural gas firms sit at the intersection of that marginal demand. The thesis for this trade is highly levered to the capex cycle. If the AI capex bubble is pierced, this incremental natgas outlook would no longer be as attractive as a long-term position.
The current outlook for crude oil is decidedly bearish, driven by projections of fundamental imbalances between supply and demand. Global oil supply growth, fueled by both OPEC+ unwinding production cuts and record high non-OPEC+ output, is expected to surpass demand. U.S. crude oil production is forecast to reach an all-time high of approximately 13.6 million barrels per day in December 2025. The current outlook for oil prices is embedded in the market’s expectation that oil majors will glut the market. The forward curve tells that story. The story it doesn’t tell is one where the market is already pricing in the largest ever surplus, created intentionally by OPEC, into expansionary global fiscal policy. China, on the other hand, is adding 11 new reserve sites to begin aggressively stockpiling oil for strategic reasons. With the Chinese strategic reserve heavily on the bid, and a less supply-happy OPEC+, oil looks primed, absent a macro shock.
The MacroEdge Institutional Research Portfolio is now very long energy, with longs across oil futures, natural gas, and solar firms.
Euphoria in Corporate Credit - John Insall @JohnInsallME), MacroEdge Research Analyst
Corporate credit spreads in the U.S. remain exceptionally tight by historical standards: high-yield spreads hover around 275 basis points over Treasuries, while investment-grade spreads only warrant approximately 75 basis points.
Default pressures appear muted in public markets but may be obscured by the rise of private credit and alternative financing channels, which many traditional indices (e.g., ICE BofA) fail to capture. This divergence between reported stress and underlying conditions raises the risk that the market is under-pricing tail risk.
In a downside scenario—whether triggered by a real GDP shock, asset-price correction, a sharp retrenchment in corporate capex, or behavioral-driven stress in financials—we believe risk premia has the potential to expand rapidly from current record lows. In our view, the market’s pricing of credit does not yet reflect this possibility.
Spread vs Default Relationship
Historically, credit spreads have served as a leading indicator of default cycles, typically widening well before realized defaults begin to accelerate. Today, however, spreads remain compressed at cycle tights, even as forward-looking measures of default probability trend higher. This divergence suggests the market continues to prioritize near-term carry over long-term risk.
At around 275 basis points, high-yield spreads are offering too little compensation for the underlying credit risk. The effective risk premium is razor-thin and investors have virtually no cushion if default rates rise toward projected levels.
Investment-grade spreads tell a similar story. At just 75 basis points, they’re effectively pricing in a near-flawless macro backdrop, with little allowance for earnings shocks, downgrades, or refinancing risks that begin to build meaningfully in the 2026–27 maturity wall.
The disconnect between spreads and default risk highlights a classic asymmetry in the credit markets: the upside is limited to incremental carry, while the downside could involve a sharp repricing of risk if growth falters, liquidity tightens, or distress surfaces in leveraged sectors.
Default Rates & Credit Stress
Public market default activity remains muted by historical standards and is essentially negligible in investment-grade. On the surface, this suggests a relatively stable credit environment, though we feel the headline figures are masking the underlying fragilities.
We believe credit stress is more visible beneath the surface, particularly across private credit and structured markets. Senior-secured direct lending portfolios have shown rising delinquency and modification activity, indicating that borrowers are increasingly dependent on lender flexibility rather than true balance sheet strength. In the CLO market, collateral quality has drifted lower and spreads on lower-tier tranches have widened, reflecting growing concern over covenant-light exposures originated during the 2020–21 boom. Meanwhile, commercial real estate financing remains under acute pressure, with CMBS delinquency rates climbing—most notably in the office sector—as refinancing at higher coupons tests asset valuations. Collectively, these developments suggest that while public bond markets appear calm, credit deterioration is quietly advancing in the less transparent corners of the financial system.
Another dynamic shaping this cycle is the increasing reliance on distressed exchanges as a means of restructuring. By exchanging old debt for new securities on amended terms, companies can avoid an outright default classification. While this reduces the appearance of stress in published default tallies, it ultimately reflects underlying credit weakness that may resurface in future quarters.
Certain sectors remain disproportionately exposed to credit deterioration. Commercial real estate continues to grapple with refinancing risk, retail faces structural headwinds from shifting consumption patterns, and highly levered small-cap issuers are vulnerable to both higher funding costs and slowing demand. Together, these pockets of fragility suggest that the benign public default statistics may understate the true degree of stress building across the credit landscape.
Macro & Fundamental Drivers
Rates & Policy - Elevated Treasury yields and the continuation of quantitative tightening (QT) are constraining overall market liquidity, even as investors remain eager to capture incremental yield. The higher-for-longer policy backdrop has reduced the margin of safety in credit markets, with spreads staying tight despite rising refinancing costs.
Corporate Balance Sheets - Many corporates were able to term out debt during 2020–21 at historically low rates, which has helped cushion near-term rollover risk. However, we believe aggregate leverage remains elevated relative to pre-COVID cycles and has left weaker issuers more vulnerable as maturities begin to cluster again in 2026–27. This maturity wall could become a catalyst for higher defaults if financing conditions deteriorate even modestly.
Market Technicals - We show sympathy toward the view that credit spreads remain compressed in large part due to technical demand factors rather than improving fundamentals. Persistent inflows into credit ETFs, robust CLO issuance, and limited net supply of new corporate bonds have created a technical bid that suppresses spreads. These dynamics have allowed investors to continue reaching for carry, even in the face of growing credit risk.
Tail Risks - The balance of risks remains asymmetric. A slowdown in earnings growth, the onset of fiscal drag, or a policy misstep could quickly reprice credit markets. Given the thin cushion currently embedded in spreads, any deterioration in macro conditions could prompt an outsized widening in risk premia relative to the incremental carry investors are earning today.
The Consumer
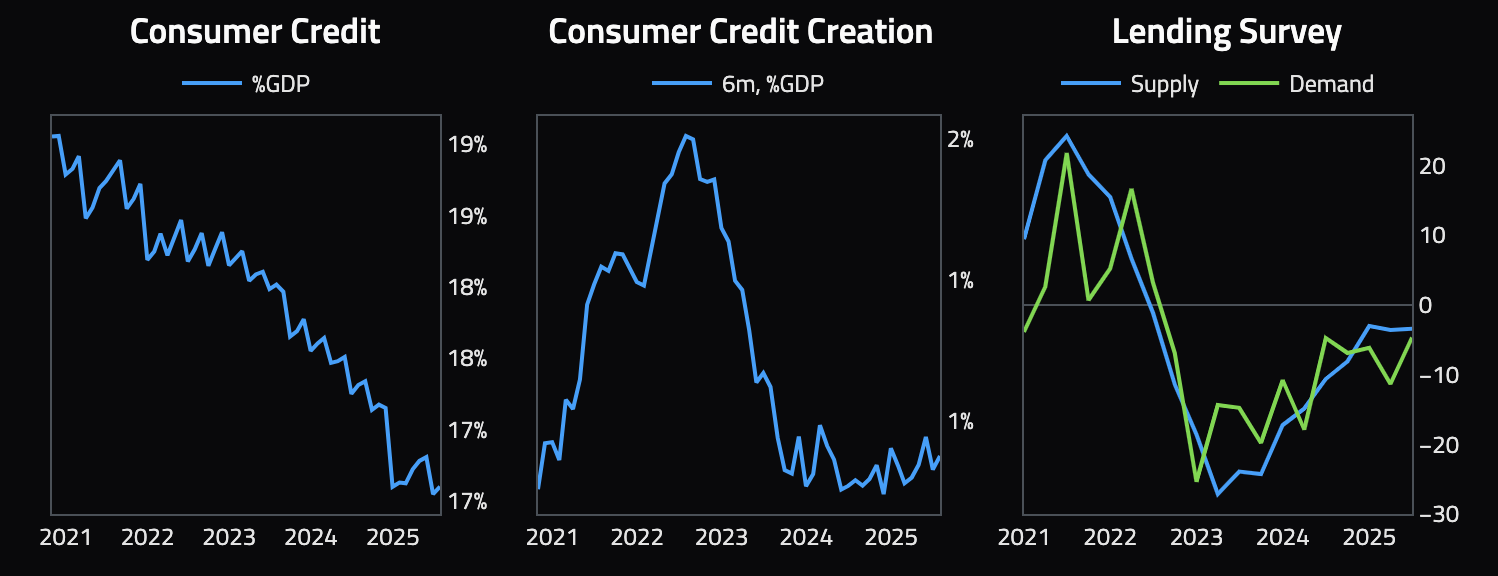
Household Leverage - Household balance sheets are beginning to show clear signs of stress. Credit card and auto loan delinquencies have been rising, particularly among subprime borrowers, reflecting the squeeze from higher interest rates and persistent cost-of-living pressures. Elevated borrowing costs have left many households more reliant on credit to maintain spending, increasing the fragility of consumers’ balance sheets.
Transmission to Credit - Consumer stress has direct implications for the corporate sector. As households pull back, weaker demand erodes revenue growth, compresses margins, and ultimately reduces the ability of corporations—especially those in consumer-facing industries—to service their debt obligations. Retail, auto manufacturing, and discretionary goods are on the front line, but a sustained downturn in consumer activity can ripple into broader credit markets.
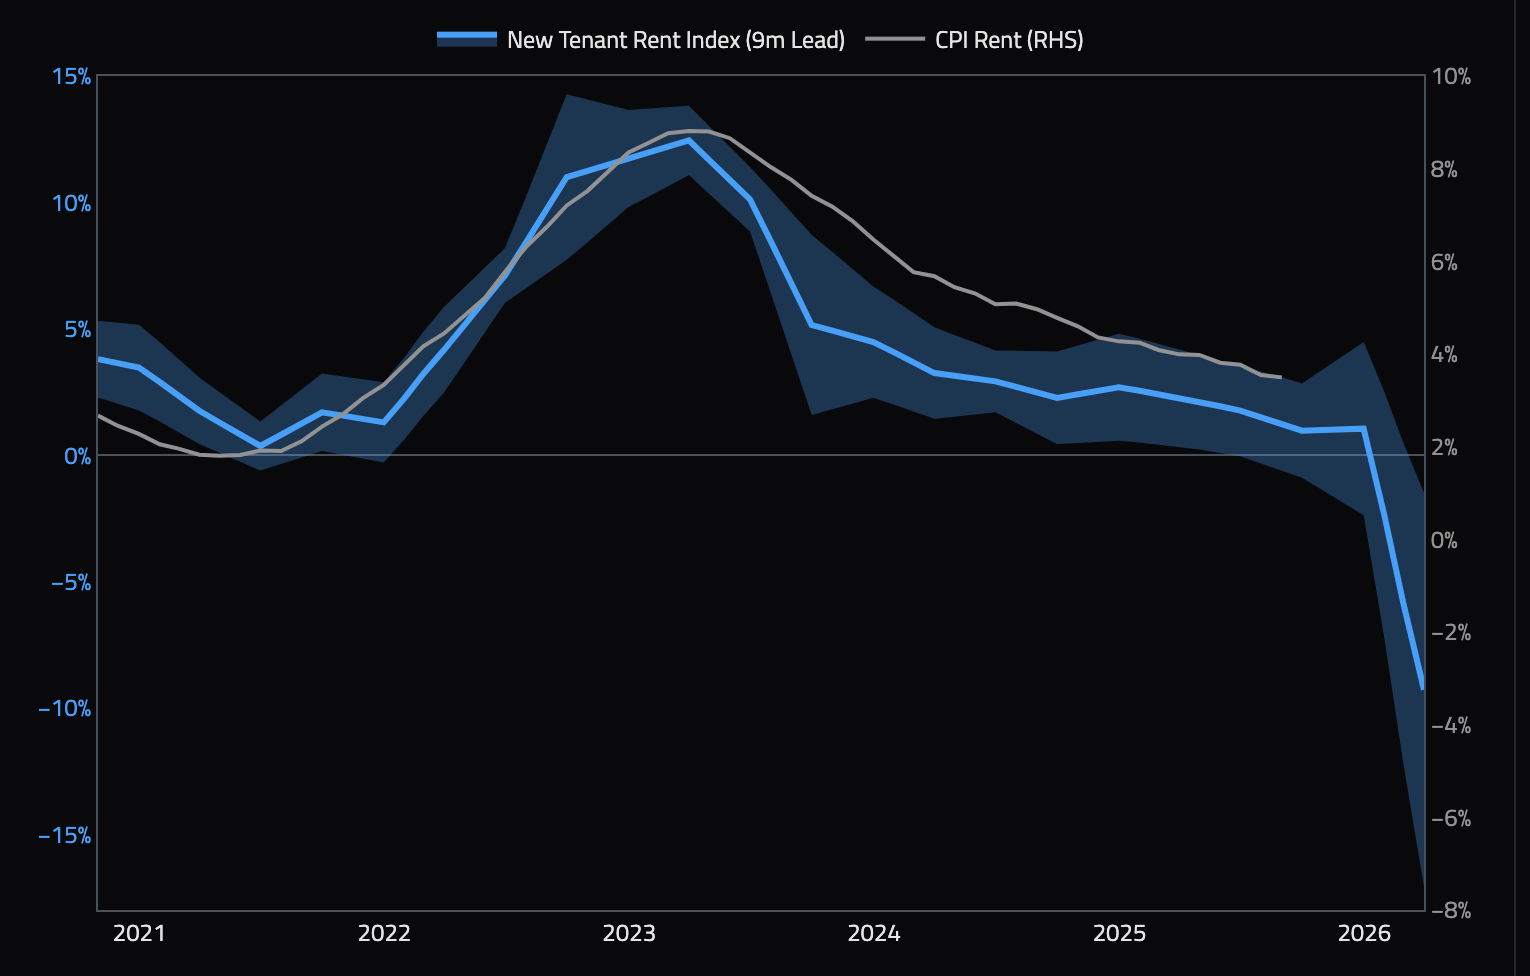
Narrative Gap - There is a growing disconnect between labor market headlines and consumer credit reality. While the fictional employment data continues to paint a picture of resilience and strength, the steady climb in delinquency rates suggests that the foundation of household credit health is more fragile than commonly assumed. This narrative gap risks encouraging complacency in credit markets at precisely the moment when consumer strain may begin to spill over into corporate credit risk.

For more details, please refer to our Terms and Conditions.