
MacroEdge Redeye: Why It's Not Like 95
In this Friday evening 'Redeye' we explore the key differences from this interest rate tightening cycle and the commonly cited 1995 soft landing cycle - focusing particularly labor and real estate.

Happy Friday evening all,
I hope you are having a great night with family, friends, or just relaxing before the 4th of July holiday week next week. I am gearing up for a month of travel and flying myself (get those hours up as they say). Secondly, welcome to the second half of the year - can you believe it’s almost July? Where does the time go.
Stay tuned for our update tomorrow evening for the release announcement for MacroEdge Global - our new line of data coverage for Europe, Canada, and Oceania - this will add an important arsenal of data to our wide variety of data already being covered and a new report series will be rolled out to match. More details will be released tomorrow on the date of release, signup details, existing members and more on the access side of things. We’re also finishing up work on MacroEdge Vision to provide tracking and coverage of the work that Six and the Vision Equity Research Desk are doing and the next data dashboard update with many of the final May and June datapoints will be available on Sunday. We will also highlight our 2025 Vision Roadmap as we expand upon the incredible progress and growth we experienced in the first half of this year and how we will continue to improve and grow in the next two quarters and beyond. If you haven’t experienced the existing MacroEdge Research data and research landscape, you can access it for two weeks at:
While there has been a lot of focus on the ‘1995 Soft Landing Cycle’ in which the Federal Reserve raised the Fed Funds Rate from to 300 to 550bps, there are plenty of coincidental data points being thrown around for why this cycle is just like that one (I do not agree with this assessment). Stock market gains are the primary focus and argument made - and a compelling one - but our focus continues to be around the risks that arise when the Federal Reserve begins to lower its policy rate. We have continued risks for small and mid-sized banks on the commercial real estate size of things, as the team discussed this evening on MacroEdge Radio #13 - a weakening labor market (which was not seen in 1995), no inverted yield curves pointing to restrictive policy on the short-end, and differences in the manufacturing data that continue to lead us to believe this cycle is much more like 91/01/07 than 1995 - even though the cycle has been slow and drawn out due to record pandemic stimulus and labor market distortions created when the economy was shut down and then juiced back beyond maximum employment. We’ll break these four key comparisons down visually and discuss each one in short form, because the visuals really do the talking when it comes to comparing & contrasting why much of the data we have now on the current cycle is not like 1995.
Have we achieved a world without business cycles? We don’t think so.

Employment Data
On the employment side of things - the current cycle looks nothing like 1995. The 1995 tightening cycle was performed in an environment lacking maxmimum employment - rather it was coming off of a period of high employment just 3 years prior due to the 1991-92 global recession. This meant there was plenty of slack in the labor market to tighten into, and the labor market continued to expand until it hit turbulence 5 years later in 2000:
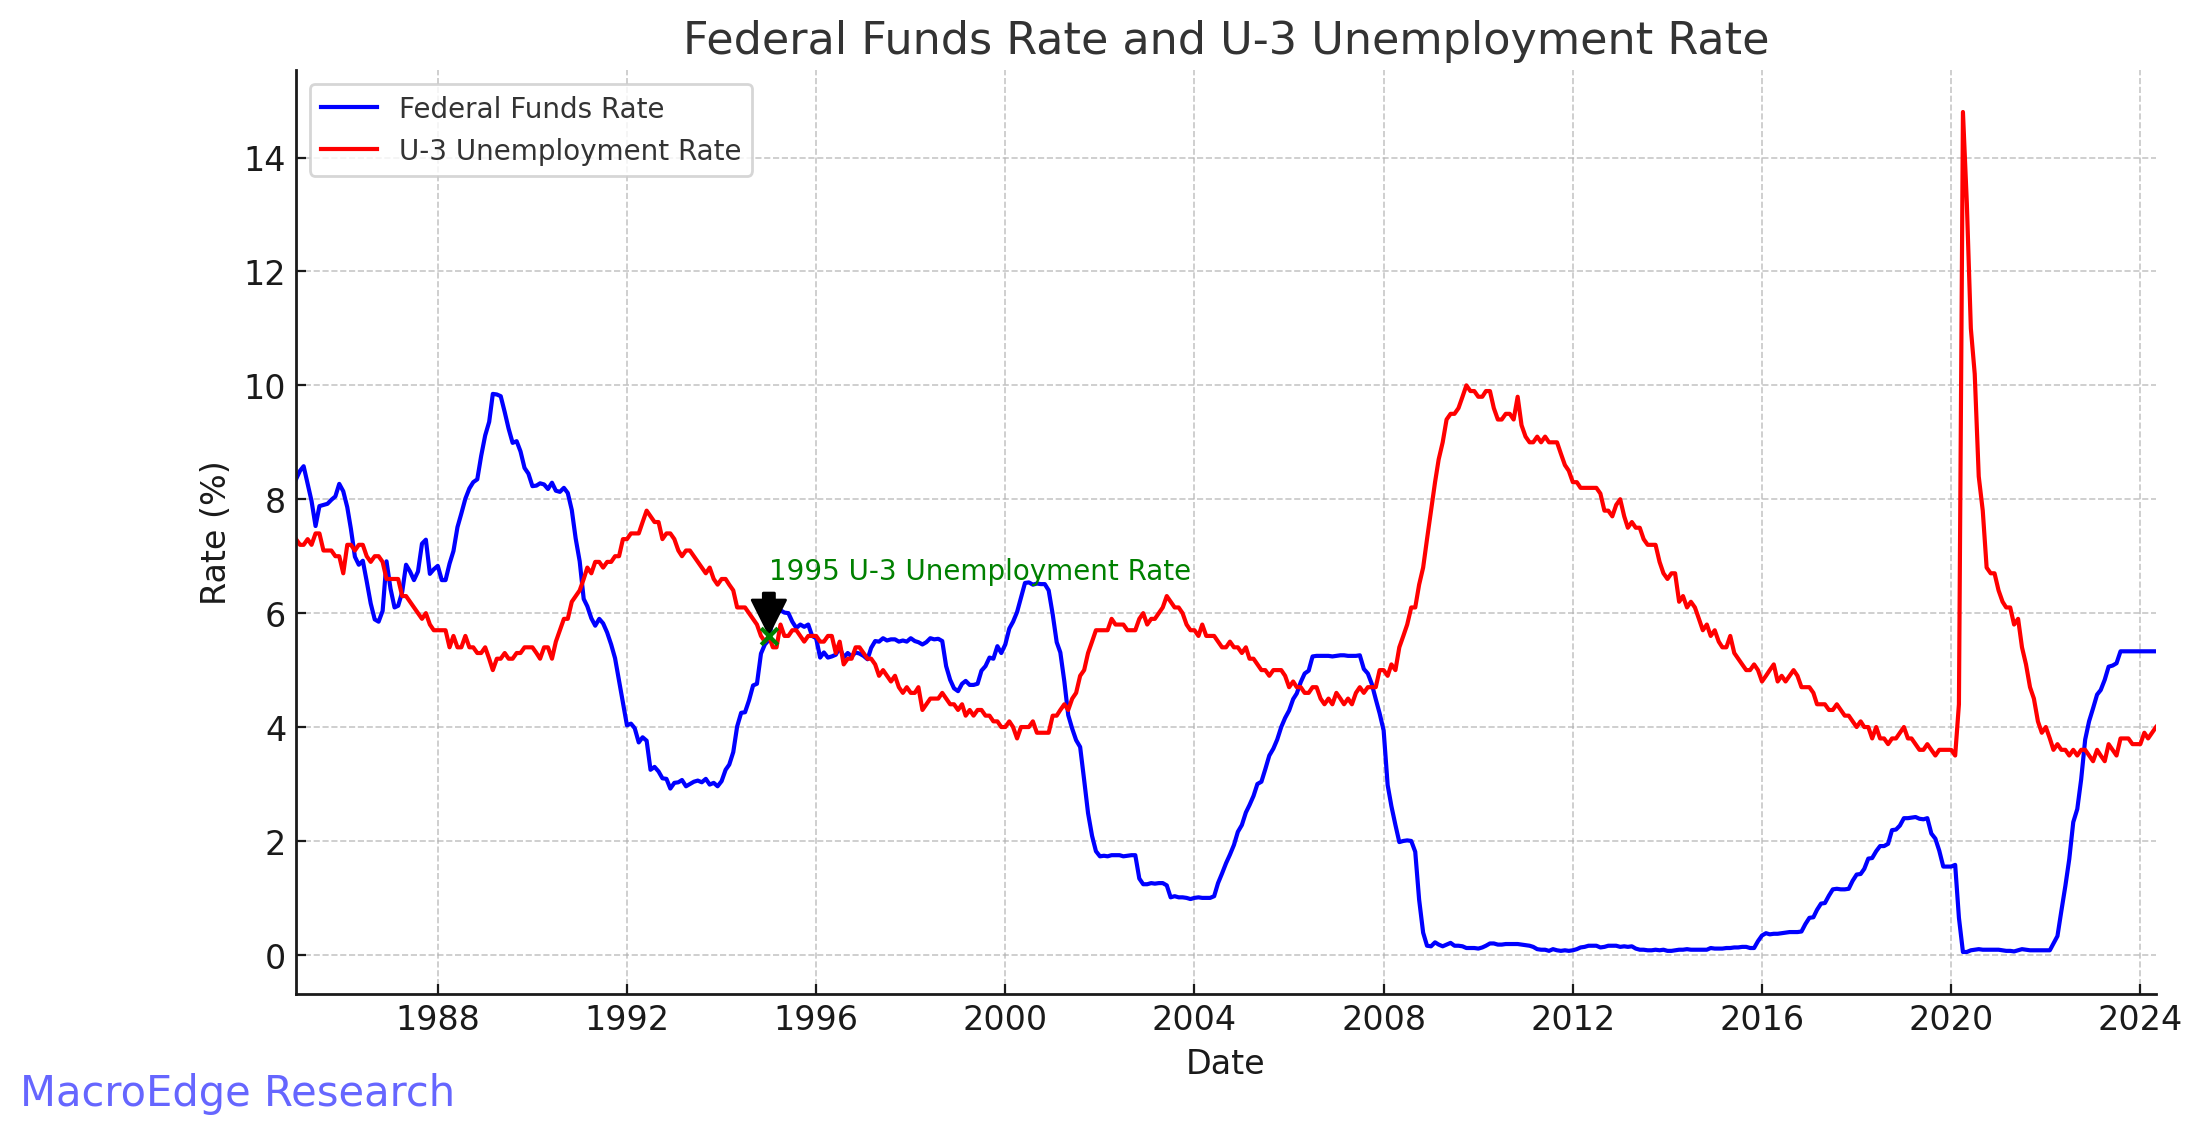
(Above) In the current cycle, unemployment has increased to 4%, historically low in the dataseries but unemployment generally starts low prior to labor market rollovers (see every cycle since 1969 excluding 1981). The current cycle and the immense lag in the labor data looks most similar to the 1989 and 2006 cycles as seen below in our unemployment rate index. Unemployment tends to increase from anywhere to 12-36 months following the first rate cut and you can view each tightening cycle (including soft landings) on MacroEdge.net/data
On the subject of continuing and initial claims - we just hit a new cycle high for continuing claims this week, and initial claims have started a slow trickle higher. These are really indicators to pay closer attention to when the Fed begins to lower rates - which is likely to occur around September if the labor market continues to gradually weaken.
The unemployment rate print from June will give us even more clarity on the direction of the labor market going into the second half of the year:

As the unemployment increase materalizes - the odds of a labor market ‘snap’ where unemployment begins to increase more sharply grow - paritcularly as the Fed remains in the 525-550bps range.
Inverted Yield Curves
Inverted yield cuves of the 10-year/2-year and 10-year/3-month spreads in 1995 as the Fed tightened? Nope:
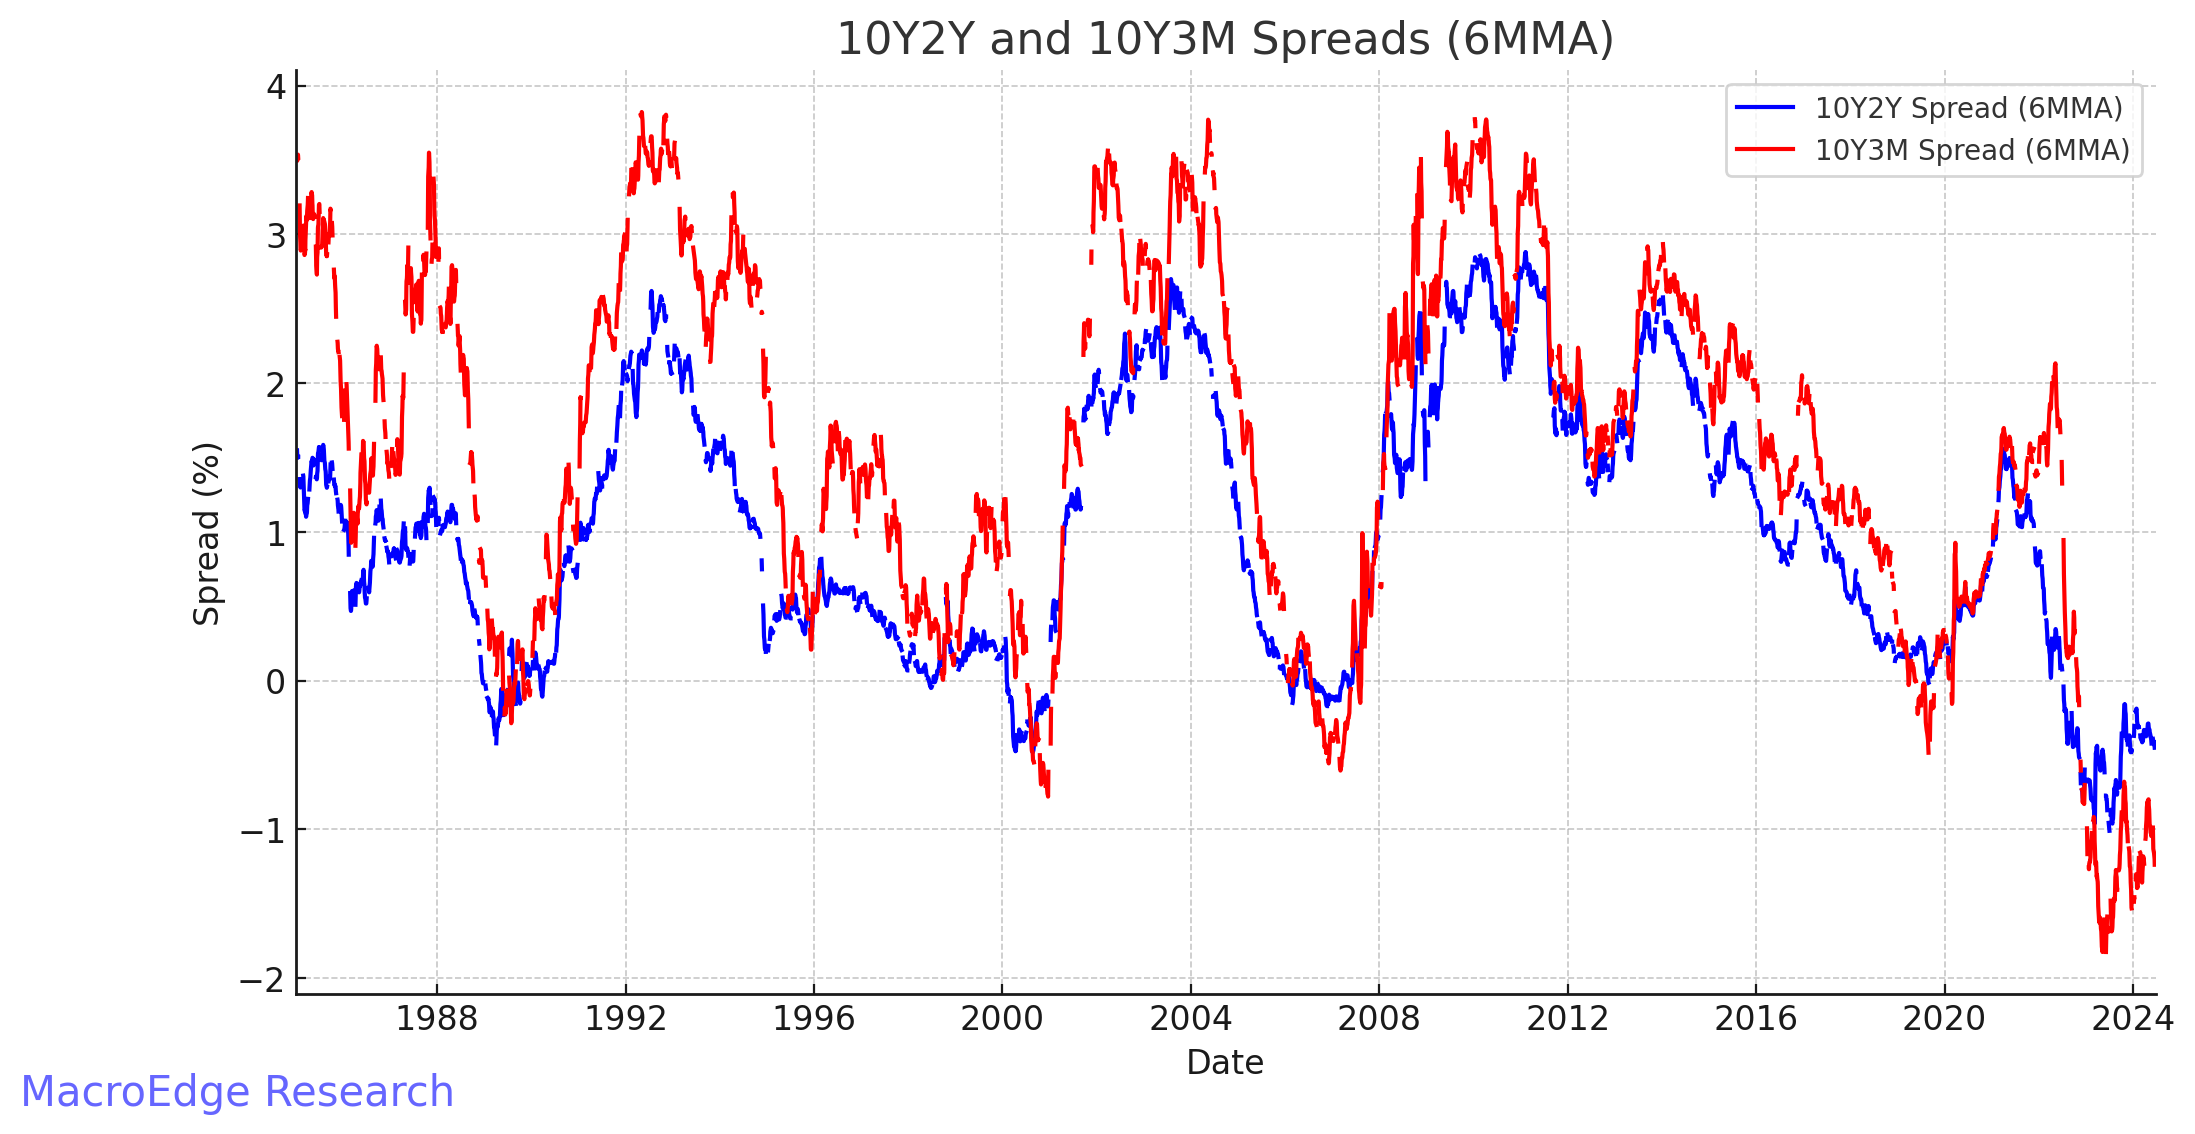
The 10Y2Y curve may be ready for a move higher towards ‘uninversion’ above zero and the 10Y3M spread tends to follow closely along. The key difference here is the accuracy of the indicators - with the 10Y3M spread being the more accurate of the two in terms of serving as an early warning signal for every past cycle of labor market (and economic) troubles ahead. It appears that uninversion will take place when either the market forces the Fed to take policy action, or the Fed provides a clearer timeline on policy (which they are not doing during the ‘summer of policy errors’.
I am of the belief we’re now in a period of holding too high for too long (even with loose financial conditions) and spreads will begin to widen post cuts, rather than prior to.
Real Estate Data
On the real estate front - 1995 was a recovery time for the real estate market, rather than a major peak as this hiking cycle represents.
Under Construction (Total Housing Units: UNDCONTSA) is pointing towards major headwinds the real estate industry ahead - and the real estate cycle really is the business cycle:

Multi-family permits (PERMIT5) and Housing Starts (HOUST1F) also highlight the rollover being seen in the headline total construction figure (THU). Real estate cycles tend to be long and drawn out - and remember that all cycles can vary dramatically in terms of impact, but the key takeaway here will be the impact on employment because we have yet to see construction play a major role in our current rising unemployment. Another 6 months of contraction in total units under construction, and we’ll probably be singing a different tune.
Manufacturing Data
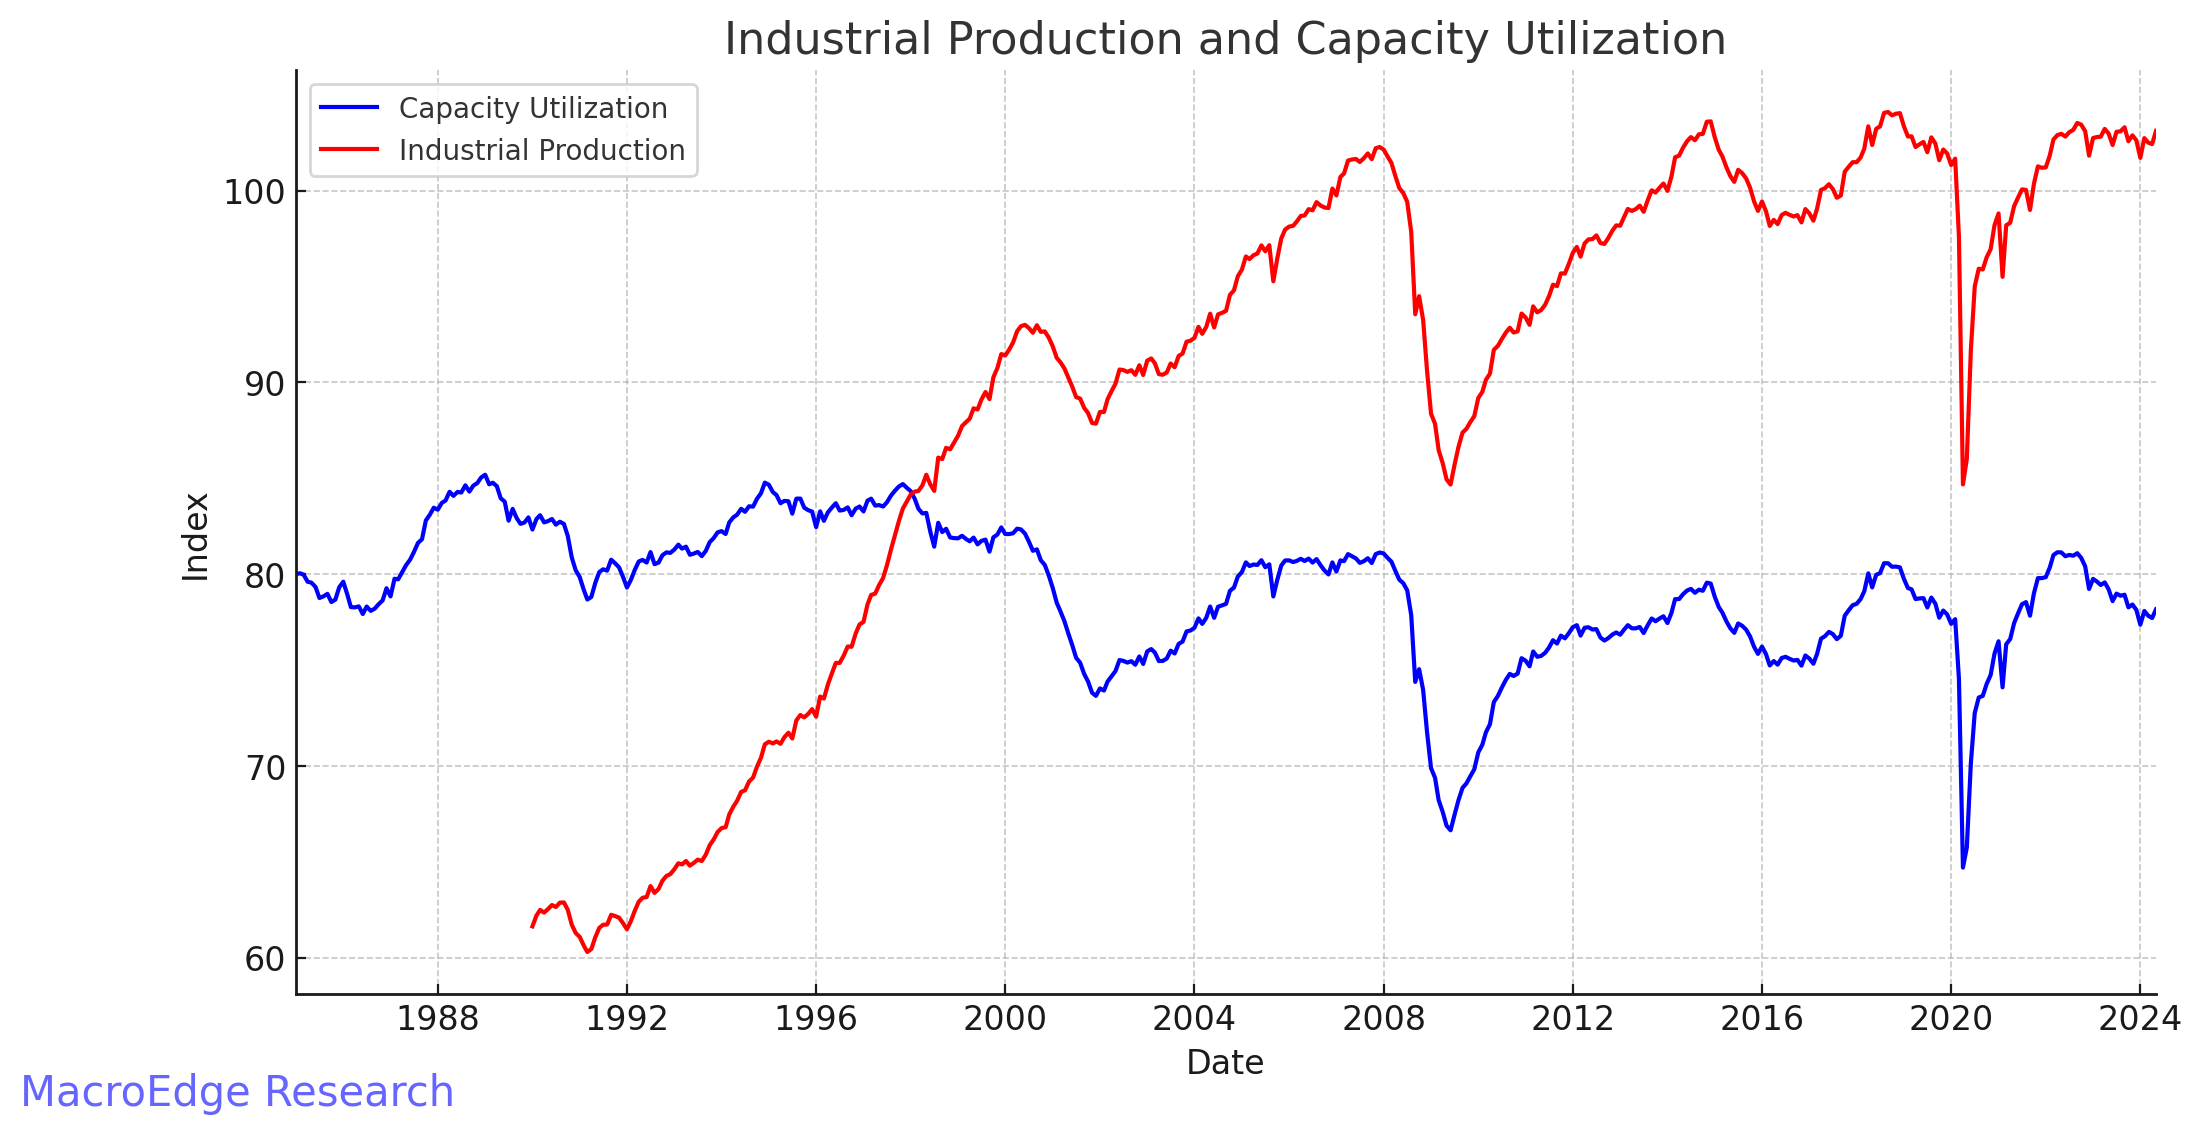
Manufacturing data in 1995 was strengthening rapidly - Industrial Production for this cycle peaked back in 2022, along with Capacity Utilization. The 90s saw large growth in INDPRO (industrial production) while we’ve seen virtually none since 2007 now.
Summary: Awaiting Cuts
While much of the talk in the media (social, TV, and elsewhere) will be on the election this year - it’s likely that whoever wins will face significant headwinds as they take office. Our core concern continues to be a weakening labor market and central bank policy error, and the odds of significantly higher unemployment are rising in many developed nations as labor markets buckle under restrictive policy. The story of economic nirvana will likely persist until the Fed breaks something (namely the labor market) - which is the best way to get inflation lower. This of course means record optimism and speculation in the stock market may continue unabated - although the labor market red flags may been taken into account without much notice if things weaken through the next earnings season, beginning next month.
See you Sunday evening for the next weekly report, and if you haven’t joined MacroEdge Research yet as a member - make sure and do so:
Hopefully this was very helpful and have a great evening.
Don and MacroEdge Team