
MacroEdge Mid-Week Market Notes: Real Estate Weakness Broadens and State Level Unemployment Signals Turbulence
A mid-week market note for our community covering real estate weakness, rising unemployment, and a look into the state level employment data from the BLS.

Happy Wednesday humpday evening MacroEdge community,
We’ll keep this mid-week update pretty brief but discuss two key areas of the broader weakening macro landscape: construction (particularly residential) - and its lag this cycle, along with some of the state-level employment data from the May BLS state-level employment data report. Overall, the holistic picture continues to cool and monetary policy lags are continuing to take unprecedented time this cycle amid out-of-control fiscal recklessness and the stimulus we saw going into monetary tightening back in 2022.
Stay tuned on Saturday for an update on Phase 2 of MacroEdge Vision - where will provide an update on the new things being released in July as well as what’s to come over the next 18 months. It sounds like a long time for us all but time is sure flying! If you haven’t yet joined us, make sure to do so at:
or try MacroEdge Research for two weeks at: MacroEdge.net/TwoWeeks
While the market continues to price in perfection and rate cuts have been delayed globally with inflation rearing its head again, it’s likely that the Fed will continue to wait for employment to break before taking policy action. Historically, as reiterated in the past, the largest increases in unemployment and claims tend to arrive after rate cuts with a lag. We continue to wait for further data as the steepener remains a far out feat still with the 10y3m curve still under -100bps (-106bps at the time of this writing). Equities are the flight to safety now for the rest of the world and optimism will likely remain until the Fed acknowledges larger problems with the labor market (or inflation reappears).
Real Estate Slowdown Materializing (Finally)
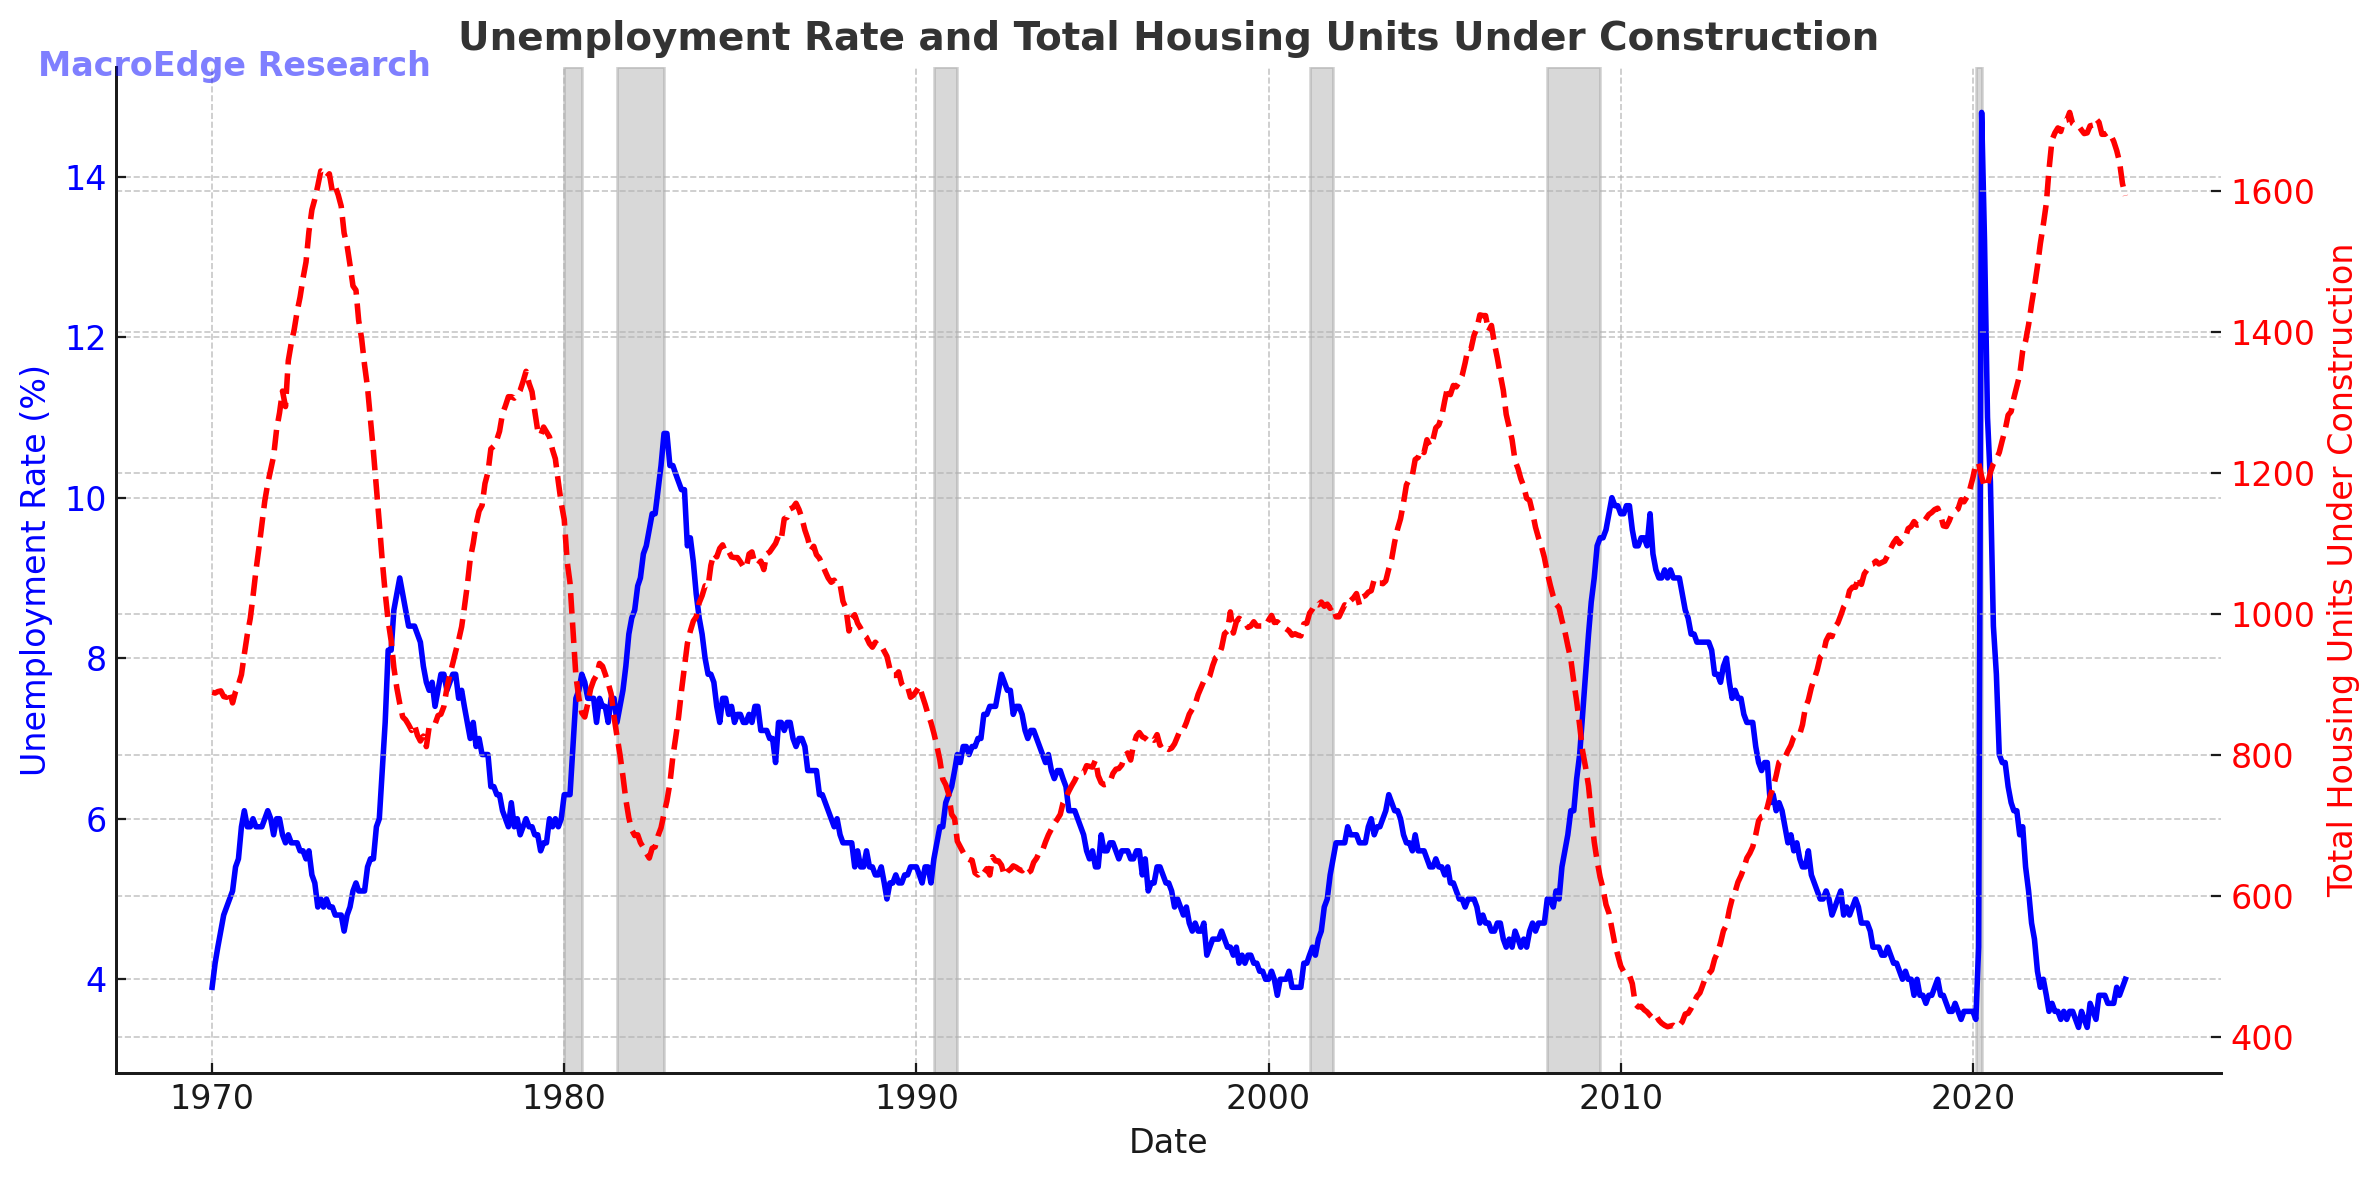
In the real estate sector of the economy (particularly on the rez side) - we are starting to see weakness in the data. Starts, the NAHB Index, AIA Billings Index, total active units under construction, permits, and more are all weakening.
What we are waiting for is now construction employment - particularly residential and active builds to fall further.
Total Housing Units Under Construction v Unemployment Rate:
AIA Billing Index for May:

Labor Market Overview
Job Cuts
States with Cooling Labor Markets
Job cuts, as tracked by the MacroEdge Job Cuts Tracker, have slowed this month - as expected in summer season that is out of public companies reporting earnings and in more of a ‘lull’. We are sitting at just over 60,000 job cuts month to date - with many of these being smaller to mid-sized business and WARN notices from around the country.
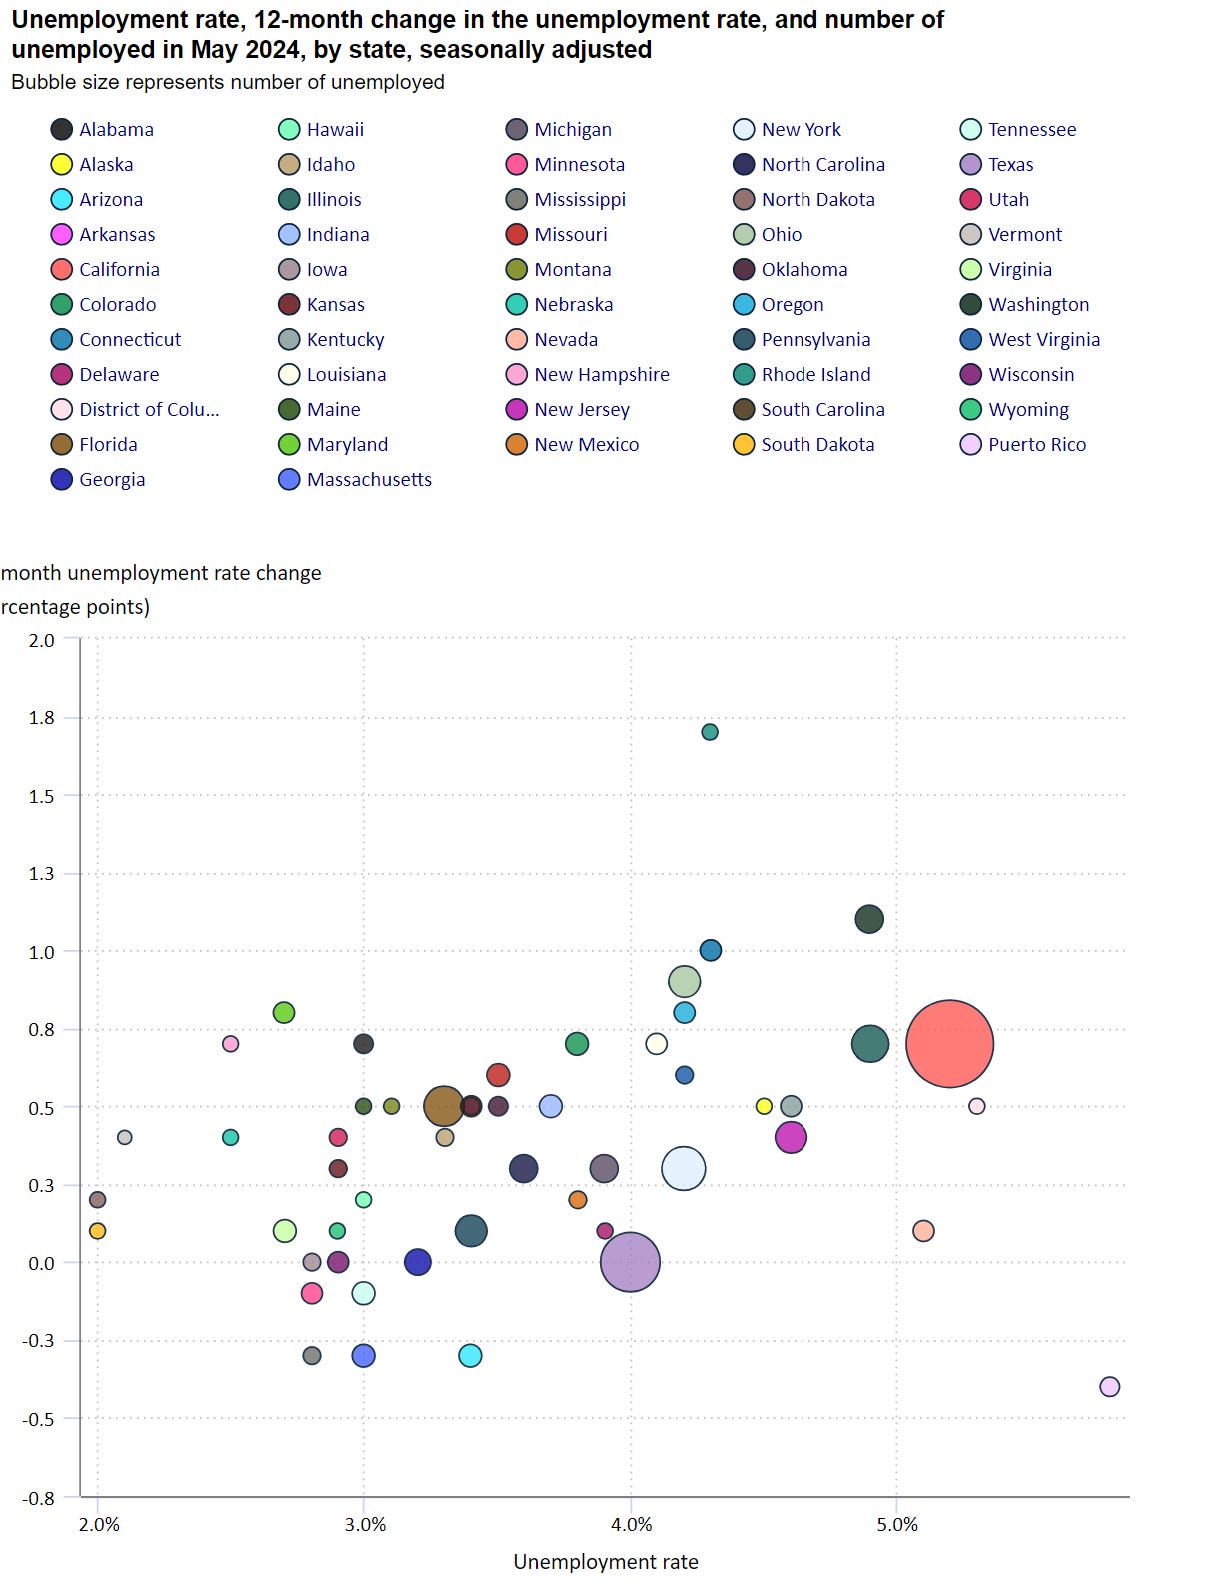
Overall, the state employment picture remains complex but highlights a broader weakening in the labor market with 30 states in a labor market downturn - per our latest State Unemployment Radar update. Some states like California, New Jersey, and New York have now seen their unemployment rates actually dip a bit off the highs, but some similarity in the data may be forming to the early 80s on this front where we saw unemployment dip through seasonally lower job cuts and layoffs and then accelerate into winter. The more job cuts and layoffs there are in an environment with job openings closing quickly, the better a scenario for a higher unemployment rate becomes - even with many states paying such little $ in unemployment.
40 states have seen year-over-year increases in their unemployment rate (per the BLS data release) and indicated below in the visual:
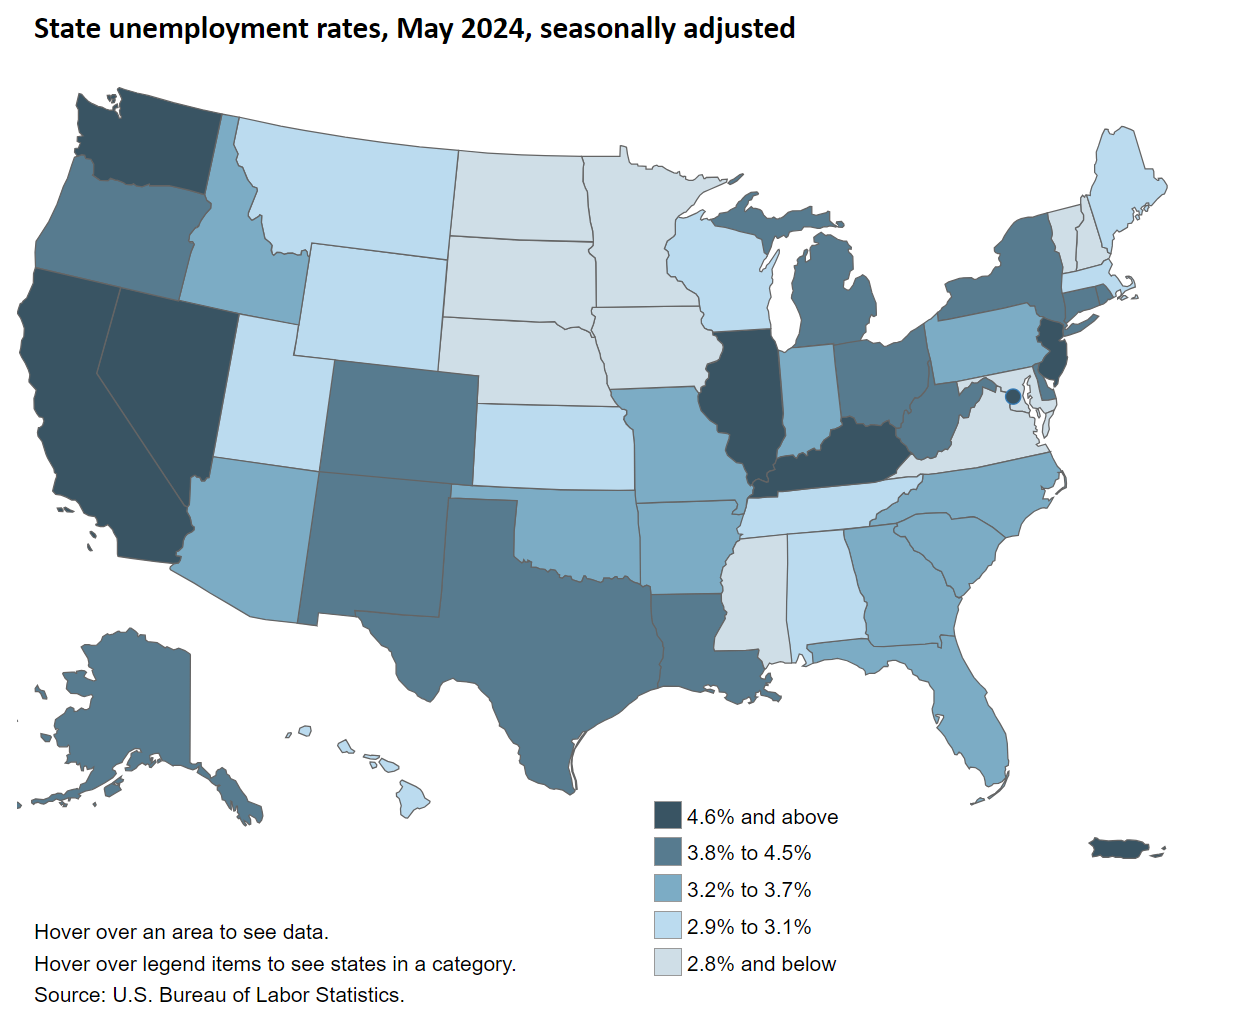
State unemployment rates by state: (not a huge fan of this visual since it doesn’t show the y/y trend - but the darkest states have some of the weaker labor markets, excluding Nevada):
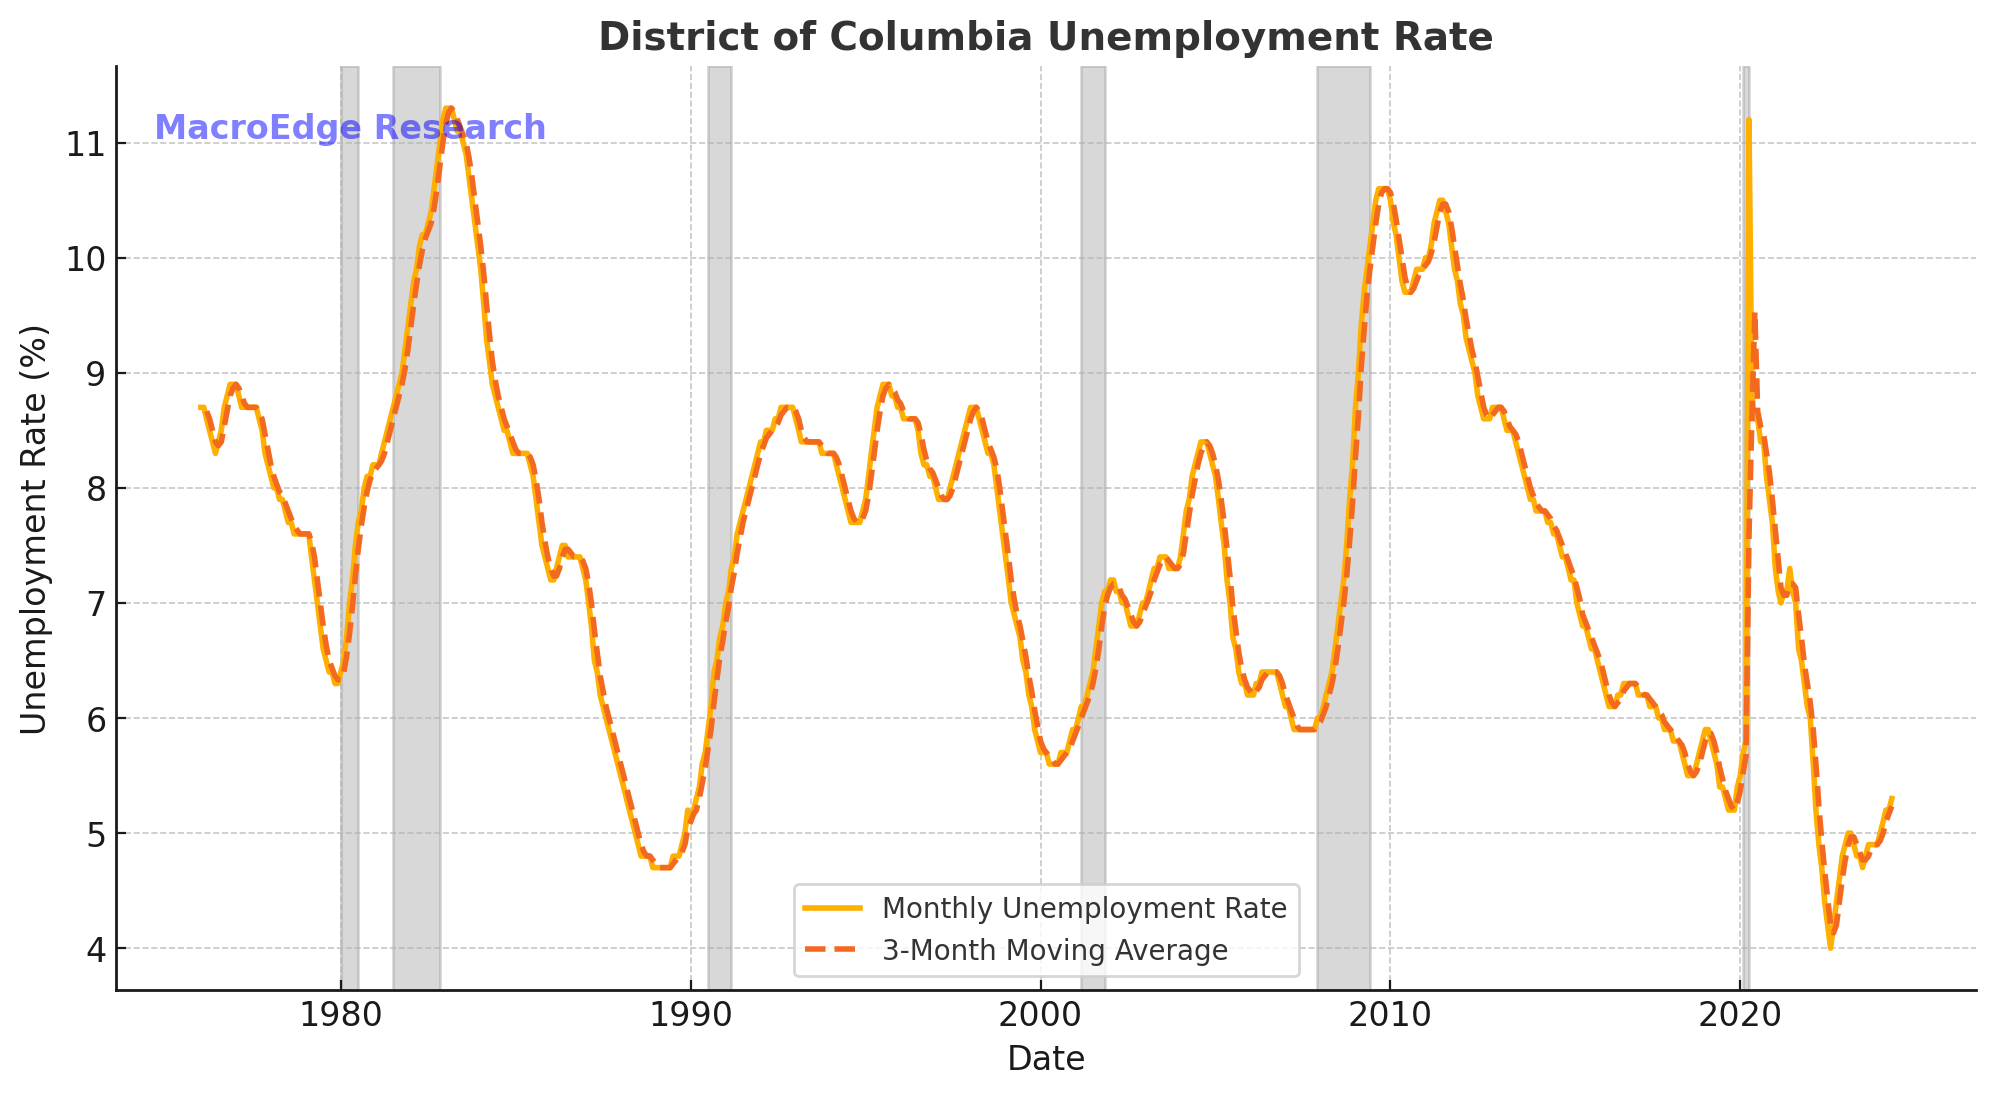
Here are some of the weakest states (+territories) that saw further weakening in May:
DoC (Washington, DC)
Rhode Island (largest increase y/y):
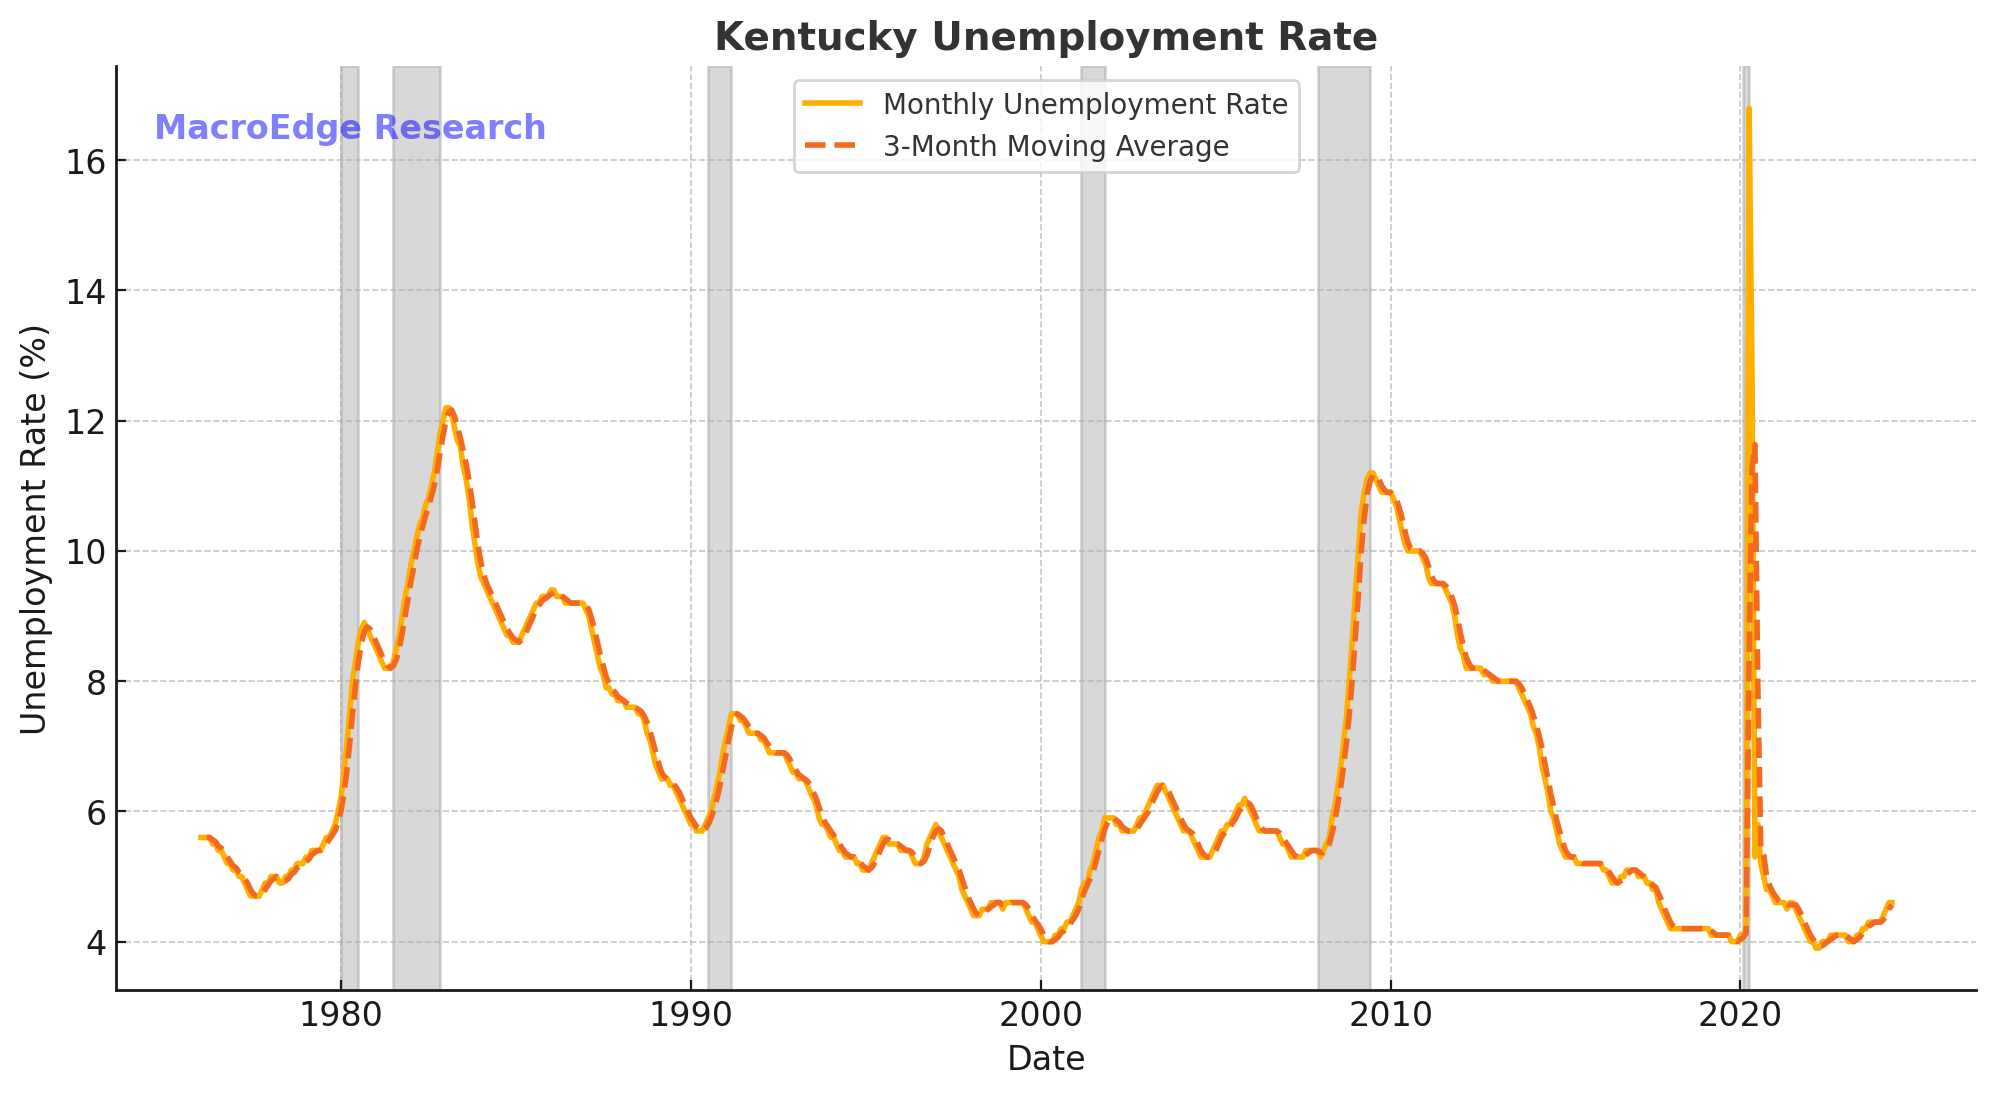
Kentucky:
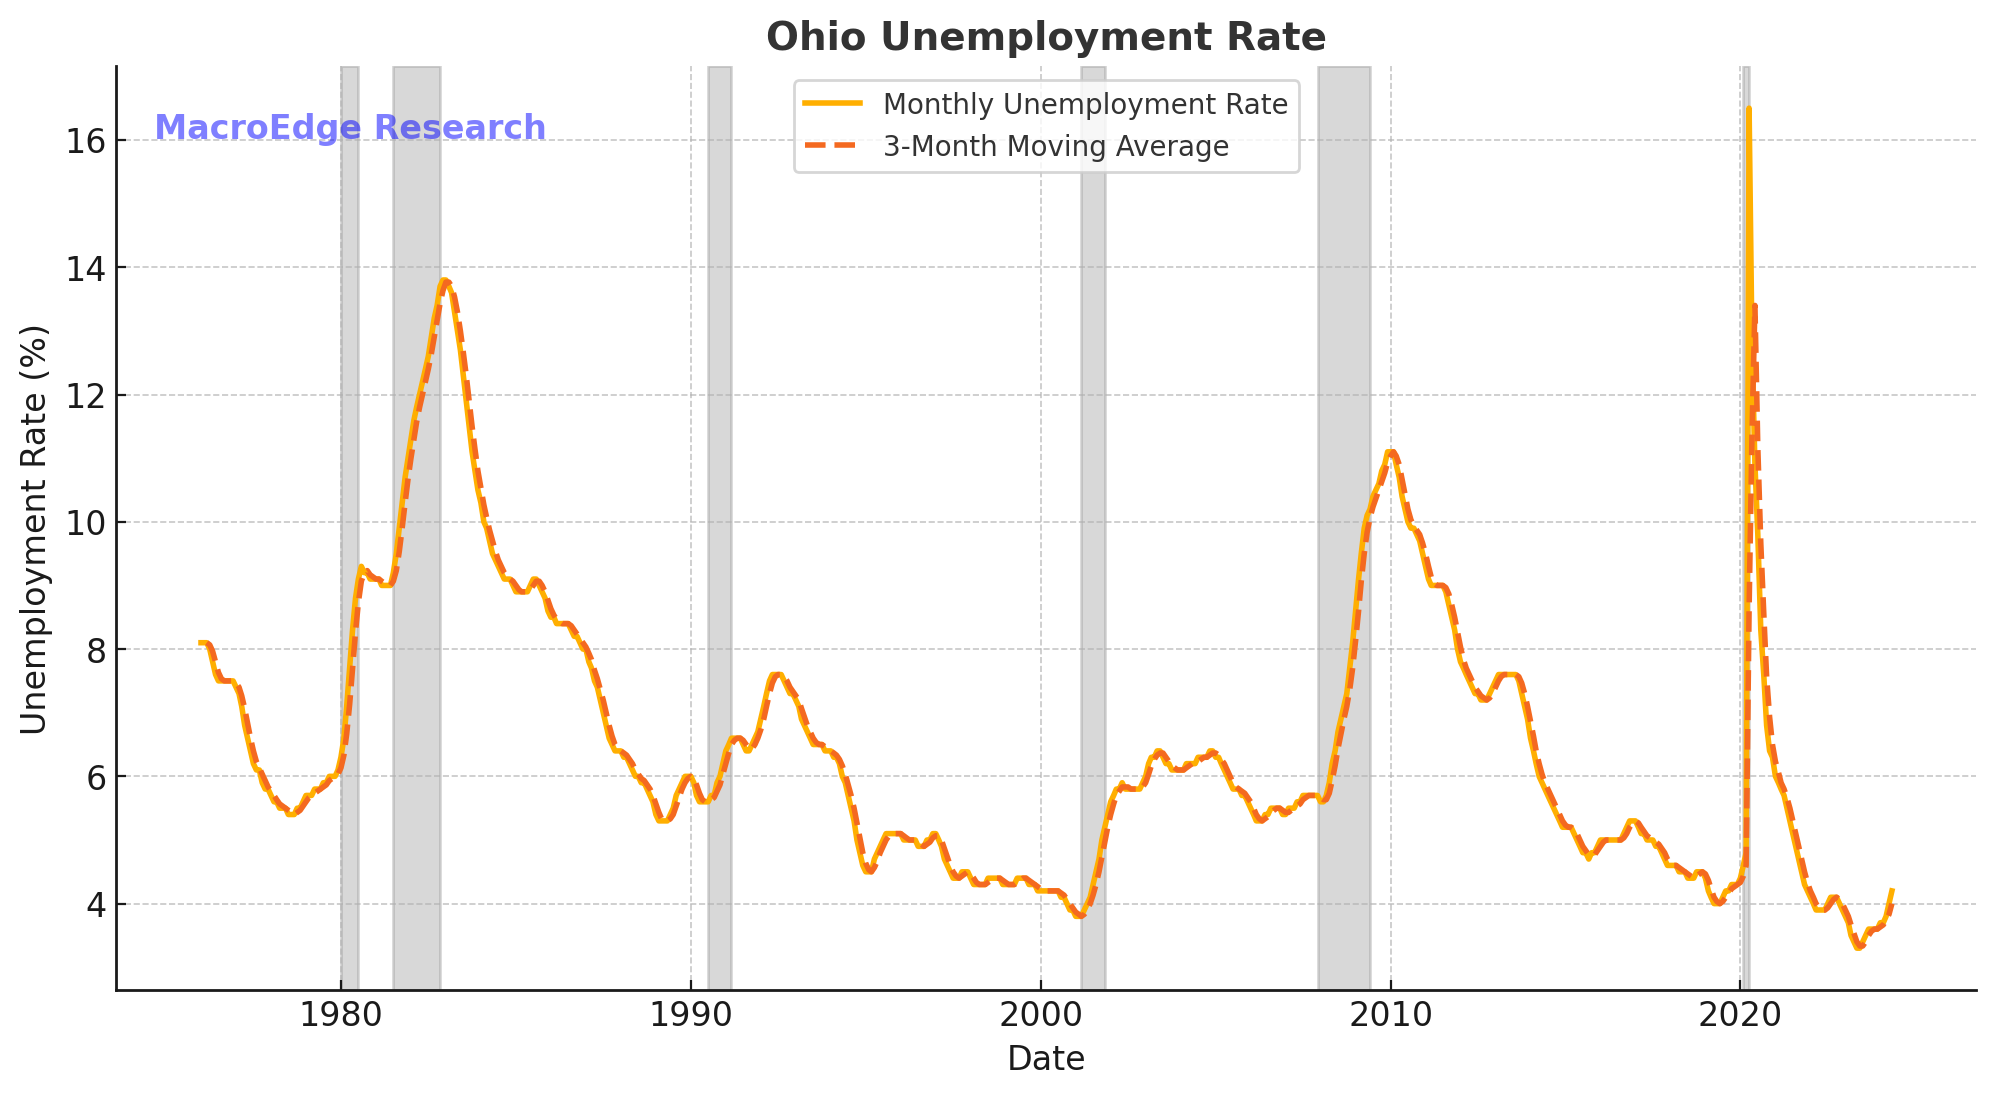
Ohio:
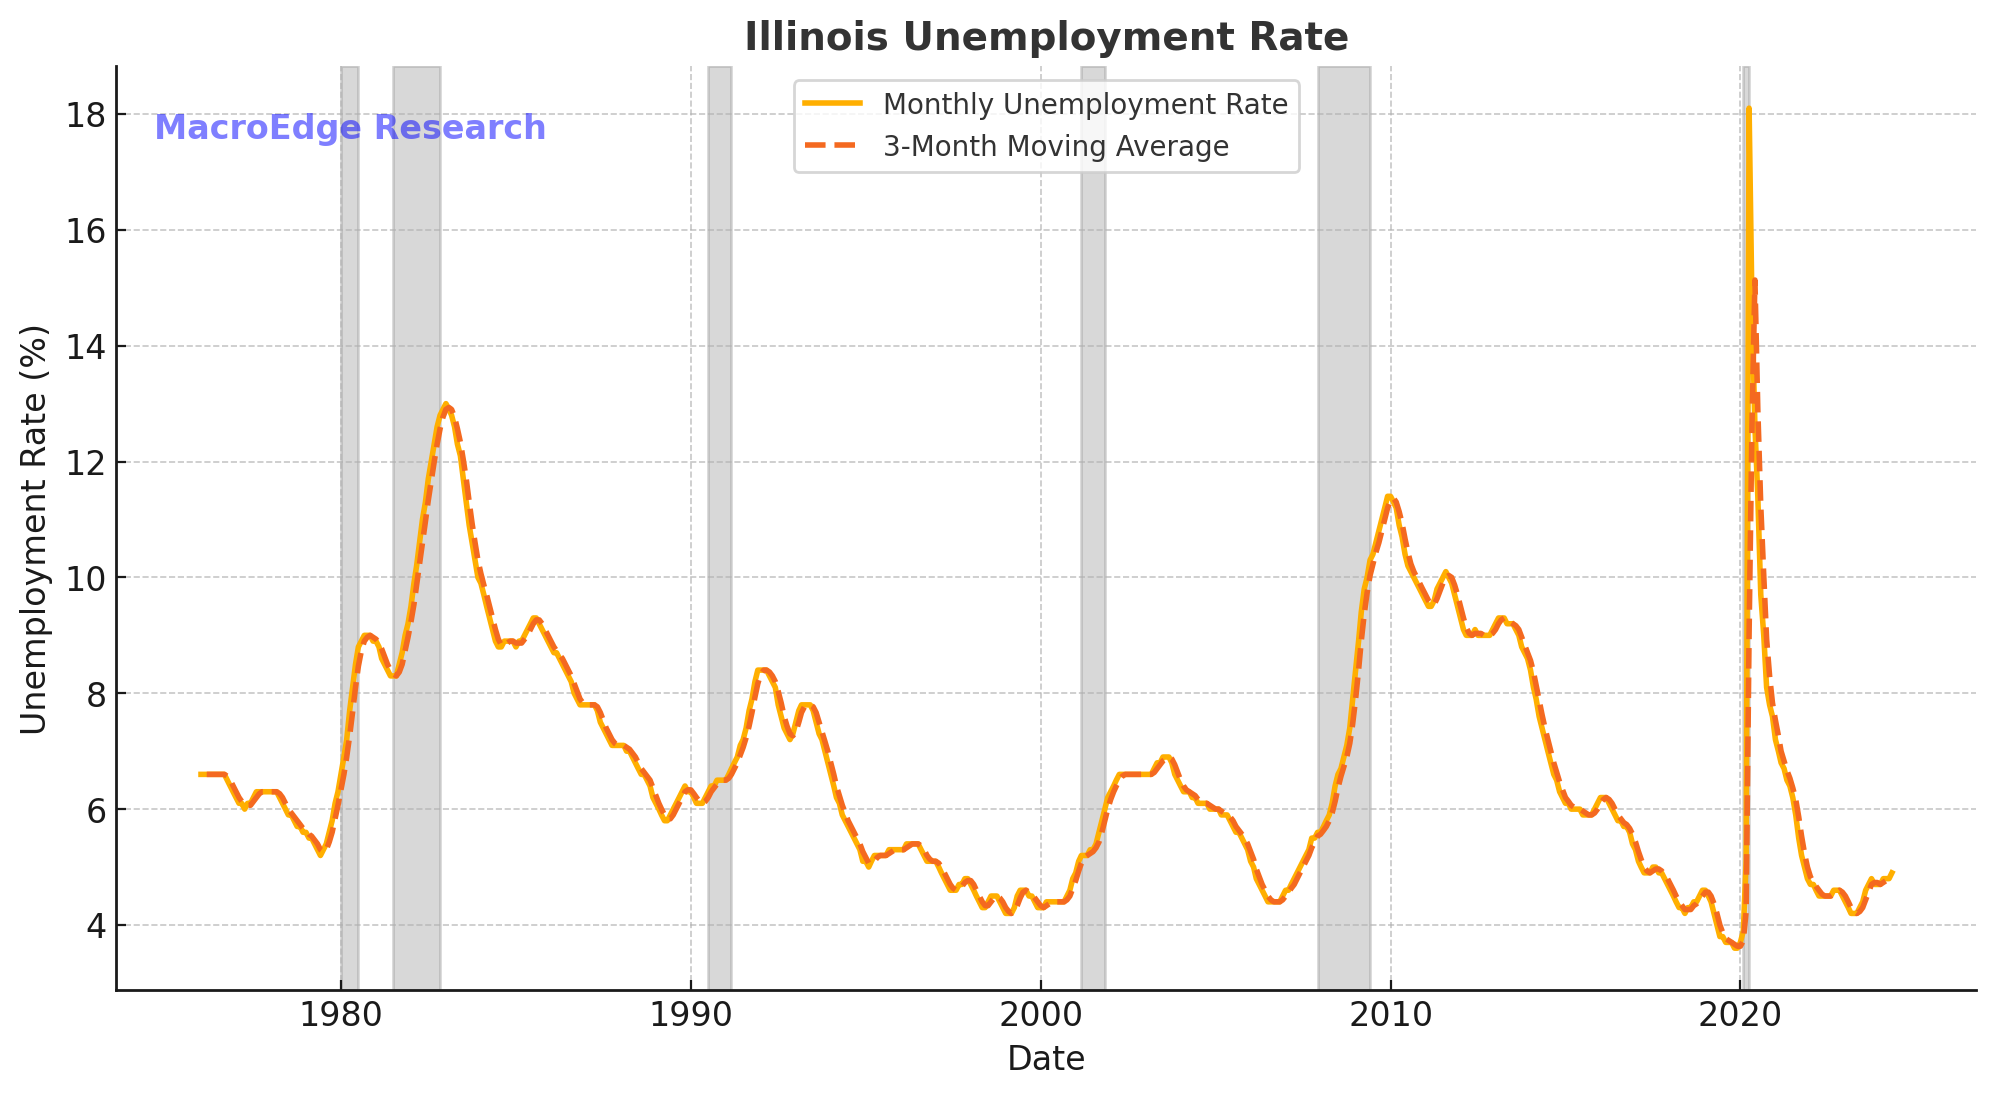
Illinois:
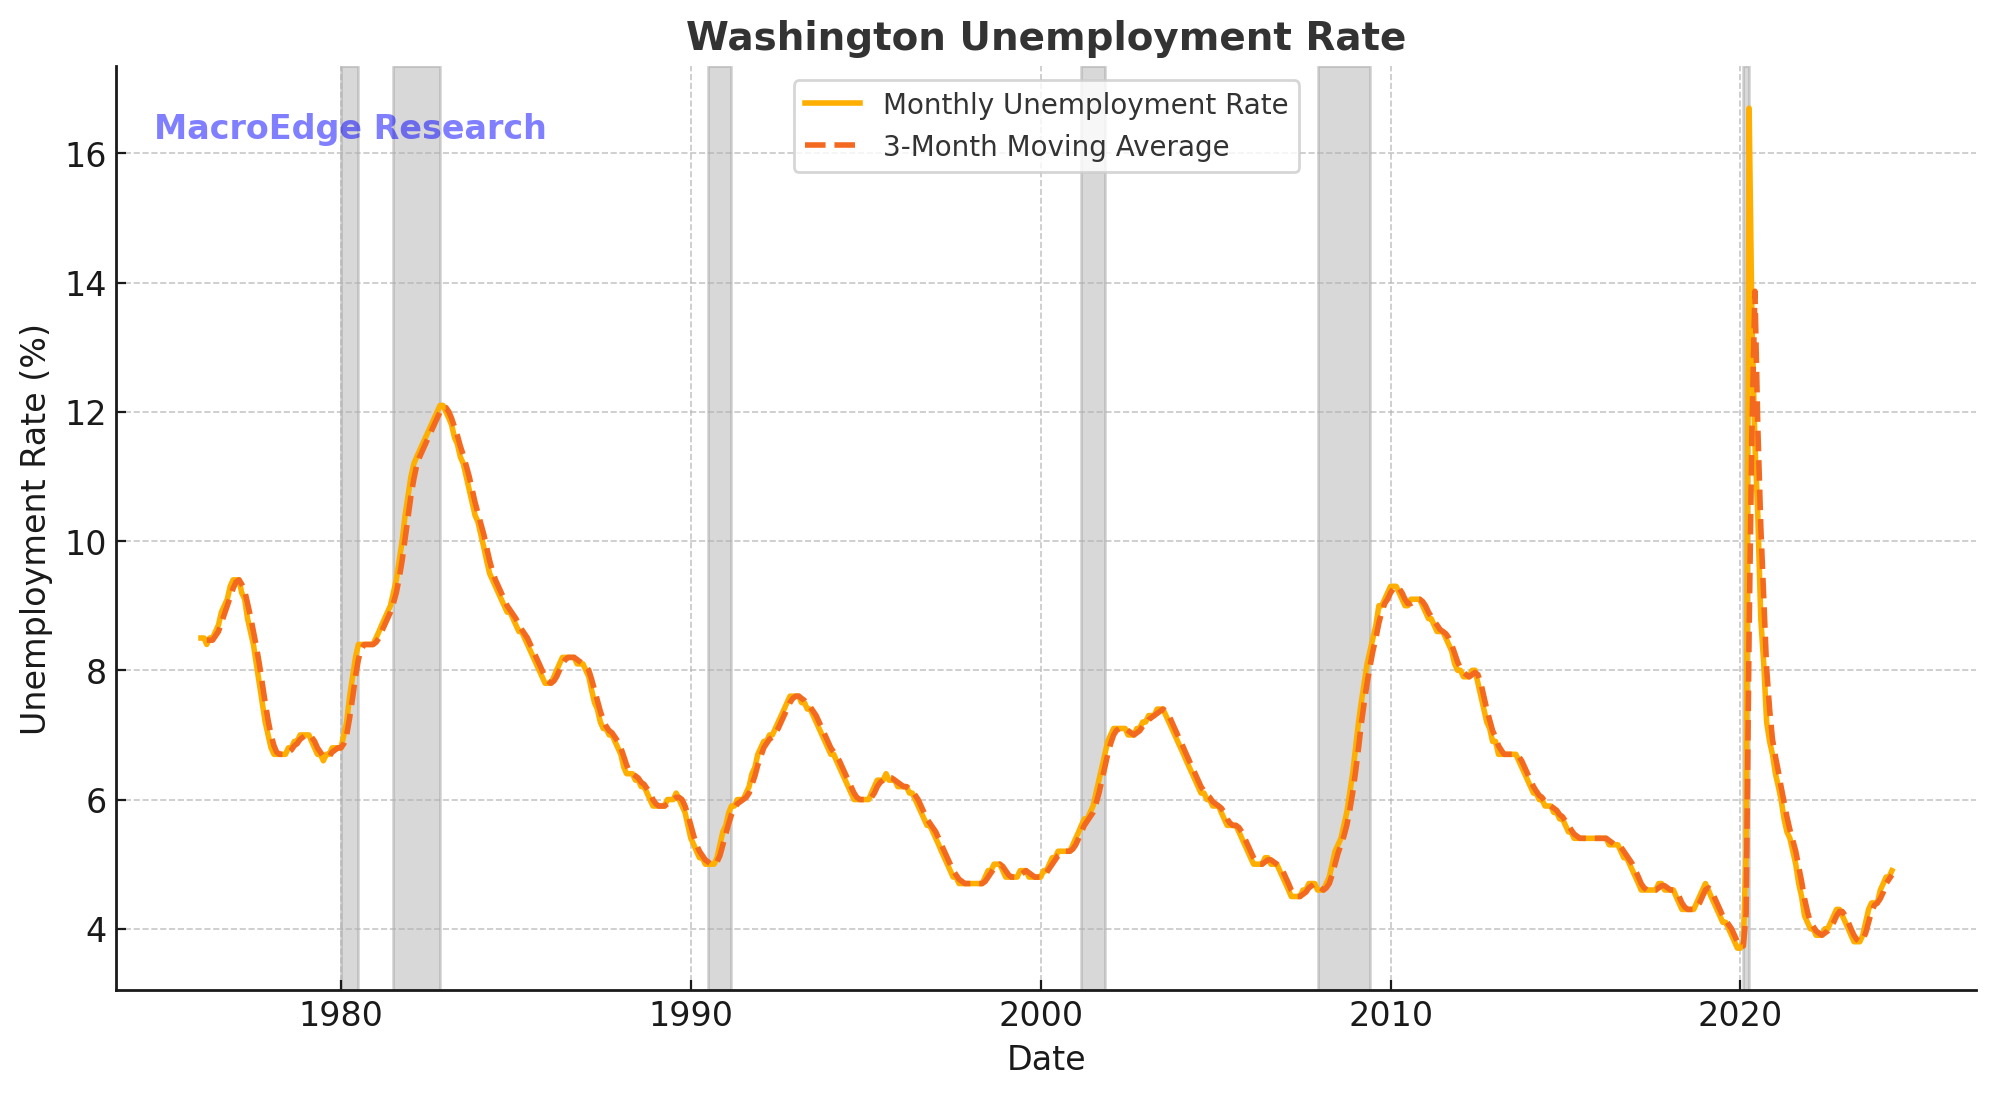
Washington State:
Colorado:
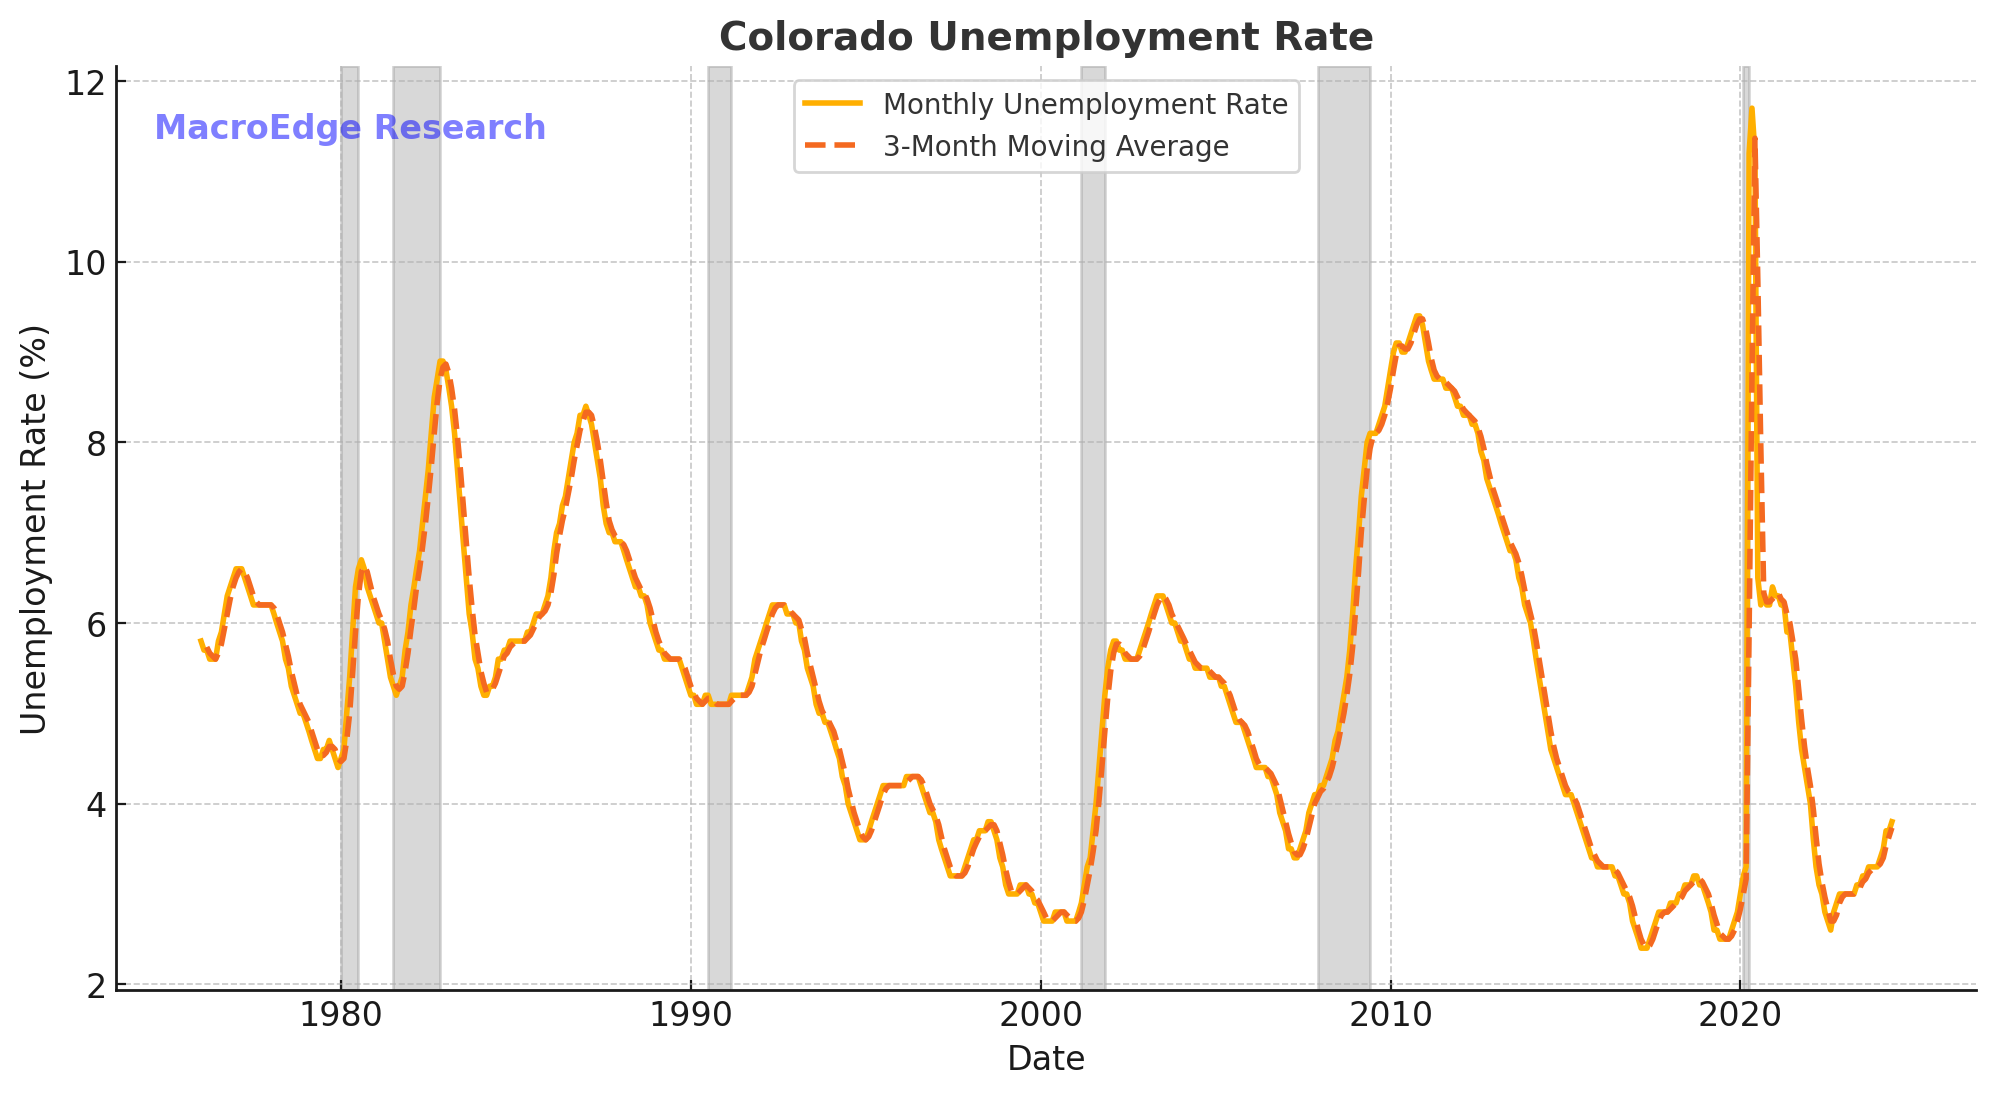
As you can see in each chart and each state - each labor market downturn (cycle-wise) is quite different from cycle to cycle. Some states are impacted to higher degrees, some less - and that depends on the sectors impacted most. Manufacturing downturns, technology downturns, et al., all play a factor in the state and even more local metro data.
Overall, the most important region to see further weakening will be the Sunbelt giants of Florida and Texas, as well as states like Arizona and Nevada, which have remained remarkably resilient (maybe beneficiaries of Californian outbound migration?). Other states like California, New Jersey, New York, and Connecticut will also be ones to watch as their unemployment rates have dipped slightly and we will have to watch the trend to see if they again accelerate later in the year. While we’ve had discussions around the overall efficacy of unemployment payments in the context of the gig economy, states with higher unemployment payments (like Washington at up to $999 a week) may see more unemployed people hitting the taxpayer wallet in the months to come. With the slower job cuts and this ‘summer lull’ the next earnings season beginning next month and the Job Cuts Tracker will continue to provide us further clarity on what’s ahead given the underlying trend of rising total unemployed people both nationally and in most states. It’s certainly interesting to see large increases in the unemployment rate within the state-level data (in states like Colorado)…
Have a great rest of your week.