
MacroEdge Memorial Day 'Redeye': Objective Data vs Labels: A Deep Dive of Many Labor Signals, ECB Cuts?, Summer of MacroEdge Data
In this MacroEdge Memorial Day 'Redeye' Special - our Chief Economist does a deep dive into the objective data, dismisses labels and red herrings, covers labor market signals, talks ECB cuts, and more

Happy late Saturday evening all,
I know some of you will probably catch this Sunday or Monday, so hope the Memorial Day Weekend has been going well for all MacroEdge readers and community members. This is always one of my favorite weekends of the year with the Monaco Grand Prix - so if you’re an F1 fan - I am sure you’ll be up in the morning to catch it as well.

There’s much in store for the MacroEdge Team - tomorrow we will be rolling out six new visuals and datasets to the Ozone Data Dashboard:
Private Jet Inventory (For Sale)
Boat Inventory (For Sale)
Restaurant Performance Index
Real Retail Sales (Inflation Adjusted)
Job Losers Unemployment Rate (Permanent / All)
TSA Travel Data
The latest data for May has been pushed through across all data and is visible. Six will continue to lead the way for us on the equity research side - providing the best objective view of where markets stand with his expertise, through MacroEdge Vision. Stay tuned for the next Vision update on Monday evening. We will continue to expand our data access and tracking as resources permit across different sectors & any data point relevant to monitoring the health of an industry, the labor market, or the economy. Seeing us going from just the MacroEdge Job Cuts Tracker to all of the data we track through both our indices and non is a sign of the progress you can continue to expect from our organization. Remaining on Substack for as long as we have wasn’t something that I anticipated us doing - but it continues to serve as a happy medium for managing both our email list as well as provide us with an alternative route for membership management. Our goal is to continue to expand MacroEdge.net to the point where we will be independent of Substack in the coming months, even though content distribution will still occur here. Substack community engagement is well behind other platforms and interfaces (like the MacroEdge Social Club on X) and we can serve you all better without the Substack tether in the future. We will continue to expand both Ozone - our economic research, Vision - our equity research, and launch several new offerings throughout 2024 and 2025 as we expand. The MacroEdge vision to become a household name in the financial and economic research and data space. Through Ozone we now have the:
Weekly Ozone Report
Weekly Vision Update
Labor Market Report (Once Monthly)
State of the Gambler (Once Quarterly)
& single-industry coverage as well as our efforts on the equity research side of things will continue to expand. Try out MacroEdge Ozone for two-weeks as we continue to expand here:
While the discussion this evening might be a little longer than past Redeye editions - we’re going to cover some important data and look at the reality of the data, some of my thoughts, and more on the disconnect between the data & assets, as well as the lag of policy transmission and what the Fed might do next.
→ My Thoughts
→ Deep Dive of Many Labor Market Signals
→ ECB Cuts
→ “Do Markets Care?”
→ Summer of MacroEdge Data
My Thoughts:
While there continues to be much labeling of anyone objectively concerned or looking at certain data points (particularly in the labor market) as ‘doomers’ particularly before the Fed has begun to move on rates - I strongly denounce this labeling. It’s no different than the current political landscape where labels and red herrings are used to silence individuals. I wrote on this several months back as the financial media, journalists (hacks), and a large swath of the financial community online - particularly on X, mistakenly use asset prices as justification for such labels.
New financial influencers on platforms like TikTok and elsewhere are funded by large financial media outlets and are paid to say whatever they are told. Thus a lot of what were seeing is a furthering of the disconnect between real world producers & financial industry paper pushers - which I have a feeling explains much of the sentiment seen in surveys versus the pretend bewilderment of financial journo-hacks who ask things like “Why are Americans so unhappy?”. I mean my goodness folks - is this question rocket science to people? Yes there are people out spending, people are out travelling, entertainment spend remains elevated and very high in sectors like gambling - even as a credit cycle has begun, but our goal here is to focus on the objective data that matters and try to anticipate larger shifts in the economy that we anticipate are already underway.
Back when we first began our discussions we were only a few months into the 10 year - 3 month inversion, data was still producing mixed signals, and no one anticipated that the rate hike impacts would take 19+ months of inversion time to see Fed policy transmit into labor data. Lesson learned for many.
While there is data to cover broadly across sectors/industries, etc - the data that matters to both participants in the economy and participants in the markets becomes the labor market data. The regime that has remained in this ‘zone of nirvana’ of yields at a place where they are not restrictive enough for financial conditions to tighten and put pressure on assets has dominated the last 5 months in particular. As anticipated, this may change when yields drop low enough to a place of concern about the broader economy (ie: Fed cut now!) or the inflation risks resume to the upside and yields begin to climb higher and weigh heavily on assets (as we saw during the hikes of 2022) and previous inflationary cycles like 1973. I am much more focused on the labor market risks and opportunities that will arise of a said downturn than building a ‘doomsday bunker’ in Hawaii as we’ve seen some tech co leaders doing of late as their latest and greatest hobby. On that note - let’s dive into the labor market signals and more.
Deep Dive of Many Labor Market Signals
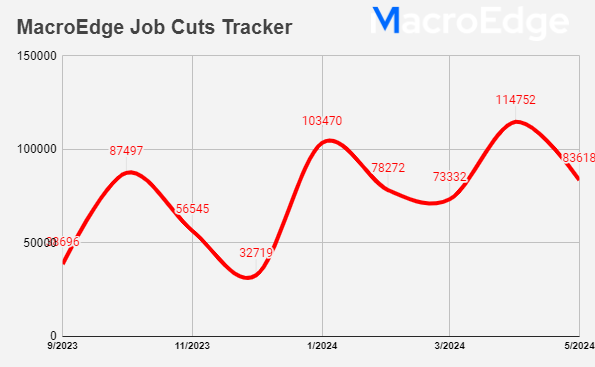
MacroEdge Job Cuts Tracker
Job cuts have slowed in the second half of this month, and it’s possible that we see slower job cuts through the summer months (ie: through July) based on past seasonal trends.
Challenger Gray and Christmas Job Cuts
Highlight similar labor market softening as the MacroEdge Job Cuts Tracker. The seasonally adjusted variant from Pantheon can be particularly useful for estimating Initial Claims in the months to come.
Initial Claims
It’s still surprising to some that initial claims remains low yet initial claims typically do not advance higher until the Fed cuts rates & in this new gig economy we’ve discussed why this measurement might not be quite as sharp as it used to be. The Challenger Data and MacroEdge Job Cuts Tracker point towards a rise in the SA Intial Claims figure in the months to come.
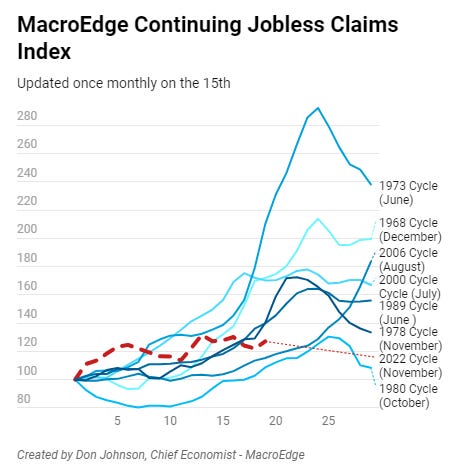
Continuing Claims
Highlights ‘continued’ softness in the employment market. This figure has been well elevated off of the lows for almost 2 years now, and historically has begun to increase further following Fed rate cuts.
U3/U6 Unemployment Rate
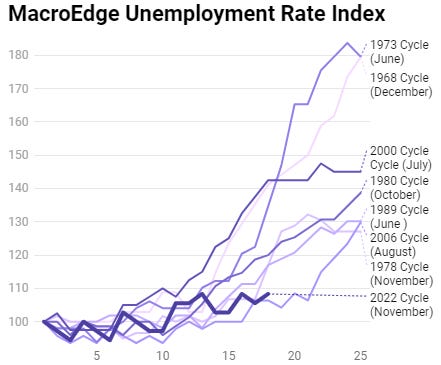
Our expected range for U3 for the May reading is 3.8-4.1%, with an expected figure of 4%. The lag in U3 can be viewed at MacroEdge.net/data which highlights the below visual by cycle:

One of our reasonings for not expecting a 1984/1995 style scenario has been the lack of a much lower base U3 rate, this cycle has an increasing U3 rate from a very low base, which has in the past contributed to hard landings. The U6 unemployment rate has softened sharper than the U3 figure, and is tracking similarly to the 2000/2001 pathway.
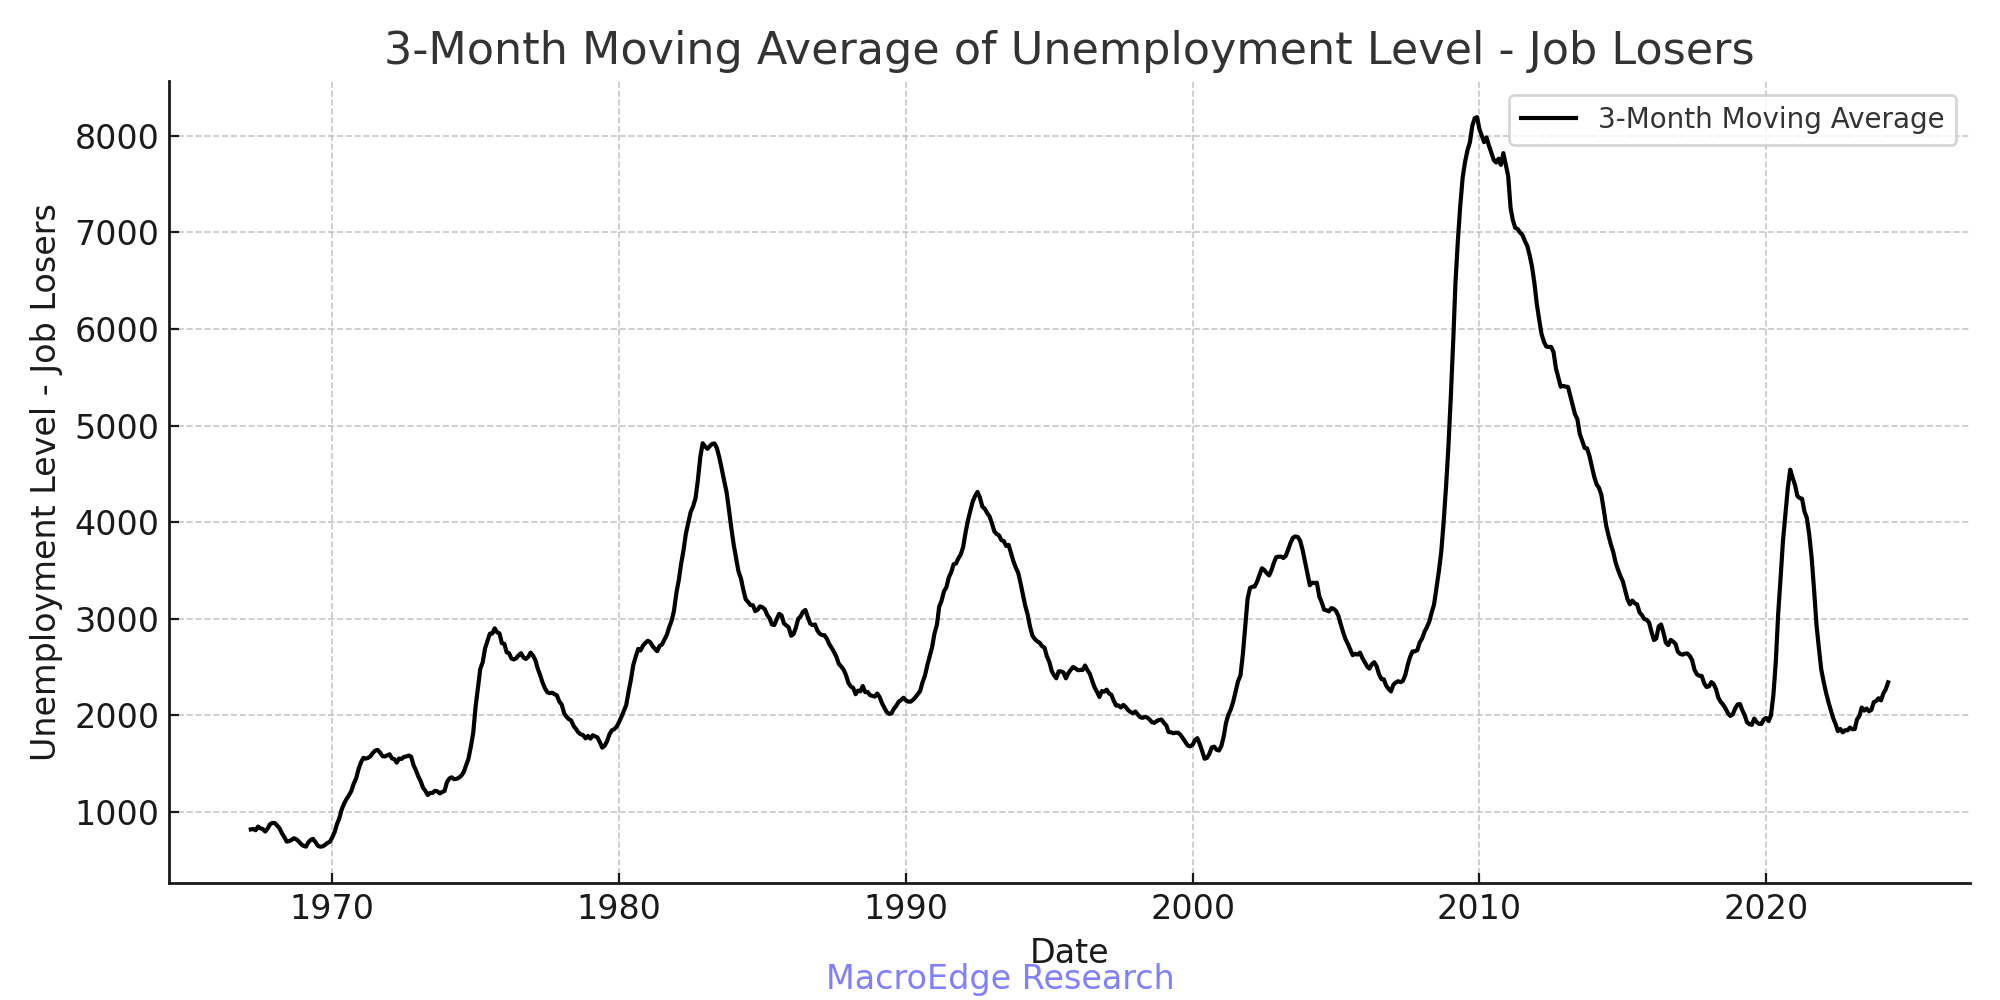
Job Losers
This dataset from the Household Survey highlights job losers that are not laid off temporarily. This chart in particular, highlights underlying labor market weakness on the job loss front (particularly when smoothed as we have done in the visual).
Permanent Job Losers

State Level Data
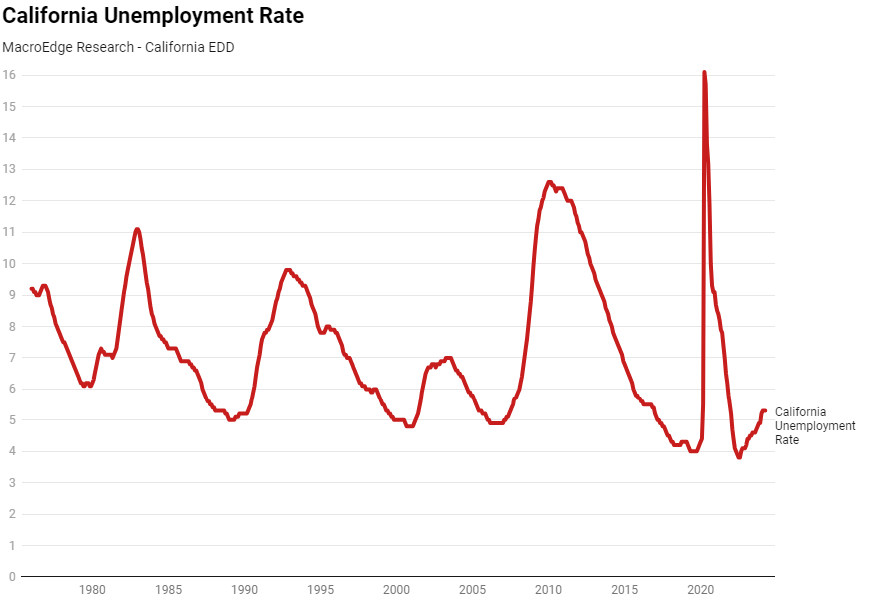
On the state level data - which we track frequently and closely - it continues to point towards a cooling labor market. We’re not seeing sudden jolts or shocks at the state level data currently, but we have seen labor market conditions soften/weaken in 40+ states now as compared to 12-months ago. 27 states are on our ‘Unemployment Radar’ indicating they’ve seen a >.5% or greater increase since the low. Arizona notably has been the one state to enter the downturn category and return to ‘strong labor market’. Texas and Florida saw unemployment rise in April and we will see soon in the May labor data if this cooling continued elsewhere in the sunbelt. Californai continues to be hit hardest by layoffs affecting a variety of sectors.
California has seen the unemployment rate level off for the past 2 months, but the state has the highest unemployment rate in the country:
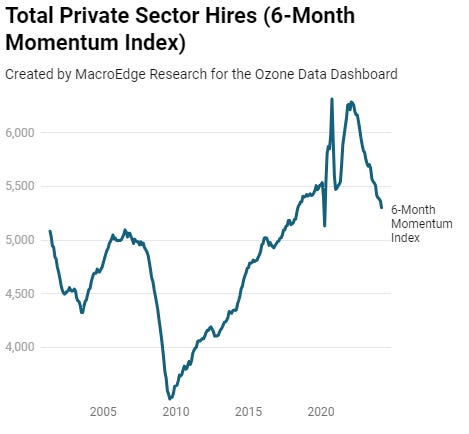
Private Sector Hires
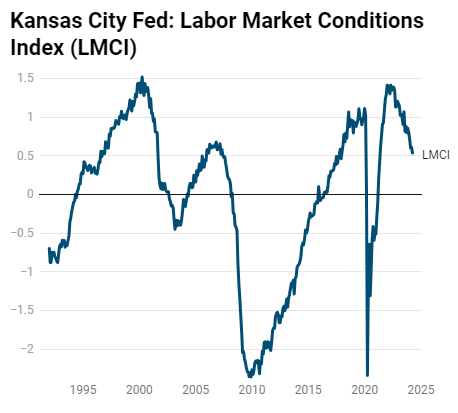
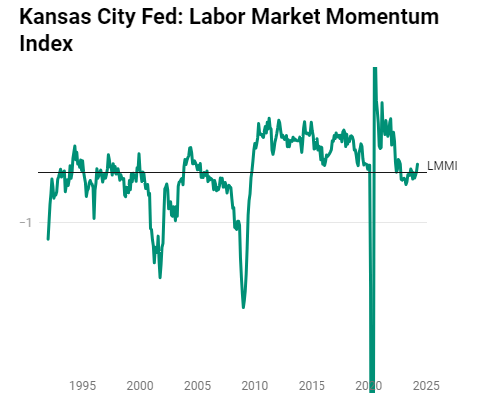
KC Fed Labor Market Conditions Indicators
One of the more resilient indicators has been the KC Fed Labor Market ‘Momentum Index’ - that saw a rebound in April on lower job cuts (second chart). Whether or not this bounce remains sustained remains something to be seen.
Total Nonfarm Payrolls
The brightspot celebrated by most - is one of the most lagging indicators. Total nonfarm payrolls have continued to rise in the face of cooler labor market signals across the board. Pantheon Macro has done a nice job demonstrating that small business hiring intentions may weigh heavier on hiring activity in the months to come, although seasonal summer part-time hiring usually wraps up in May.

(NFIB/Pantheon Macro)
Nonfarm Payrolls v Trucking Activity
Is trucking again - the tell?

Indeed Job Openings v JOLTS
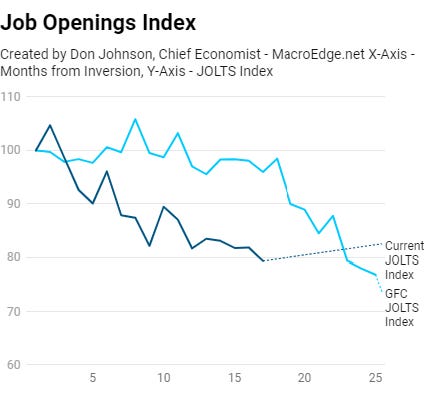
Jolts and Indeed are painting the same picture - with Indeed leading the way for the JOLTS figures. Based on the Indeed figure of late, we anticipate that JOLTS will continue to fall in the coming months.

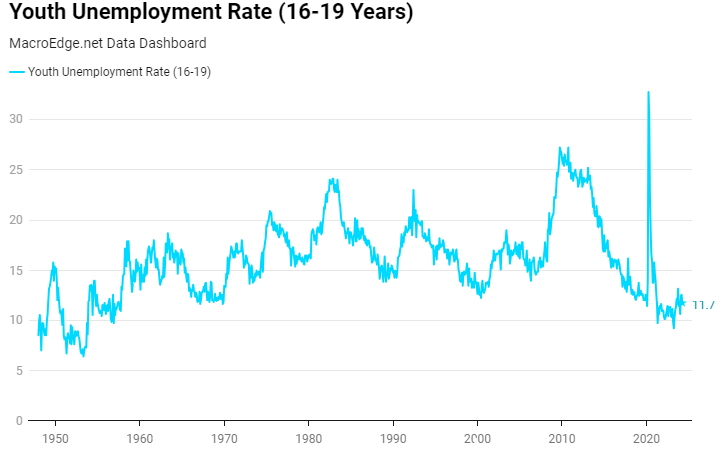
Youth Unemployment
Produces a lot of noise but elevated from the lows at 11.7%. This data is lagging due to the time in which they release it (nearly two months after the current date), so it’s usefulness beyond confirming trends that are already in place is limited.
Female Unemployment
In my opinion - an understated risk for this cycle, and understated credit risk, particularly for the 18-40 or so category on single incomes. There’s also an auto loan risk in this subgroup as well as a mortgage risk, if the single income stream is lossed and we saw a higher level of job cuts take hold in the labor market.
ECB Cuts
The ECB has been the next Central Bank to signal likely cuts in June if their inflation data remains in line with expectations. Yields aren’t pointing to significant cuts beyond any initial cut, and we saw the RBNZ (New Zealand) come in and revise its inflation model higher due to persisient CPI (still at 4%). If the ECB cuts as they have been saying over & over (again even in the face of elevated EU yields) - this will likely push the BoE and others towards making moves either next month or in the months to follow.
Do Markets Care?
Have markets cared about all of the data that’s been drumbeat or below expectations in the last 5 months? Absolutely not. As the data has stayed a mixed picture - particularly on the labor market. With the labor market conditions coming more into play and becoming more of a global Central Bank concern (as we’ve heard from rhetoric and in the data globally), markets will likely take note of whatever policy endeavor central bankers decide to pursue. It’s preemptive to declare inflation and its risks dead - and a policy error could arise on this front in the face of weaker labor data and woefully irresponsible fiscal policy makers.
There’s a wider breadth of softening data now - from the construction cycle rolling over, to leading cyclical sectors in sharp contractions (like in technology employment), and slowing headline nonfarm growth. These are all things we will continue to watch out for and see how they impact markets-at-large, which Six will discuss more in-depth in the months and quarters to come.
Summer of MacroEdge Data
If there is one thing I am absolutely certain on - it’s that remaining on top of the data will remain paramount through the summer months, through election season, and beyond - particularly if we see the Fed cut rates happen in this time frame.
Stay tuned for a housing inventory deep dive in the weeks to come, as well as more data rollouts and expansions of our offerings as we continue to track the critical data that matters for individuals, small business owners, and enterprises - alike.
Have a great rest of your holiday weekend and we will see you on Monday evening for the weekly report. We’ll try and keep things as objective as possible in the face of many different signals and datapoints, and certainly are not adopting the ‘bunker mindset’ in the meantime.
Have a great weekend,
Don
*excuse typos