9/4 Weekly Report: Soft Landers All-In on Red, Regional Employment Trends, 'Hotel Stagflation', Freight Data, and Voodoo Economics
This holiday edition of our weekly report gives readers a deep dive into more employment data, casino revenue, the freight market, 'hotel stagflation', and more...
Weekly Data Dive and the Week Ahead (@DonMiami3, MacroEdge Chief Economist)
I hope everyone had a great Labo(u)r Day holiday if you’re located in the US or Canada - be a busy week ahead for myself so certainly enjoying the last few hours of peace before it’s time to ‘suit up’ again, literally. Given the holiday - not too much ground to cover with you all but certainly wanted to share some more interesting charts and data that I’ve assembled over the last week so that we can continue hunting for needles in the haystack on the so-called ‘phantom recession’ that we’ve been waiting for since the 10y3mo curve inverted all the way back in November of last year. Still in the camp that I think it will be more difficult for equities to see pedal to the metal price action here, especially with this large move we’ve seen in oil over the last few weeks putting Brent Crude to back near the $90 level. This makes the inflation fight that much harder for the Fed (that is already in extremely difficult spot with near-record deficit spending) - and they also will see y/y base effects roll off on things like gasoline. I’ve been sharing an interesting clip from a decade or more ago about what happened in 2008 when oil began to rise precipitously leading up to the $145bbl peak in July - you start to see the consumer and business alike get absolutely crushed by increased costs. It is going to be a very interesting next month or so on the oil market front - and we’ll see what actions might be taken to halt this latest rise that further threatens the soft landing disinflation narrative.
Thanks for reading MacroEdge! Subscribe for free to receive new posts and support our work.
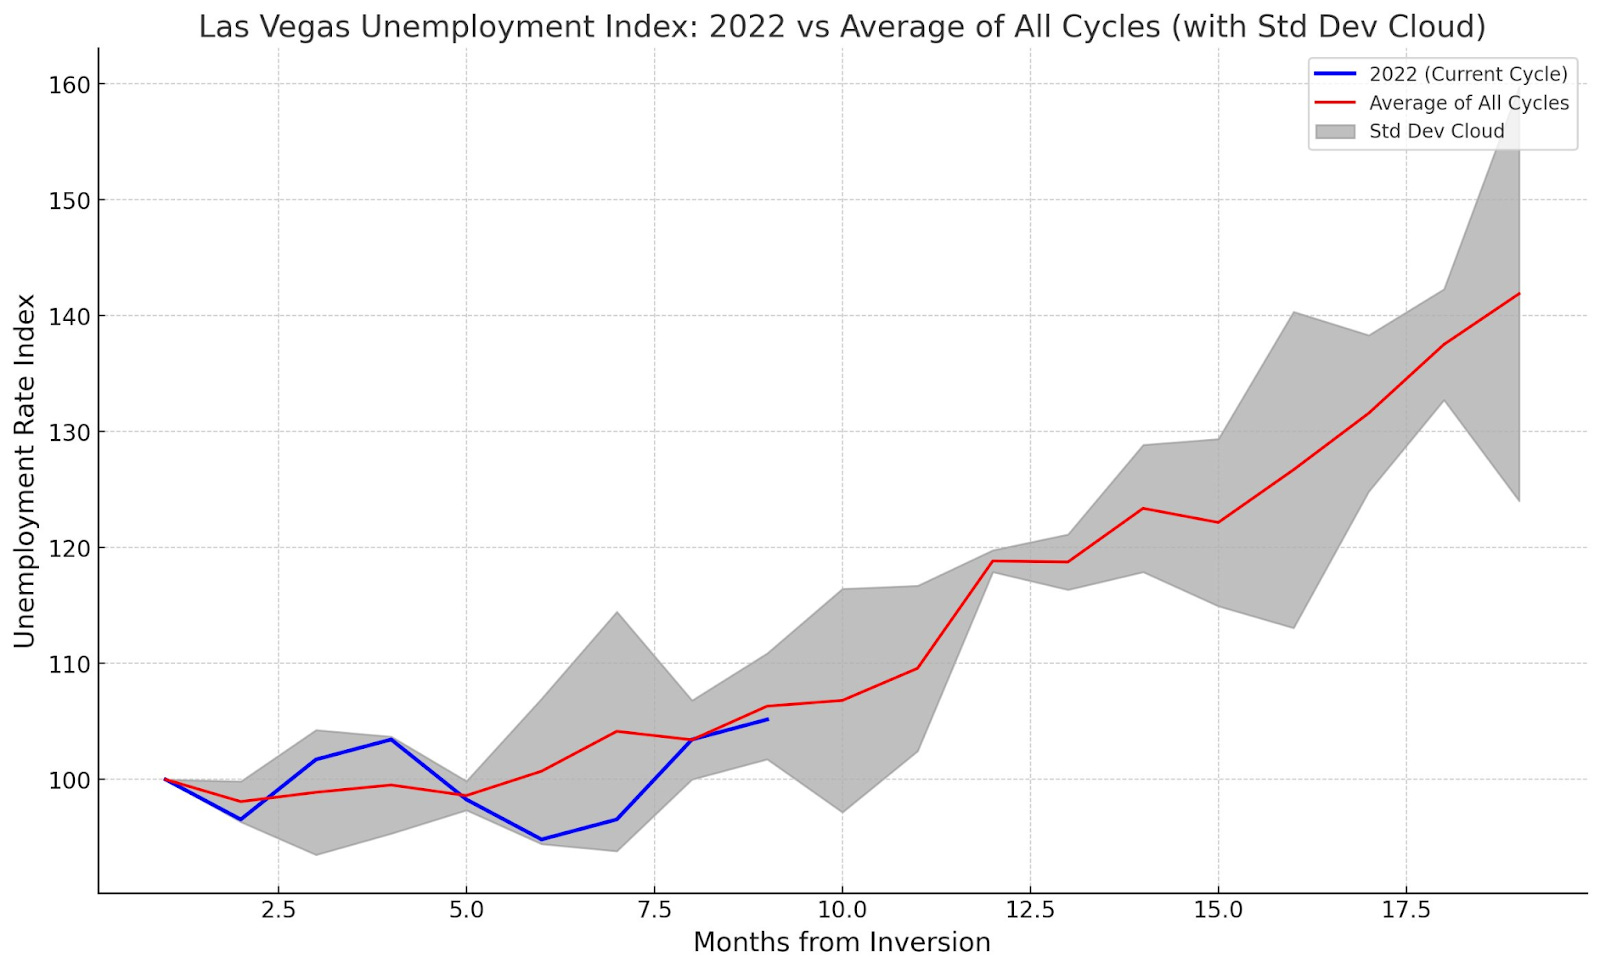
I discussed focusing much of my attention today on the particular micro-economy found in the Las Nevas, NV metro area given that it’s historically seen very large upswings and downswings in economic activity when things go good and when they go bad. I think we can use Vegas (not revenue gaming, which I’ll discuss in a minute) as a potential ‘needle in the haystack’ city for where we may see the larger national employment picture follow Vegas in months to come. While job creation in Las Vegas remains particularly strong - a bit above national in terms of % right now - unemployment and jobless claims have also started to round the bottom and make their way up as well. I was able to plot this here:
In the graph you can see the current unemployment index (looking at monthly unemployment number) relative to the average of previous economic cycles given in the Vegas MSA data. We are currently trending up (slowly) for unemployment but right within the standard deviation of past cycles. The next 4-6 months are going to paint a very clear picture for us in Vegas about what we can expect on the unemployment front and especially on when we can expect to see job creation roll over and become ‘job destruction’.
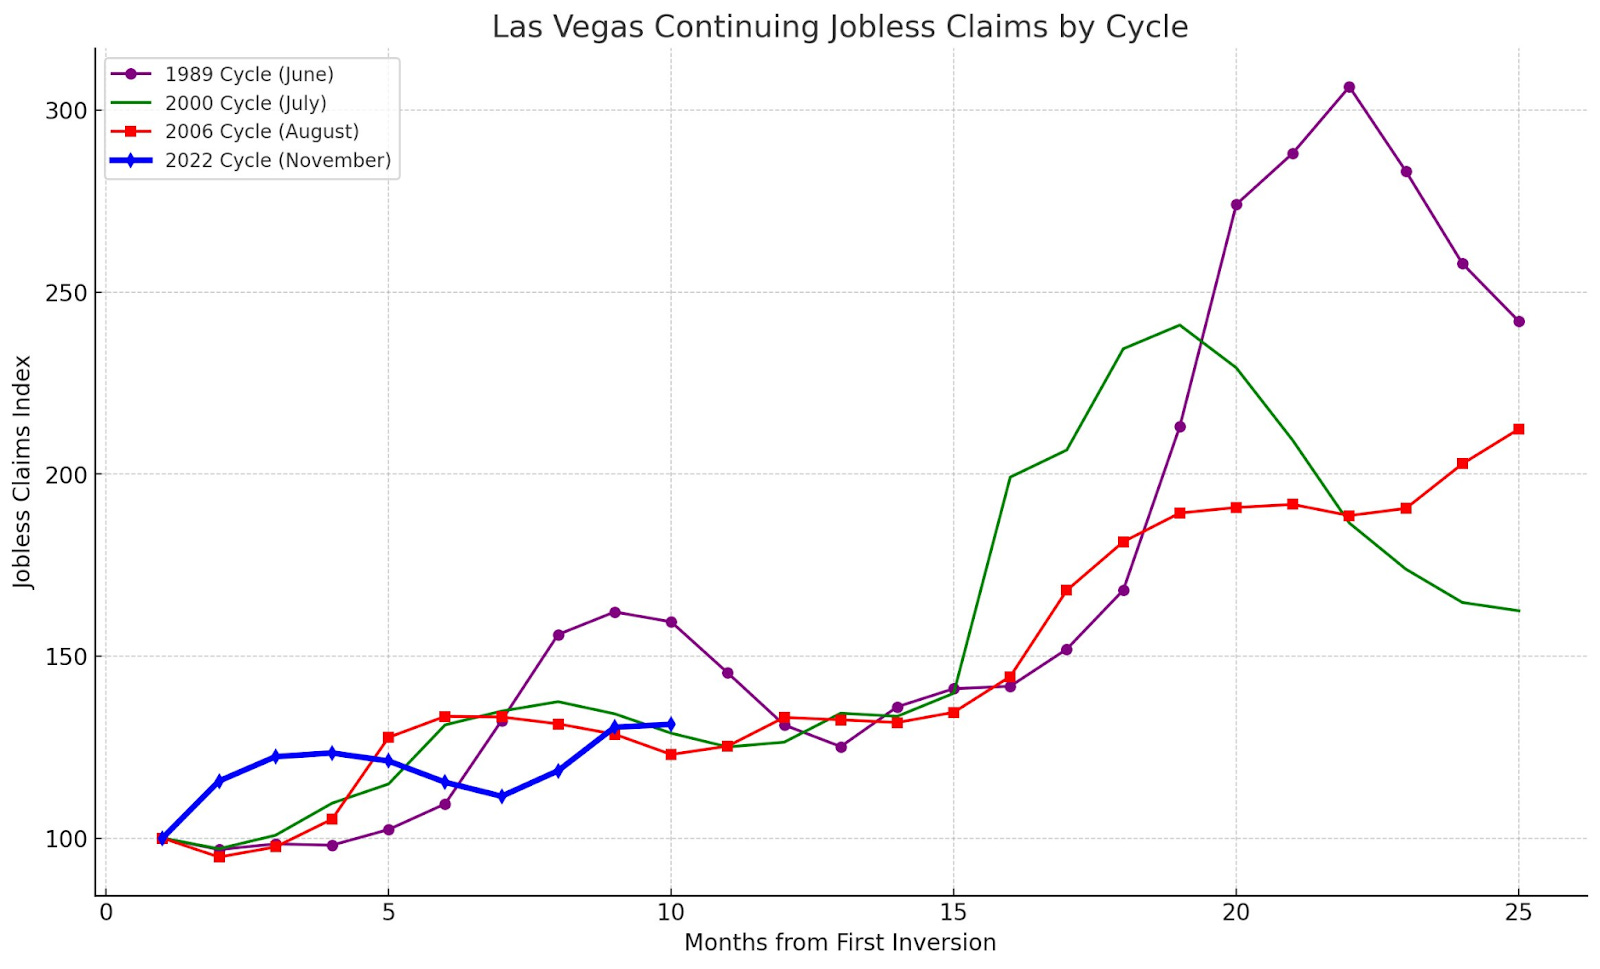
Here’s Vegas IT jobs in addition to continuing claims:
Note both IT job growth (remains relatively stable for now) and continuing claims which have now begun to trend higher slowly before we get to that month 15 ‘green light’ hammer the gas moment (we are 5 months away from this “green, green, green” flag being waved. Lots of important regional metrics that we will continue to follow over the next 5 months.
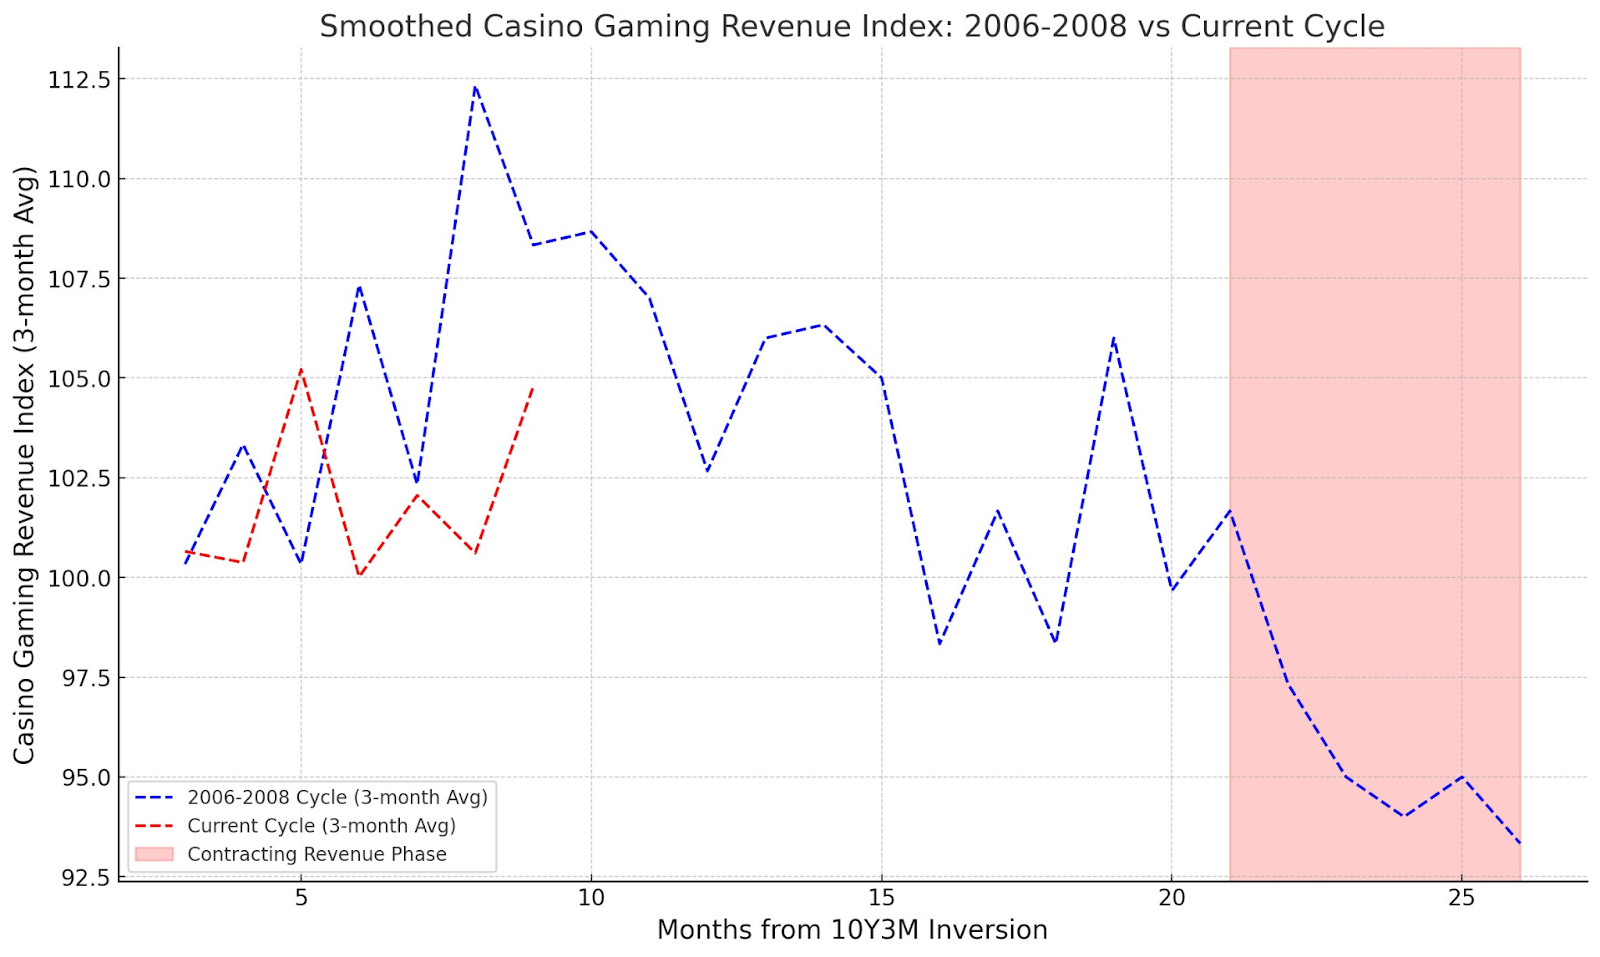
Another hot topic for Vegas continues to be record-breaking gaming revenues. I think this warrants caution as having any bearing on the actual health of the larger economy. More Americans are desperate to hit and big and escape their difficult lives so they take it to Vegas to either lose big or win small (and of course - you have a few dozen that live to tell stories about their new retirement plan). The graph I generated utilized a smoothing function using the 3 month moving average in order to plot revenue by both the 2006-2008 period and the present cycle. As you can see - we are trending up into the winter (that happened in 2006 as you can see on the chart as well) - and it really wasn’t until month 21 following inversion that unemployment and a bad economy we’re at the forefront of people’s minds and Vegas gaming revenue began contracting. I am anticipating a few more strong months for Vegas into the holidays, Formula 1, and potentially even the New Year - although things may look quite different in Sin City for all the sinners next year.
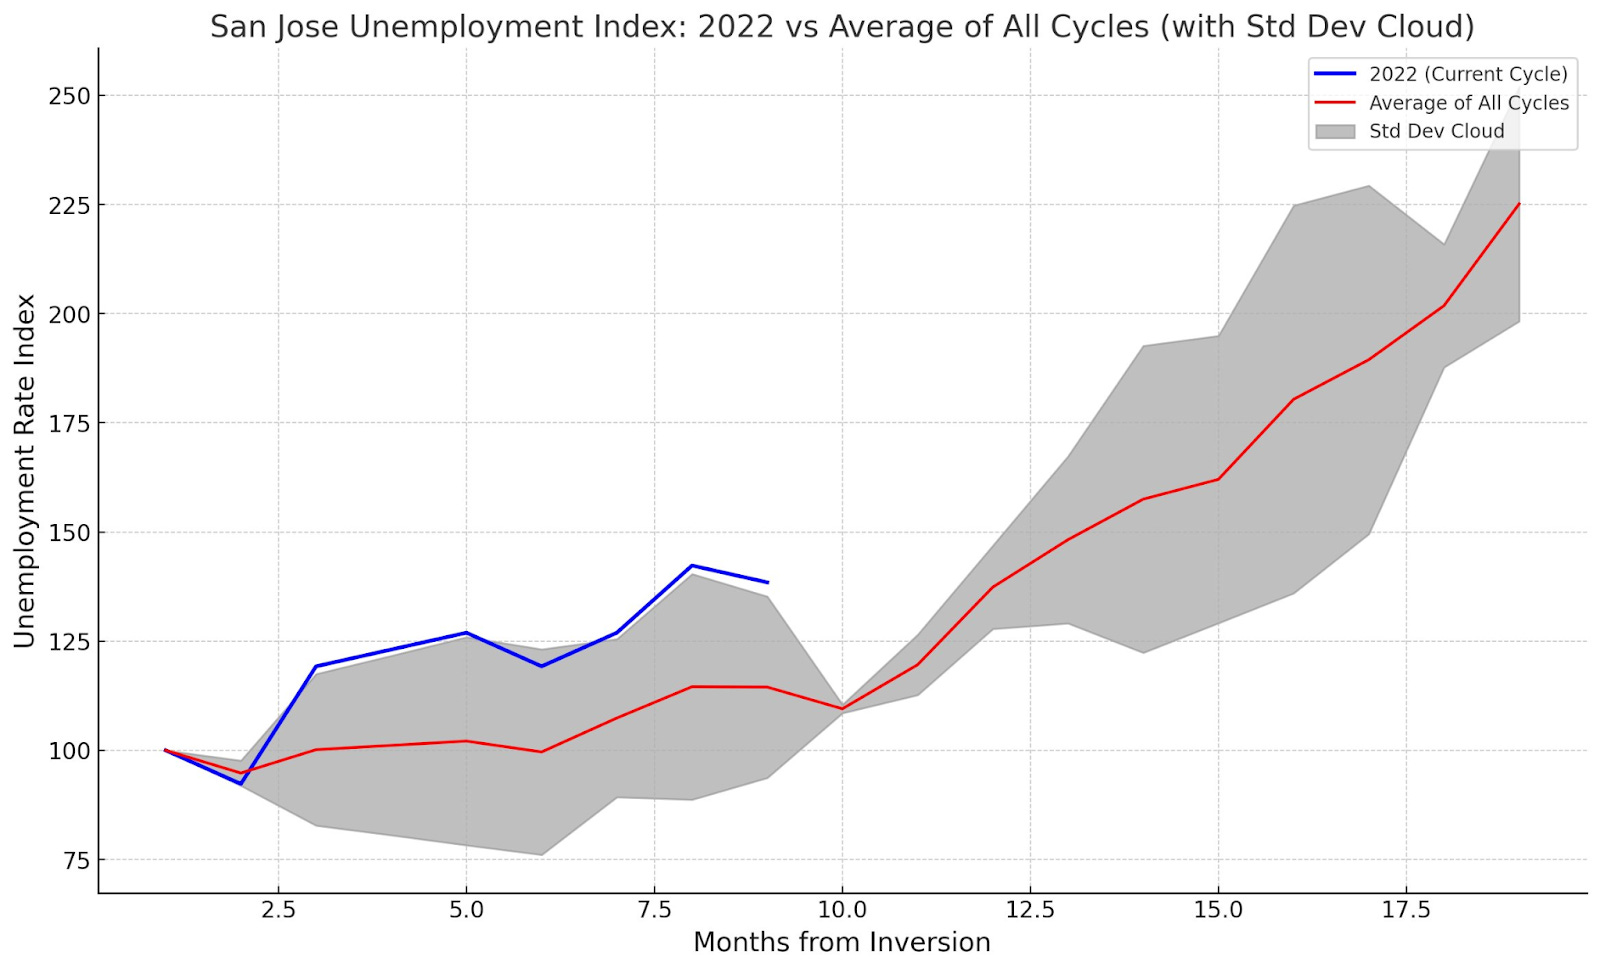
Spinning back to employment - I wanted to do the same look with another potential ‘bellwether’ city in the tech-heavy San Jose MSA and the results looked like this:
We can see that San Jose’s current unemployment rate index is tracking fairly in line with previous cycles and actually a bit above the average standard deviation for the plotted cycles.
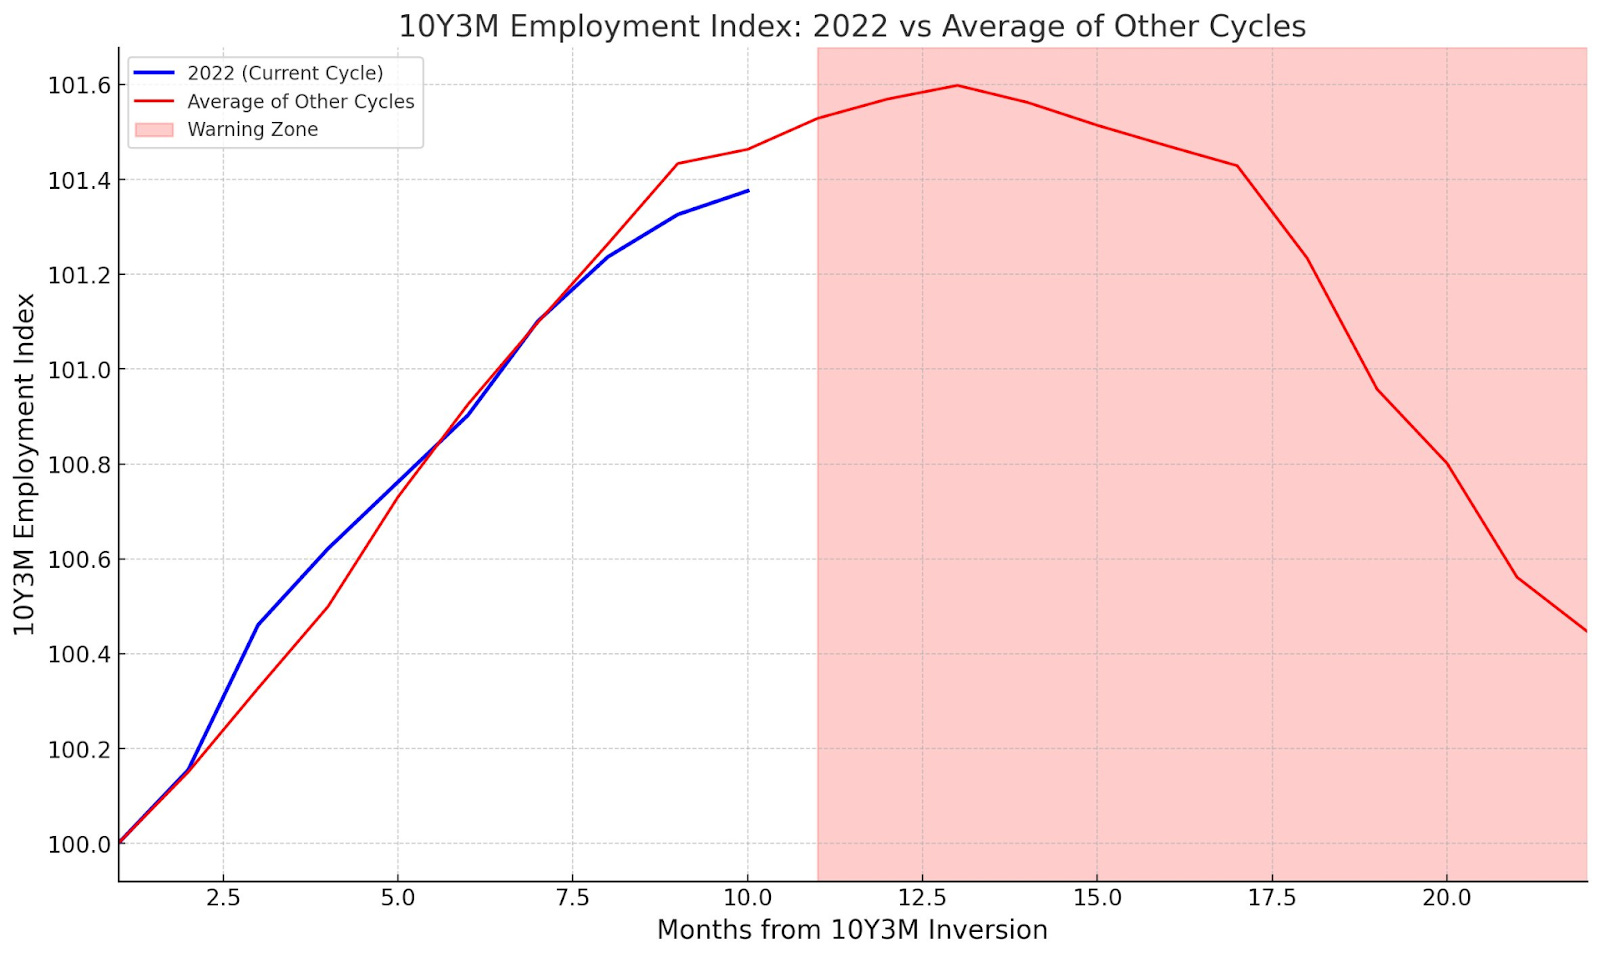
Lastly - I’ll given an update on some national data here to wrap things up first with our employment index… Note that it is approaching the warning zone following the inversion that occurred last November. Other commentators have noted that August and September have historically been months where data is revised to the upside but let’s wait and see before jumping the gun there. Cheng Wei-Chin who shares his fantastic ideas on Twitter says it ‘may be close’ to December when we see NFP near zero - highlighting a peak in job growth before we start seeing the labor market contract.
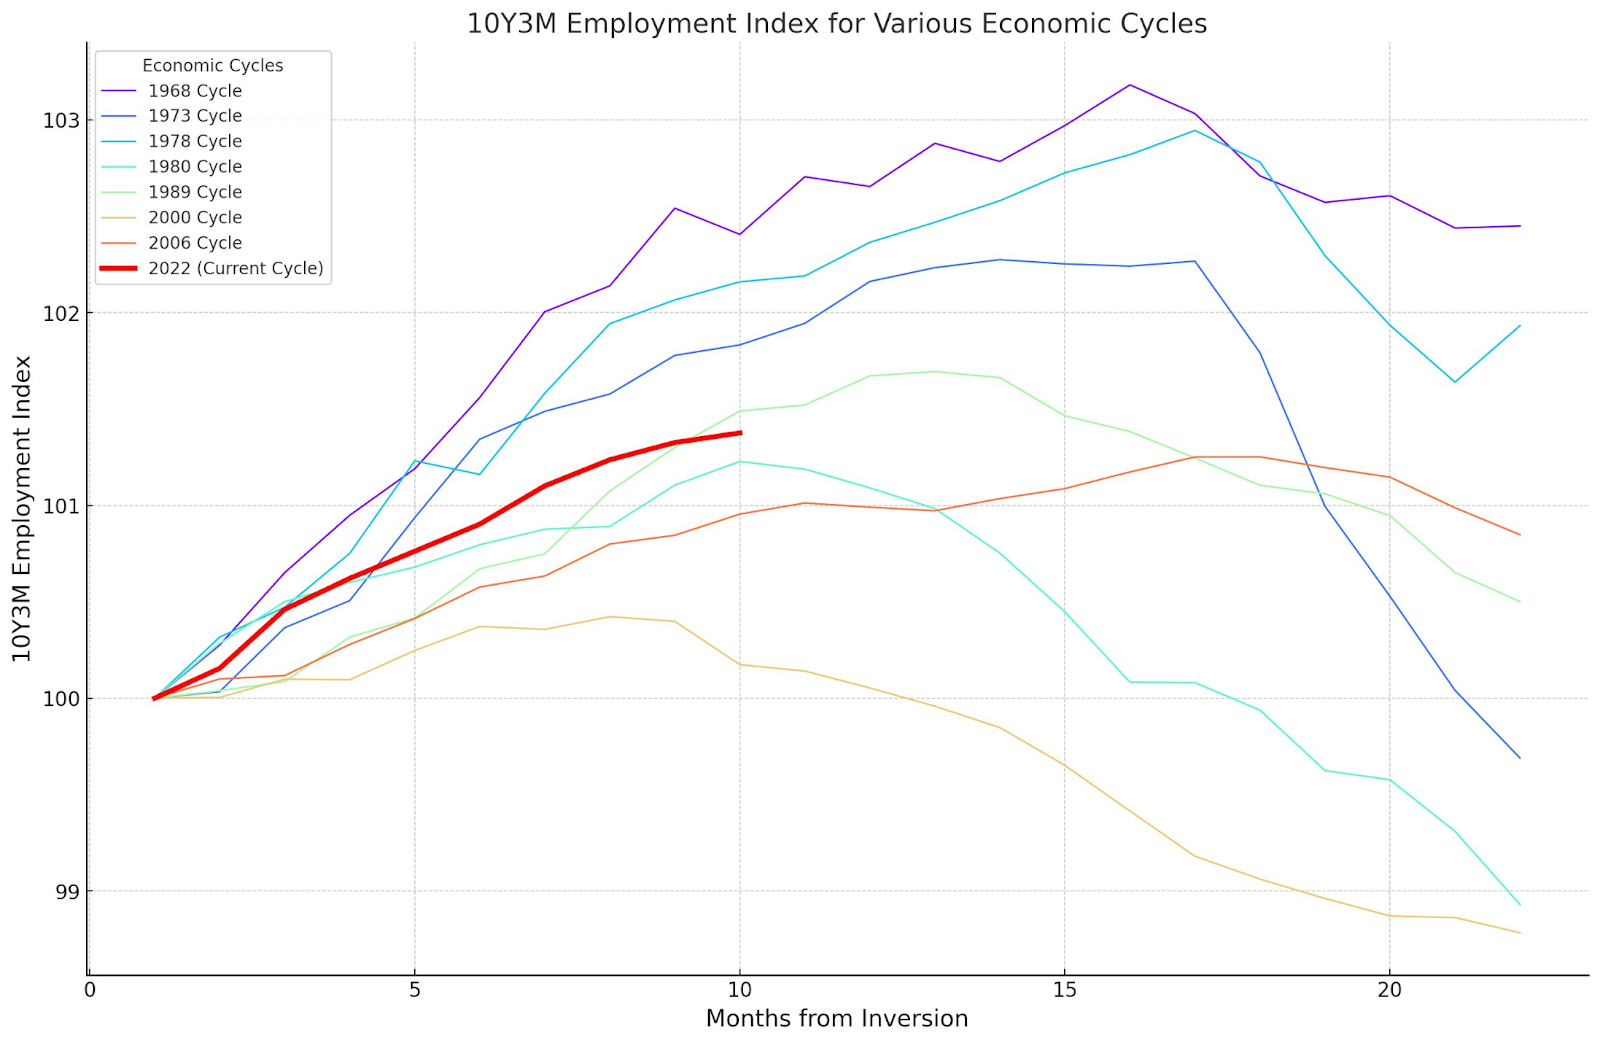
Here’s where we’re at in the context of all previous cycles:
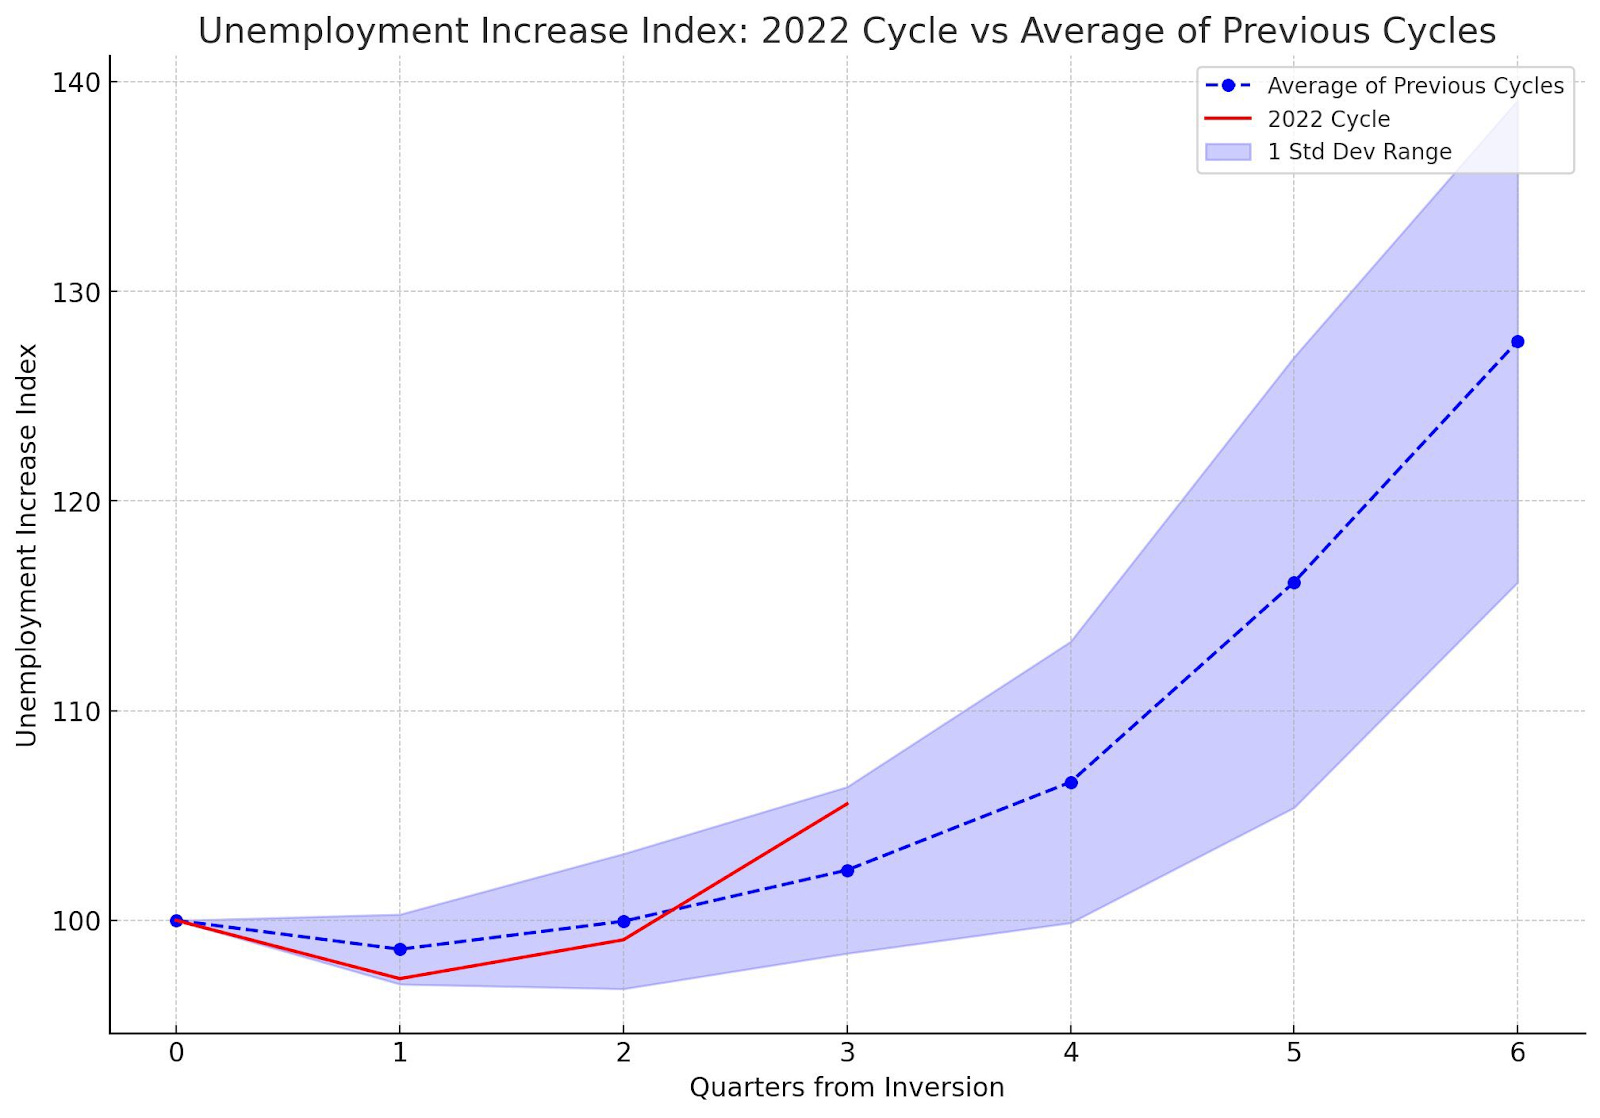
And unemployment index update given our latest 3.8% print:
Continue to watch yields in the weeks and month or so ahead along with rate hike expectations, jobs data, and more - and it should be a very interesting next 2 quarters that will paint us a much more clear picture on where the economy is heading. Right now we’re at the beach and the lifeguard has put out the red flag - but a whole lot of people are still swimming - the next quarter or two might see the whistle being blown and some more people waking up to a new reality in wintry waters. I wouldn’t put it all on red myself - like many of the soft landers have…
Has the Freight Market Recovery Begun? (@SquirtLagurtski, MacroEdge Contributor)
This week there was a glimmer of hope it seems at spot rates showed life. Volumes moved higher as multiple impacts were speculated from Hurricanes to holidays a grim summer has played out with capacity plentiful and demand showing a consumer on the back foot. Last week two southwest MI Mills went on shut down due to lack of orders. Shut Downs occur occasionally throughout the year, but both locations silent is a different story to some longer term employees. Corrugated papers used to make boxing materials for industries in every sector selling physical goods has made social media feeds multiple times this year as consumers face higher prices, higher interest rates, weaker purchasing power, and a host of other factors seen in other ways such as record high credit burden and a slowing economy.
Rising fuel costs has also played a role by tightening margins to maximize efficiency by carriers, labor disputes with larger companies leading to the most popular headline last month being UPS drivers and their new contract including $170,000 salaries (including benefits by the end of the contract term, and for over the road drivers mainly). The new contract settled long-running negotiations and worries of a potential strike looming over the industry.
Yellow Corp filing for bankruptcy also rippled through the spot rate markets boosting hope for the opening stages of a recovery though the added volumes from redirections have manly been absorbed and yet to show sustainability. This is all in a market where layoffs seem to continue with FedEx announcing just under 900 layoffs at two locations. Knight Swift, one of the United States largest carriers announced a poor outlook and reported weak financials as the industry battles to hold on to the talent widely picked up during the pandemic years. The recovery being sought in the freight market has yet to prove sustainability and in terms of outlook the opinion varies by media source. However until there’s a more clear direction appears the word recovery should be considered with more scrutiny and a lot of caution.
Albert Einstein once said, if you can't explain it simply, you don't understand it well enough.
This concept dates back at least to Sun Tzu's "The Art of War": if you know your enemy and know yourself, your victory will not stand in doubt.
The phrase carries on today in the expression: "ELI5" or for those who read in traditional English: "Explain it like I'm 5".
As Aesop's Fables are parables of behavior, so too are the poems of the Renaissance. Today, I want to share with you a story of the rate of change as compared to the overall effect.
While having been attributed to both Benjamin Franklin and yet before, William Shakespeare, a poem, a fable, and an ELI5. First the poem and it's lesson:
For Want of a Nail
For want of a nail the shoe was lost.
For want of a shoe the horse was lost.
For want of a horse the rider was lost.
For want of a rider the message was lost.
For want of a message the battle was lost.
For want of a battle the kingdom was lost.
And all for the want of a horseshoe nail.
The moral of the story, is to both pay attention to the details, and teach us about chains of events, or how all things are connected. We can see the rate of change visible through the first 4 lines. Losing a nail caused the shoe to be lost. The shoe would come undone fairly quickly after. And once the horse can’t continue, the immediate impact is the rider couldn’t possibly match the velocity of the horse to deliver the message. With each line of the stanza, the rate of change slows between cause and effect. The loss of the kingdom, is viewed as the final effect. The end of the chain, the last connection. The overall implication of the rates of change in loss.
The lesson: plan accordingly and be prepared. If there were value in having additional nails, and shoes, or having an alternate plan of delivery, perhaps the chain of events would unfold differently.
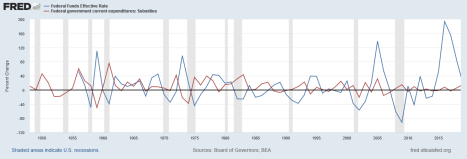
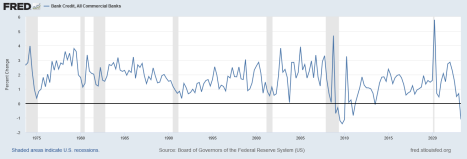
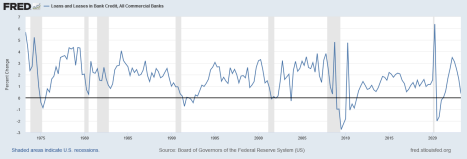
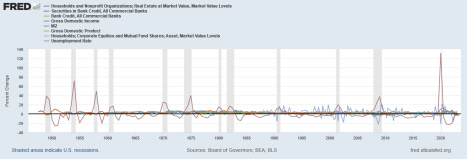
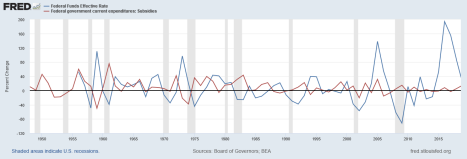
I point this out because we’re at the precipice of yet another economic recession. And there are two constants throughout business cycles starts and ends throughout the last 60 years. Those two items are Government subsidies and the Federal Funds Effective Rate of interest.
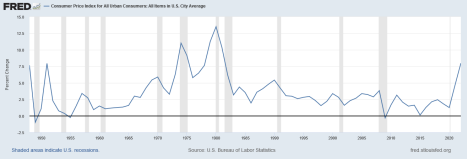
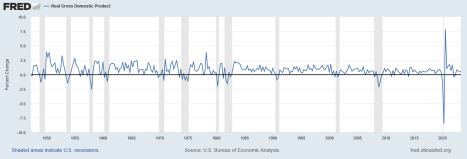
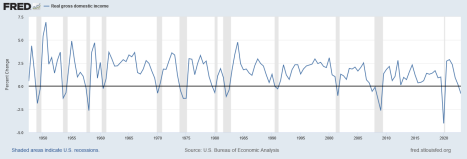
This chart is the rate of change of those two items. What we’re looking at, is the ongoing battle between the rate of increases of subsidies, and the FF effective rate. These subsidies come in every form. In fact this chart doesn’t even take into account state/municipal subsidies and tax benefits. For every subsidy rate increase, there’s a corresponding federal funds effective rate increase, to curtail the “bubbly” effects of irrational exuberance, a tool to prevent the potential hyperinflationary pressures they set off. See the CPI to correlate:
I’m no puritan, I understand how subsidies can be beneficial to us as American citizens. In fact, I can even evaluate them. On an investment/return or expense/public benefit analysis. But there’s also something else that keeps being a constant: Politicians spending tax dollars to subsidize industries and shore up “votes” and political “capital”. And it isn’t just a Right or Left “wing” tactic. To illustrate, we now have what the current administration calls” Bidenomics”. Their term not mine. We literally already had “Reaganomics” and everyone knows it by its more appropriate name, to which both iterations are:
“Voodoo Economics”
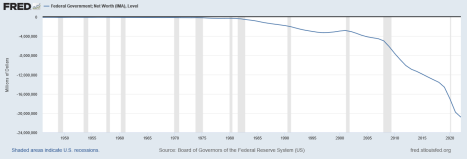
Both parties are guilty of this. And while we’ve just reviewed the rate of change, I’m sure you also know where we stand as far as the Federal Budget Deficit, and National Debt. The “overall effect”.
Now to put it simply, allow me to tell you a poem:
For want of a dollar
A deposit was lost.
For want of a deposit, equity was lost
For want of equity, credit was lost
For want of credit, a loan was lost
For want of a loan, a product was lost
For want of a product, income was lost
For want of income, a job was lost
For want of a job, government intervention was clamored for
For want of government intervention, a nation was lost
And all for the want of a dollar.
Hotel Stagflation (@GregCrennan, MacroEdge Contributor)
In an uncanny alignment with the classic song "Hotel California" by The Eagles, current state of stagflation in the US draws haunting parallels to the song's evocative themes. Just as the song paints a vivid picture of a place where departure proves elusive, our reality seems caught in a time of extremes, with the US government grappling with trillion-dollar deficits about to be $1.6 Trillion in 2023 and relentless inflation 4.3%.
Much like the hotel guests in the song who can check out but never truly leave, today's fiscal landscape presents us with a government entrapped in a never-ending cycle of trillion-dollar deficits. Refusing to address the core issues at hand, they sidestep the necessary measures of reducing spending and raising taxes on voters. Instead, they've chosen the path of printing money, shifting blame to external factors such as greed, corporations, and geopolitical tensions, all the while avoiding accountability for their choices.
This financial problem has left our economy mired in a state of constant elevated inflation, averaging at around 5% since 2020. The question arises: Can we break free from this economic cycle? Just as the song cautions "You can check out any time you like, but you can never leave," the government's fiscal predicament appears to be an inescapable loop, exemplified by the looming eye-opening deficit of $1.61 trillion this fiscal year, up from the previous year's $1.38 trillion.
With each budget cycle that passes without substantial decisions on spending cuts and tax adjustments, the fiscal abyss deepens, and inflationary pressures intensify. Core inflation remains steadfast at 4% and higher, a testament to the lack of action taken to rectify the root issues. Few voices have warned against the risks of sustained trillion-dollar deficits, but the absence of immediate repercussions and the allure of maintaining popular social programs have provided justification for a perilous course of action.
Just as The Eagles' lyrics describe a facade of luxury that transforms into a nightmarish trap, our economy grapples with the fallout of prolonged fiscal imbalances. The influx of money into the system, devoid of strategic management, has driven prices skyward, particularly in essential areas like food, which has soared to 21% since 2020, echoing the sentiment of the song where “they gathered for the feast, they stab it with their steely knives, but they just can’t kill the beast”.
The absence of a balanced fiscal approach, one that encompasses targeted spending cuts and responsible tax adjustments, underscores a government ensnared by the fear of voter backlash and political convenience. As we traverse this intricate economic labyrinth, the likeness to "Hotel California" becomes increasingly poignant, suggesting that we've become prisoners of our own choices.
Thanks for reading MacroEdge! Subscribe for free to receive new posts and support our work.
As we strive to liberate ourselves from the clutches of trillion-dollar deficits and higher inflation, the urgency of navigating the intricate terrain of the political landscape becomes all the more apparent, even though progress in that direction remains elusive. The reverberations of the song's warning, "Running for the door… Relax said the night man, we are programmed to receive, you can check out anytime you like, but you can never leave," serve as an emphatic reminder that our comprehension of the issue notwithstanding, the government's inability to effectively tackle it locks us in the unending cycle of inflation—a challenging reality we must confront. As we reflect upon the situation, we're left to ponder asking ourselves whether “This could be Heaven or this could be Hell.”