
9/10 Weekly Report: The Labor Lag, Leading Indicators, Risk-Off Cocktail Recipe, Housing Inventory, and a Blast from the Past...
In this weekly report - Don, Six, Awsumb, and John take on the lagging nature of labor market data, the current market, housing inventory, leading indicators, and more...

9/10 MacroEdge Weekly Release
@DonMiami3, MacroEdge Chief Economist
@SixFinance, MacroEdge Head of Research
@MrAwsumb, MacroEdge Contributor
@RealJohnGaltFla, MacroEdge Contributor
Weekly Data Dive and the Labor Lag (@DonMiami3, Chief Economist)
It’s been a rocky week riding with the top down (seriously) - send some fall weather my way folks. Hope you all had a great Labor Day weekend last weekend and enjoyed the delayed Monday release. Much in store on our data platform - the team got our first glimpse from the dev team and things are looking fantastic. The full dashboard will have 70-90 different interactive data points - including our own labor index calculations, city-by-city data, and more. Very excited to continue watching the progress of the platform and share it all with you in the next month or so. We also have a great lineup for both this weekend and next on the contributor side so I hope you enjoy!
Our job cuts tracker has tracked 8,170 job cut announcements thus far in September - expecting more to be announced through the remainder of September. My focus today will be concise but very chart-heavy as I wanted to focus particularly on the extreme labor lag, housing and housing construction, euphoria in Vegas, and a few other quick items.
I’ll kick us off this weekend with a chart I crafted while watching some Saturday College Football focusing on the labor lag… Many on Twitter continue to mention that the bear case is dead and the Fed has already achieved a 94/19 style ‘soft-landing’ - I disagree sharply on this point. On the graph I crafted below - you can view the 2006 continuing jobless claims index for Vegas and articles released during that time period highlighting how rosy things were during this time period:
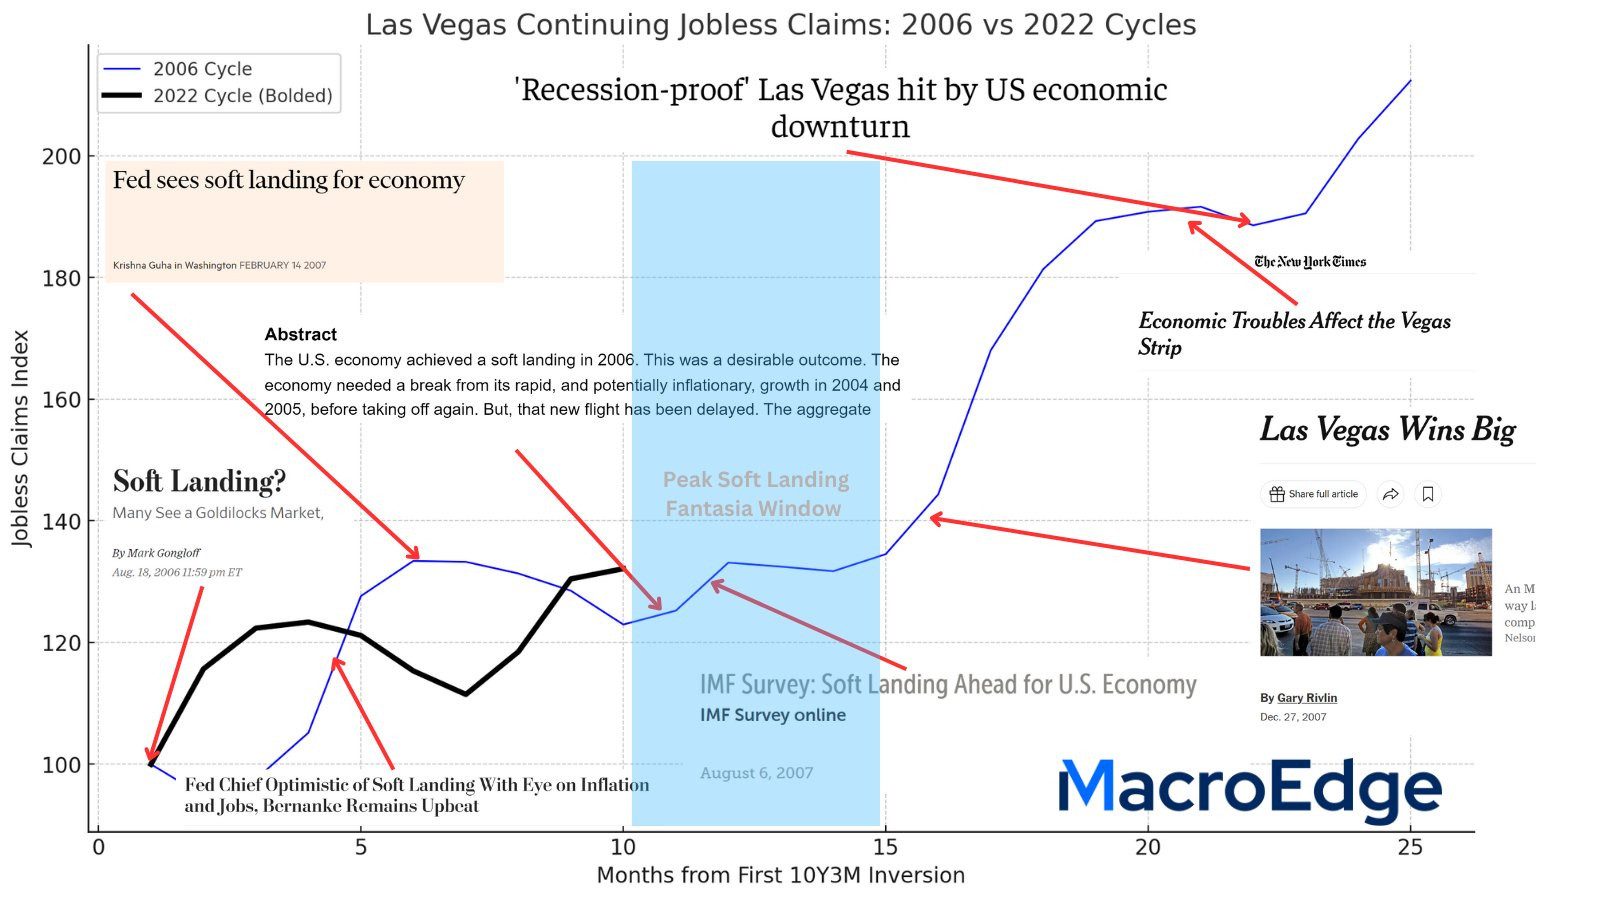
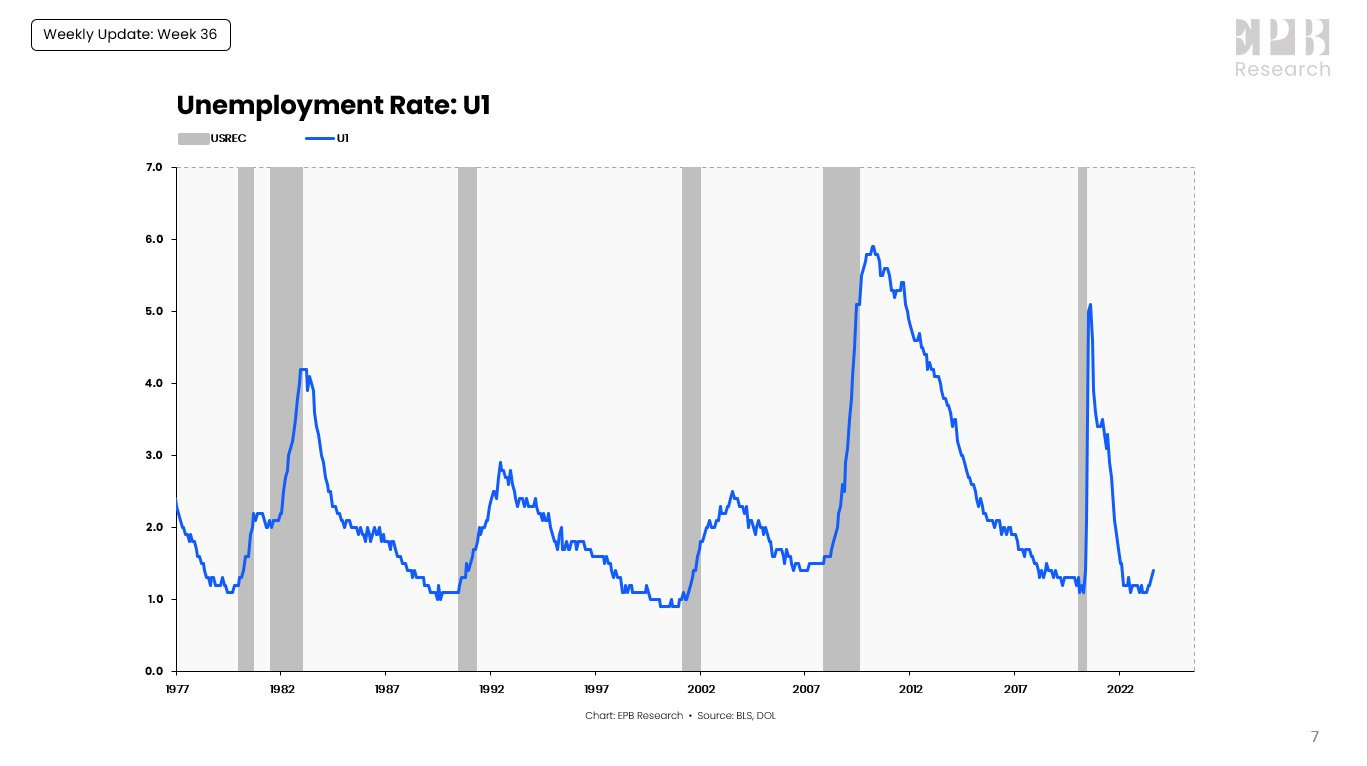
One of the most shocking is the “Las Vegas Wins Big” which was released just 3.5 months before “Recession-Proof Las Vegas hit by US economic downturn” - highlighting how public sentiment about a recession doesn’t really flip until the labor component flips. While this data focuses particularly on claims - claims (both initial and continuing) have remained elevated to historical pre-recessionary cycle levels even though they have cooled off in recent weeks. If you break it down to city by city levels - you can find places like Las Vegas where claims are continuing to track higher, and states like CA where unemployment is up sharply off of the bottom. Eric of EPB Research mentioned the U-1 unemployment rate (>15 weeks) which is another strong indicator of the softening labor market…
You can couple this with a number of different features like the Glassdoor employee survey highlighting plummeting employee sentiment about the condition their employer is in (and many others). During the highlighted period on the chart (the peak soft landing window) ranging from now (10.5 months from inversion) to approx 15 months from inversion we may see claims tick up slowly or even flatline. The sound from soft landers will become deafening as they claim victory - as they did in 2006, 2000, and many other times.
Las Vegas - one of the seven cities I have in the ‘bellwether city’ index that we are developing - continues to track pre-recessionary in claims:
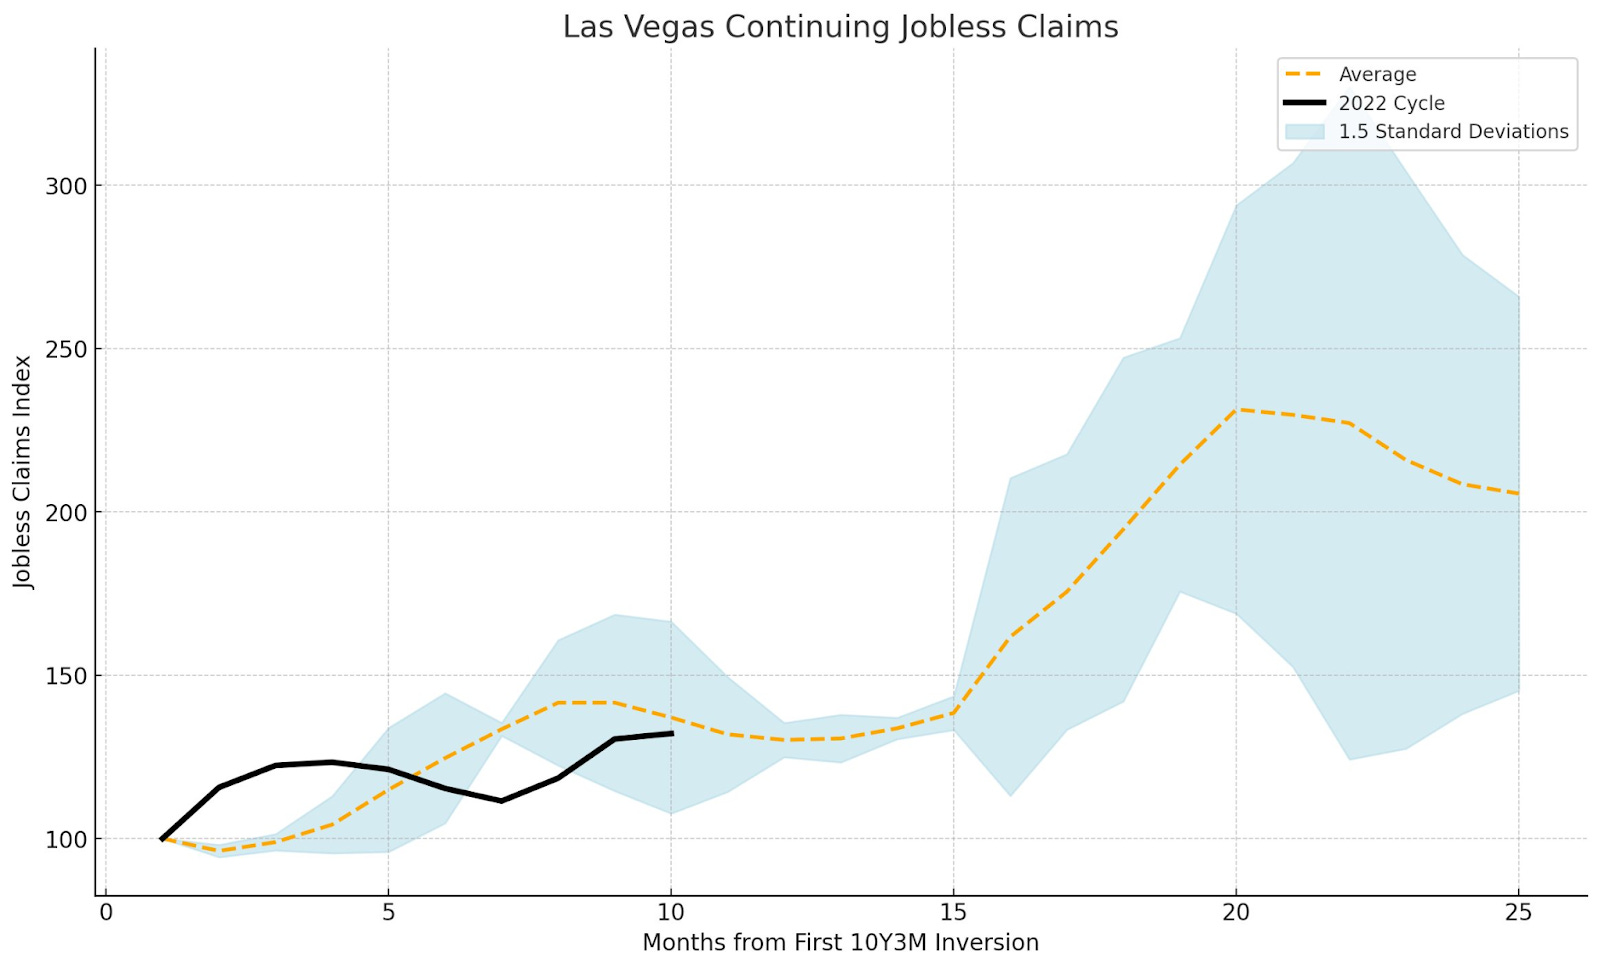
The trend is inevitably up from here, historically, if other elements continue to point towards recession. Labor is just slow, slow, slow and I can’t emphasize that enough. Sentiment changes when labor breaks.
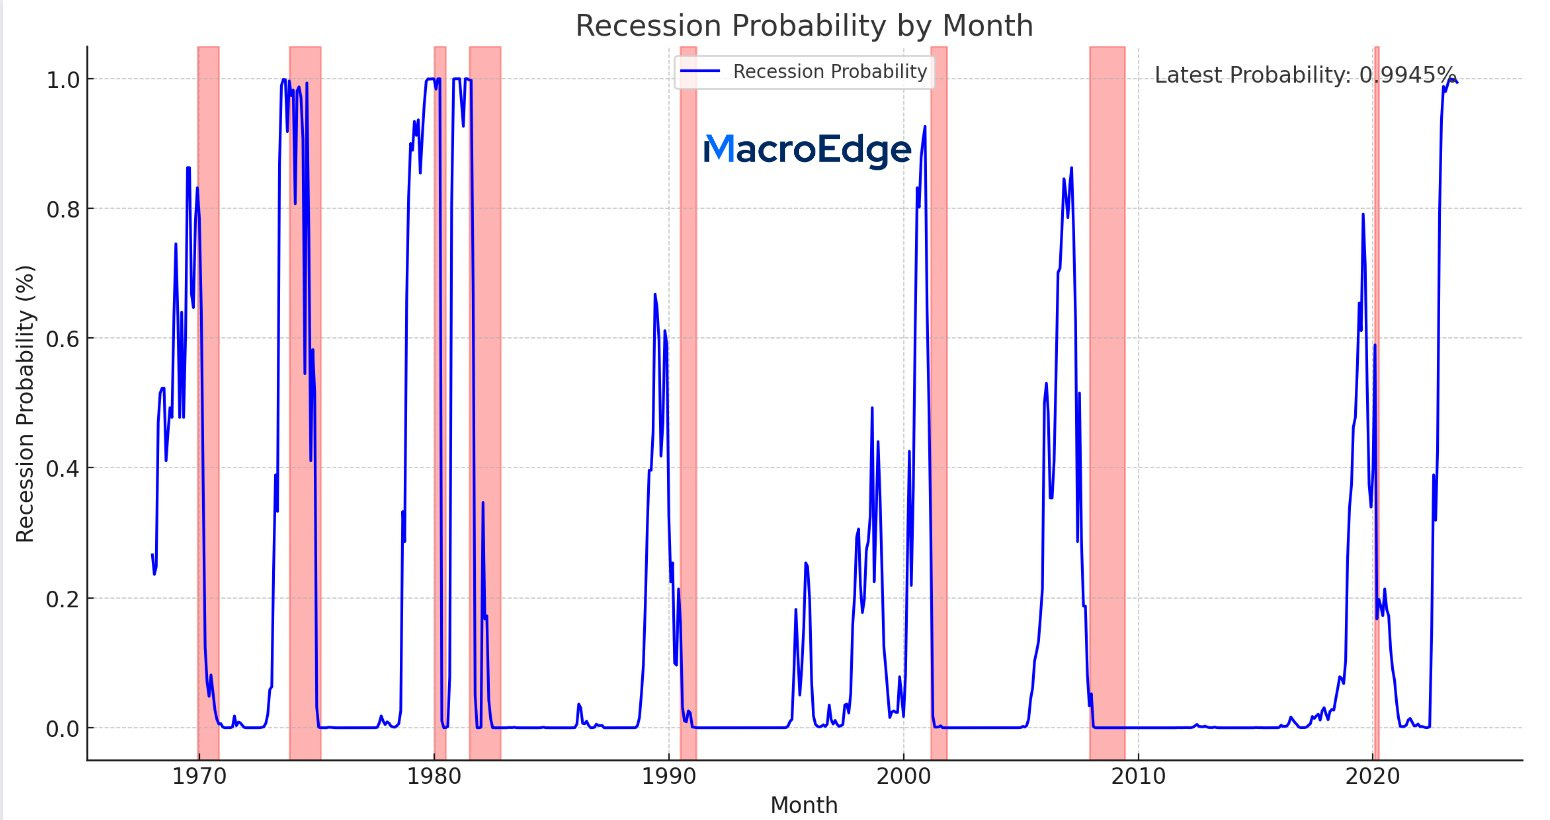
Regarding market upside - the market historically has had about a 1 month lead time on anticipating the drawdown, which is why I continue to struggle to see much upside from here:
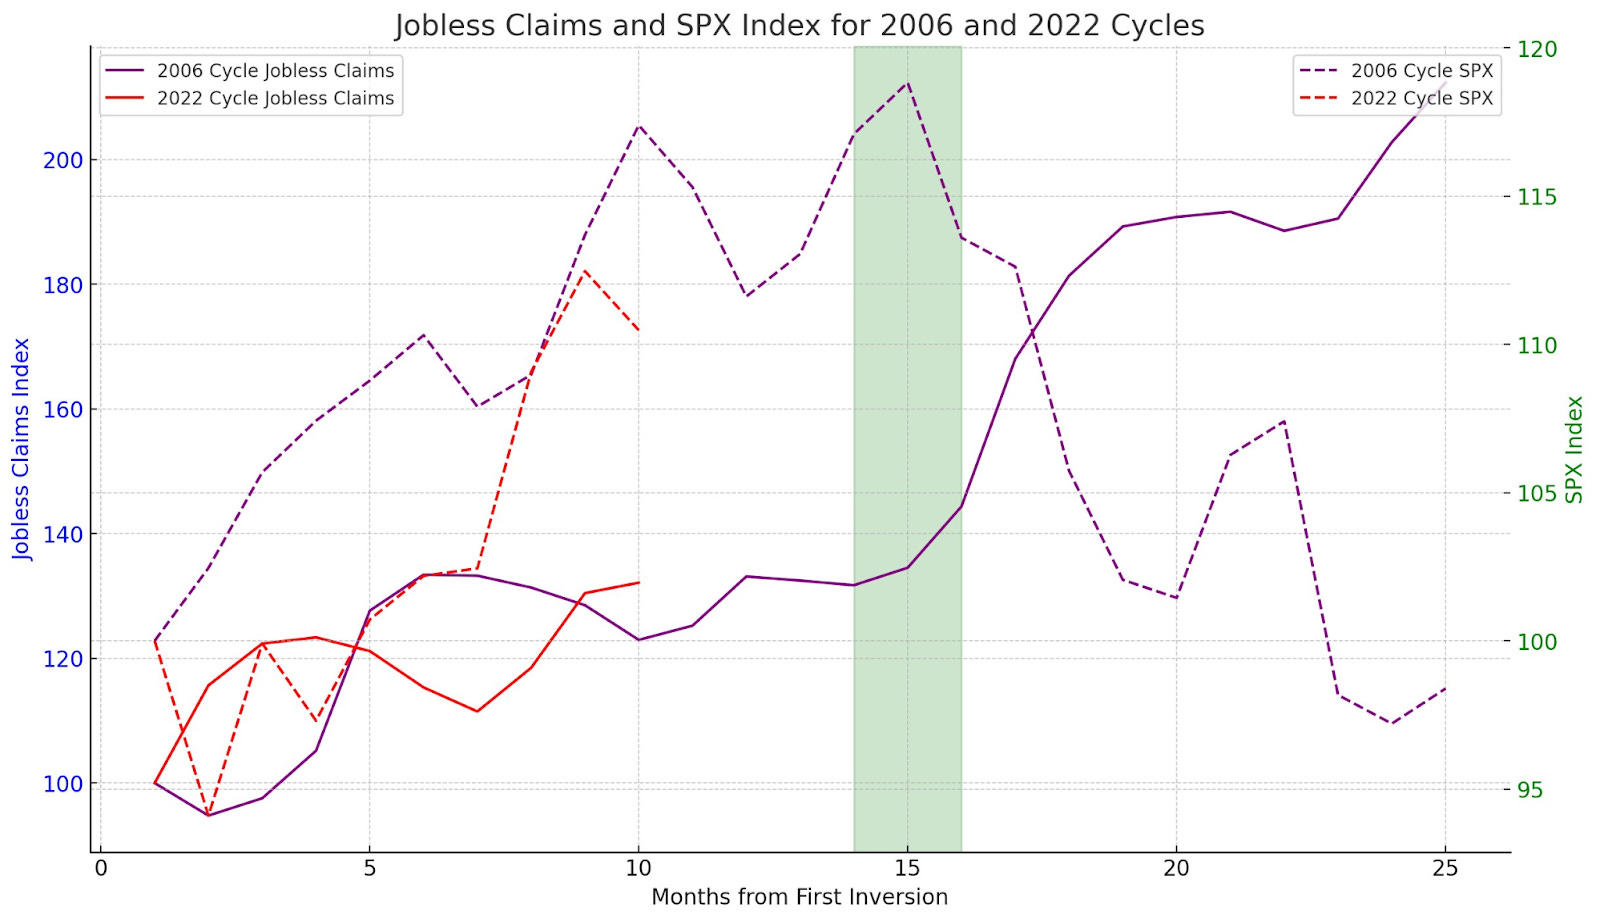
This chart compares the current cycle in Nevada jobless claims to the 2006 cycle - and you can see the green window is where the market topped AND where claims began their long climb upwards as unemployment shot higher. If history were to rhyme (as I expect it often does) - this period of time is only a few months away. Of note - I do think it was interesting we got a much earlier spike in continuing claims in times past, so whether or not this cycle is really ‘accelerated’ or not remains to be seen, although I am not in this camp. Currently, at 10.5 months past inversion - we can expect a longer recession in nature (>9 mo’s) using the 10y3m curve as our guide.
Regarding S&P 500 (SPX) upside - while the Nasdaq has blown everyone away as an outperformer - things like small caps and equal-weight SPX have lagged sharply. Comparing the current cycle to the cycles of 00/06-08 - you can see how little historical upside remains on SPX using those as our guide:
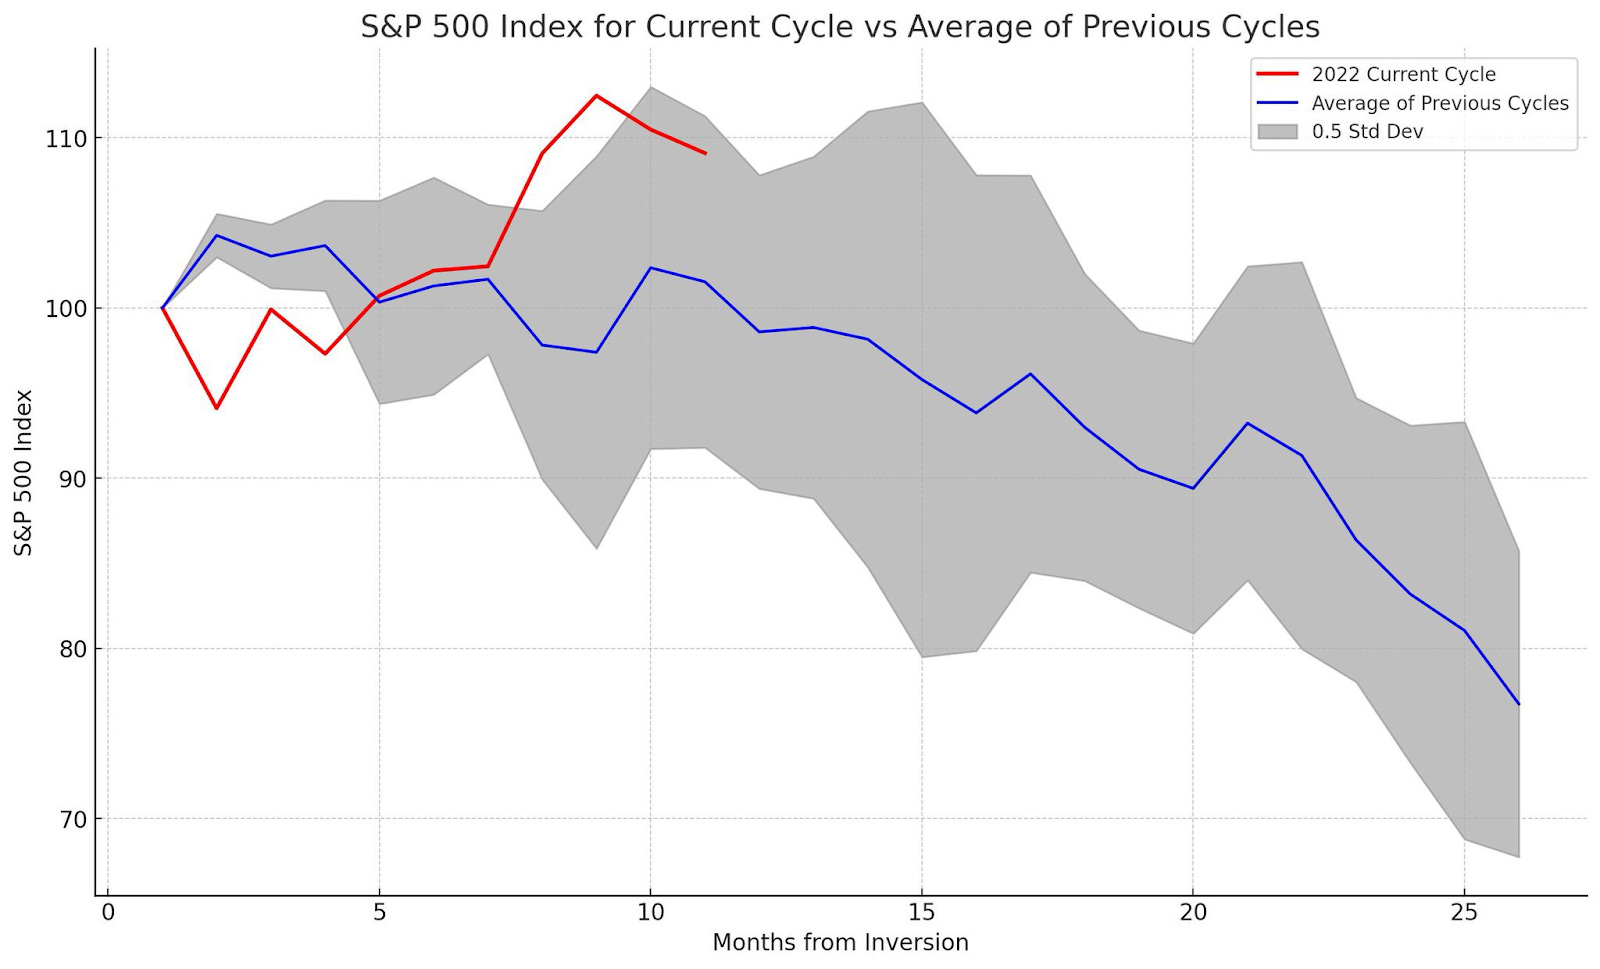
History would tell us a few percent to the upside at most after the face-ripping rally in H2 of this year… unless of course this time ends up being different (very unlikely:)
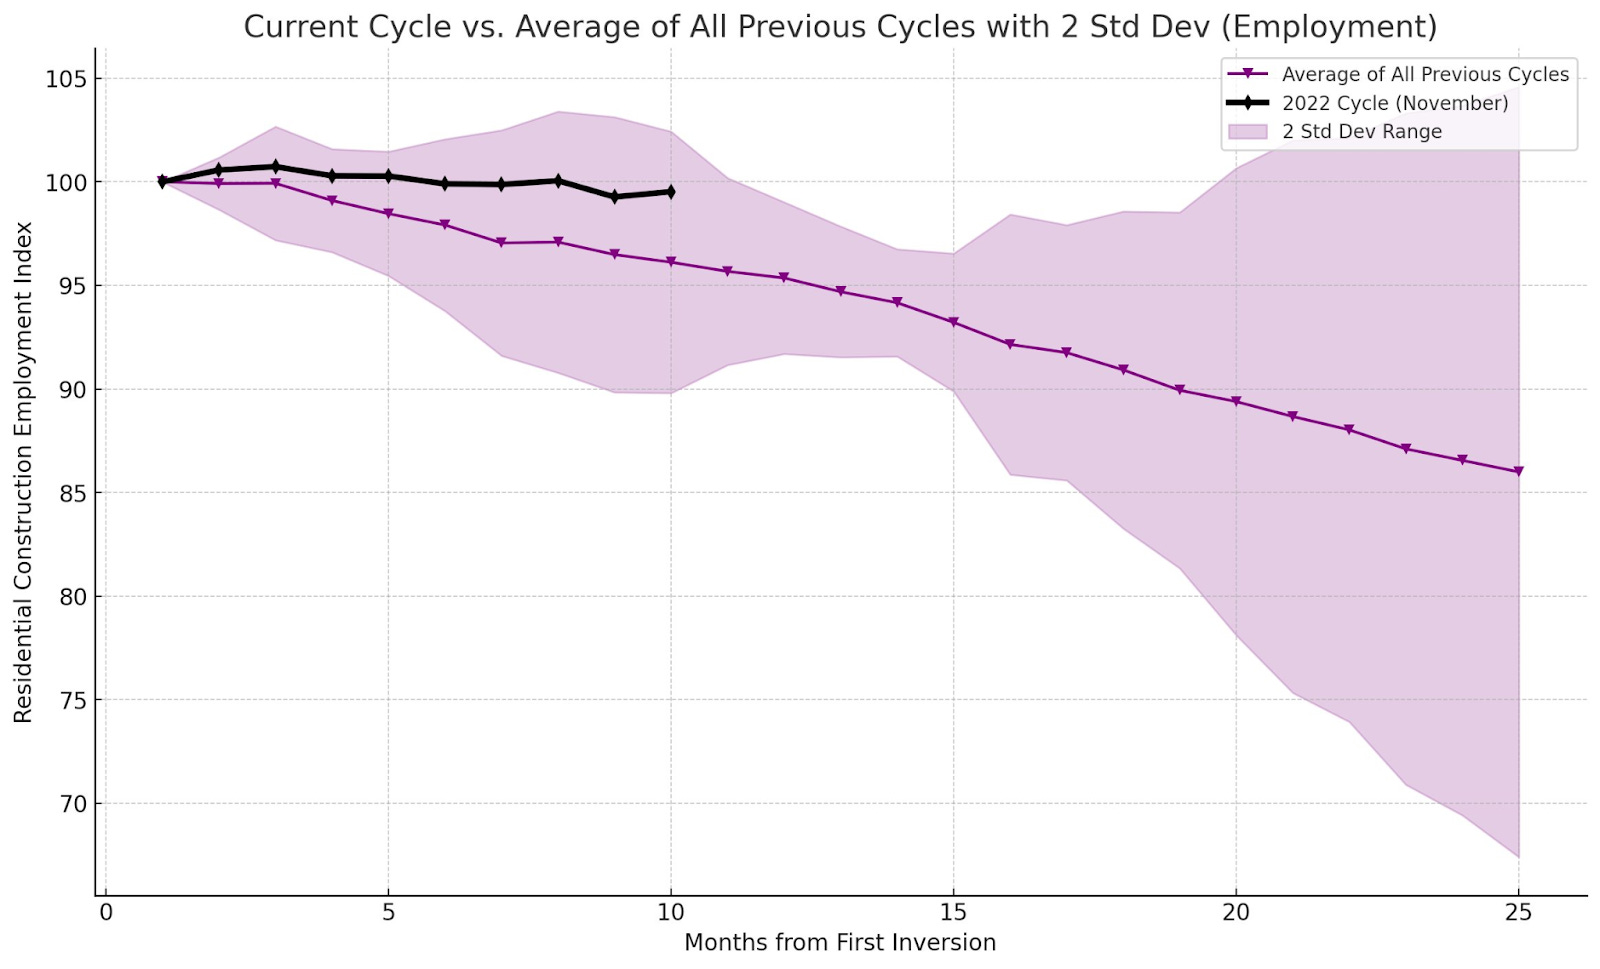
As we approach my defined hard landing window (original post July 2022 pinned on my X) - I am focusing on several key leading indicators outside of many I’ve discussed in previous weeks: heavy truck sales, single-family home construction (a core element of driving claims higher when housing employment rolls over), and the residential construction employment index (speaks to the last point).
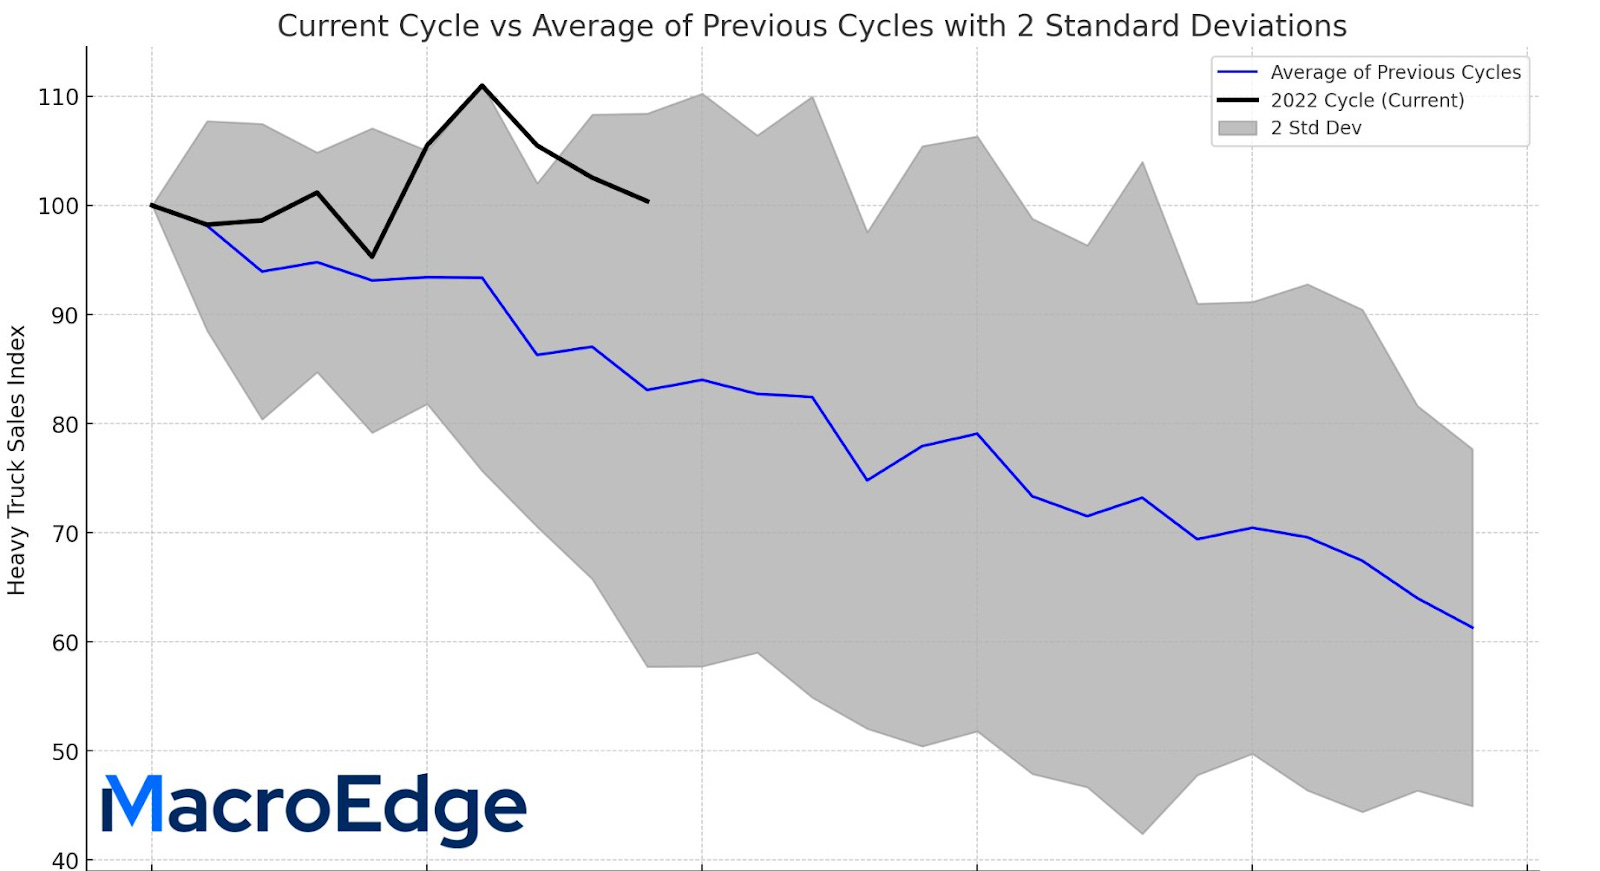
Heavy truck sales remain resilient… for now:
Expecting this begins to fall sharply into the winter. Declining slower than usual but within 2 standard deviations of previous cycles:
On new single-family residential construction - we are witnessing a very sharp slowdown… on pace with declines seen in 73 & 06/07:
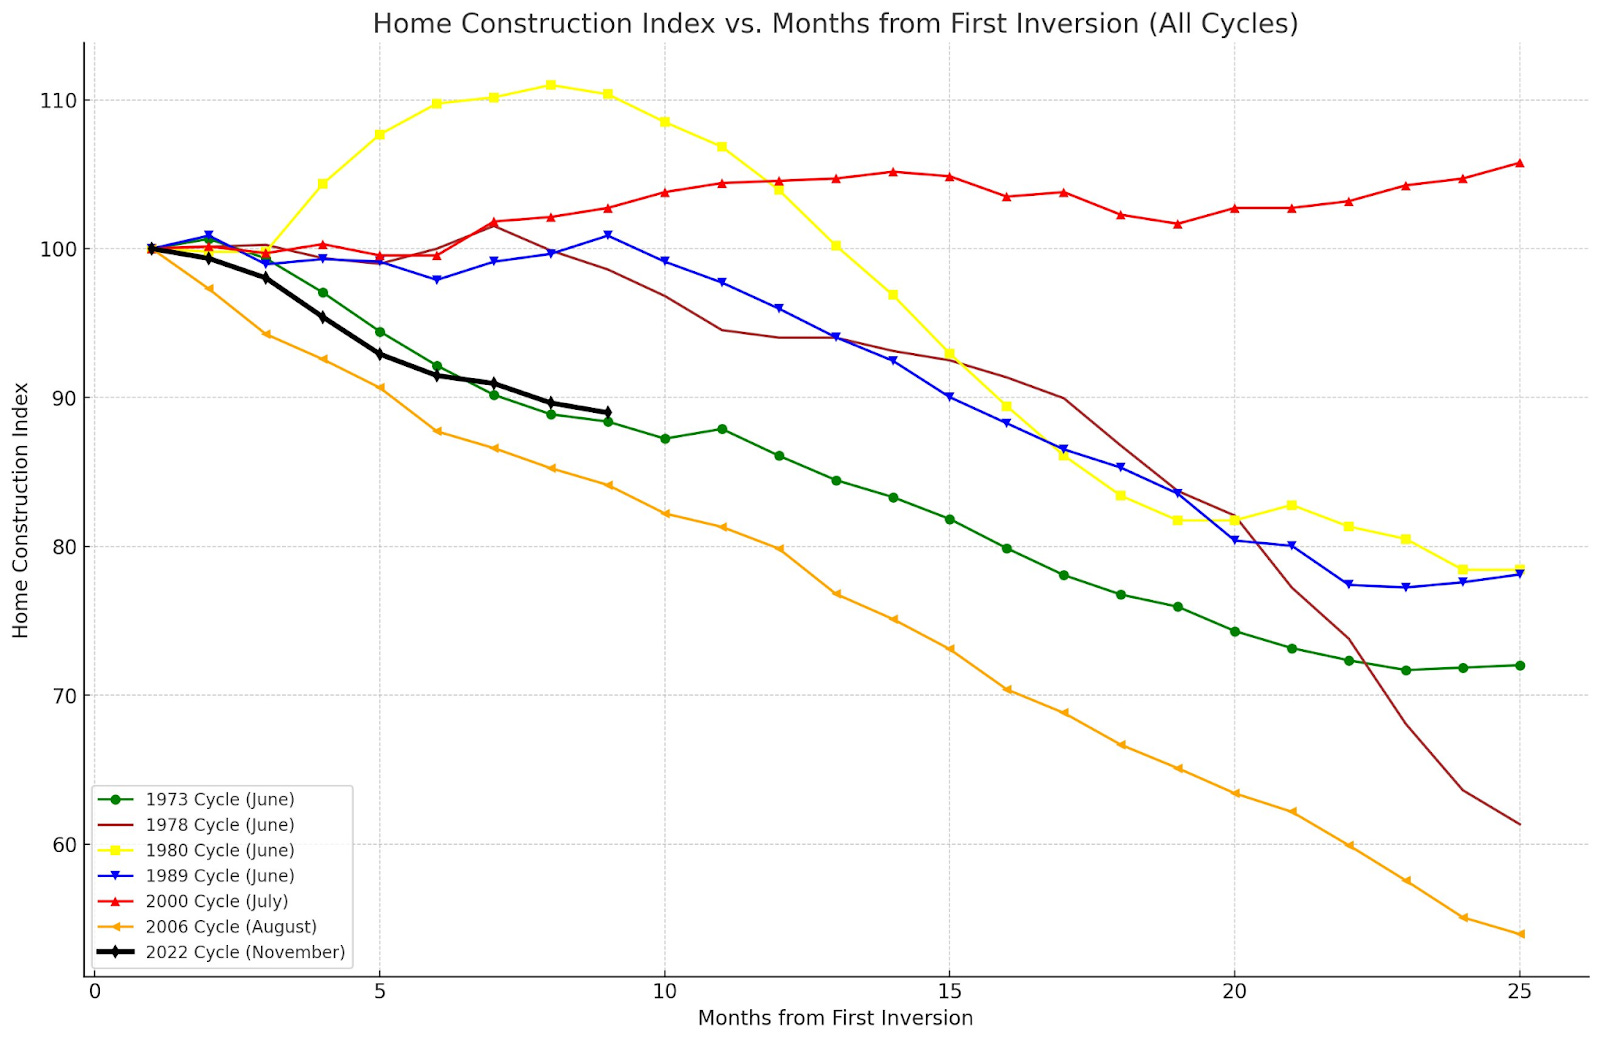
This total figure (including single and multi-family construction) has kept construction employment elevated, although once the ball really gets rolling with single-family, I anticipate multi-family construction employment to follow once things slow down from the astronomical units under construction on that front). Unlikely we’ve seen the extent of any employment decline on the residential construction front:
Hope the charts are helpful at gauging where we’re at in this cycle relative to times of past and even with all this talk of an I Can’t Believe it’s not Butter ‘soft landing’ - it’s still looking quite like the opposite.
Don’t forget - labor lags & so does sentiment.
Enjoy the rest of the read!
Don
Equities Risk off Cocktail (@SixFinance, Head of Research)
"Every time oil is up, interest rates are up, and the dollar is up, things don't tend to go well." - Stanley Druckenmiller
This morning (9/10/2023), Nick Timiraos, the widely regarded mouthpiece of the Fed, published an article titled "An Important Shift in Fed Officials' Rate Stance Is Under Way." If the content in this article is once again indicative of Fed actions to come, as has been the trend for some time now, a September pause appears to be the path forward. Welcome timing too for markets. The dollar index (DXY) has breached 105 to the upside, and the trend is strong. Crude futures surged over the last few weeks to a new yearly high after Saudi Arabia announced production cuts to extend through the end of the year. Bonds continue their sell-off, with the 10-Year US Treasury Yield (fixed income benchmark) ramping again, with the 10-year at 425 basis points. These three price indicators all accelerating together are extremely bearish for risk assets. Given the macro implications of this cocktail, the Fed is put in a tough spot, especially with oil accelerating substantially.
The Bank Term Funding Program (BTFP) continues to make fresh all-time highs as borrowing at Fed Funds +10 bps for banks parking underwater fixed income products as collateral in exchange for loans at par value increases. Many regional and small banks are deeply underwater on the fixed income products that they purchased during the historic secular bond bull market at historically obscenely low yields. I wouldn't touch regional bank stocks with a 10-foot pole right now, and I certainly wouldn't park more than FDIC insured limits with them. Many regional banks are offering very high CD rates right now, and they're being forced to go far out on the risk curve to keep their income statements in the black.
The "magnificent 7" trade continues to hold up equities markets and collectively trades around 60x free cash flow as a collective. I look for this trade to unwind soon, as in Apple, we have already seen a price correction as China bans Apple phone use for government officials. Once Nvidia's valuation returns to reality, we should see a correction in greater equities as well.
Everyone and their mother is betting on a soft landing and seems to disregard the known long and variable lag of monetary policy. It's important to remember that historically, the conditions we are seeing right now have never once resulted in said soft landing. An economy that was propped up by trillions in Quantitative Easing that is now done with is unlikely to do very well absent said easing. Student loans just came back online on September 1st, excess savings are nearly entirely gone, and credit usage is exploding. Recession is still my base case, with said recession coming much sooner than later if yields, the dollar, and oil prices remain high.
On Homebuilders and Buffet (@MrAwsumb)
"It’s been said that the simpler something is, the more perfect it becomes. I think that way about focus. In Real Estate, the simpler it is, the better it works. There’s a lot of terms that get thrown out there that are relatively useless.
With the recent industry focus on the lack of inventory, and new homes being the only “game” in the residential space, I got to thinking, there’s a lot of terms being thrown about that are relatively useless. I decided to make life simple and look at the data that is publicly available and see for myself what’s really going on in the market.
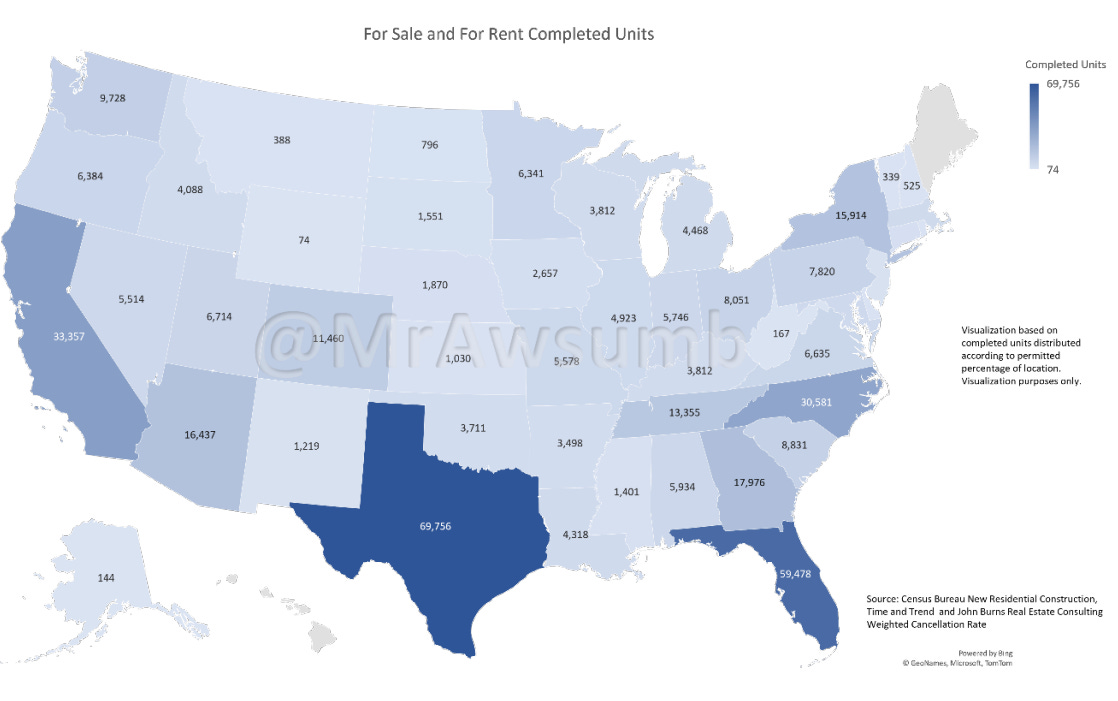
This is a map I created using Census Bureau data as of August 2023. This is an accurate depiction of all 793,271 authorized housing permits in the United States.
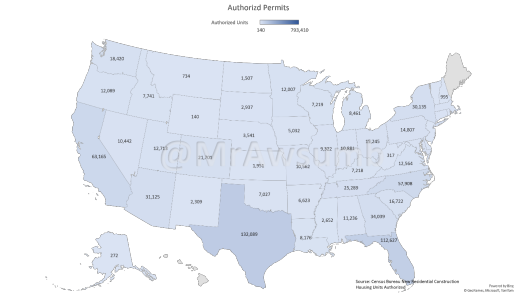
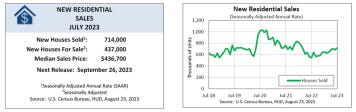
Of those, as of July, 437,000 of those permits were “For Sale” builds according to the most recent Census Bureau New Construction Survey. Now, what if we wanted to evaluate how publicly traded homebuilders are doing? Fortunately for us, The Census also tracks construction starts, completions, and sales.
In fact, I graphed those for us too. Take a look:
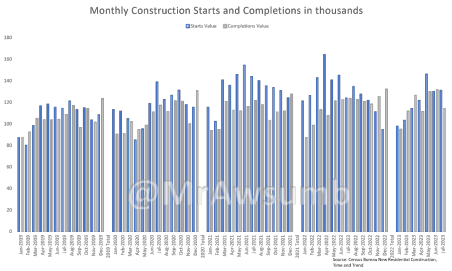
Notice we’re starting and completing well over the sales rate on a monthly basis? It gets more interesting once we consider that the census doesn’t track cancellations. That’s right, they only track reported sales. [Link: https://www.census.gov/construction/pdf/nrs_cancellations.pdf]
Fortunately, John Burns Real Estate Consulting does track such things:
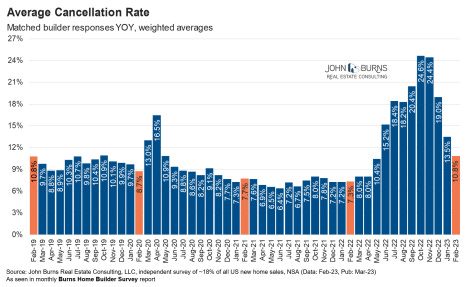
When I applied these cancellation rates from January of 2022 through February of 2023, and used a very modest 7% cancellation rate for March through July 2023, we get this:
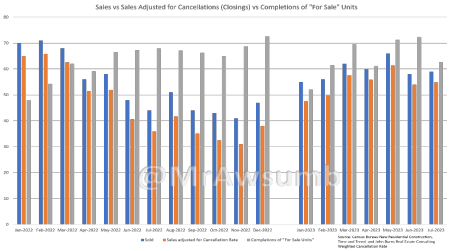
An accurate “Closings” picture. This then allowed me to correlate the rate of completions to the closings to see what became inventory. See here:
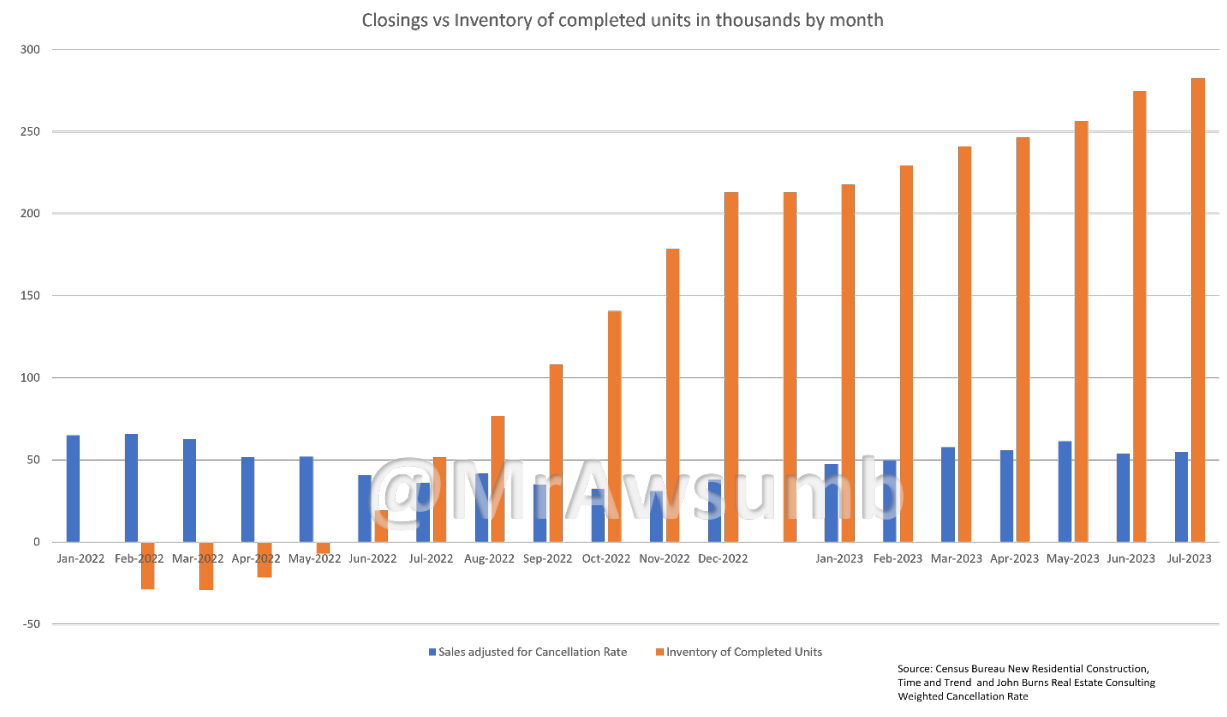
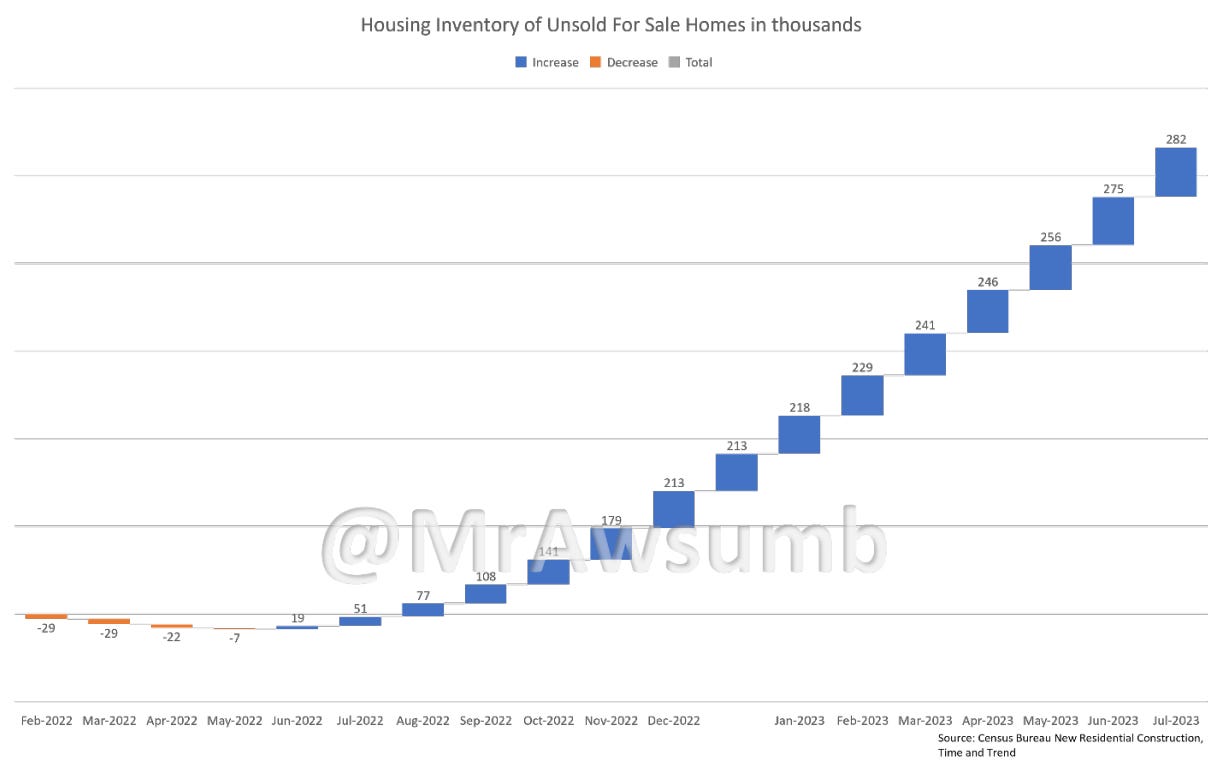
Since the second quarter of 2022, inventory has been stockpiled. Here again is the inventory of completed for sale units on a month-by-month basis:
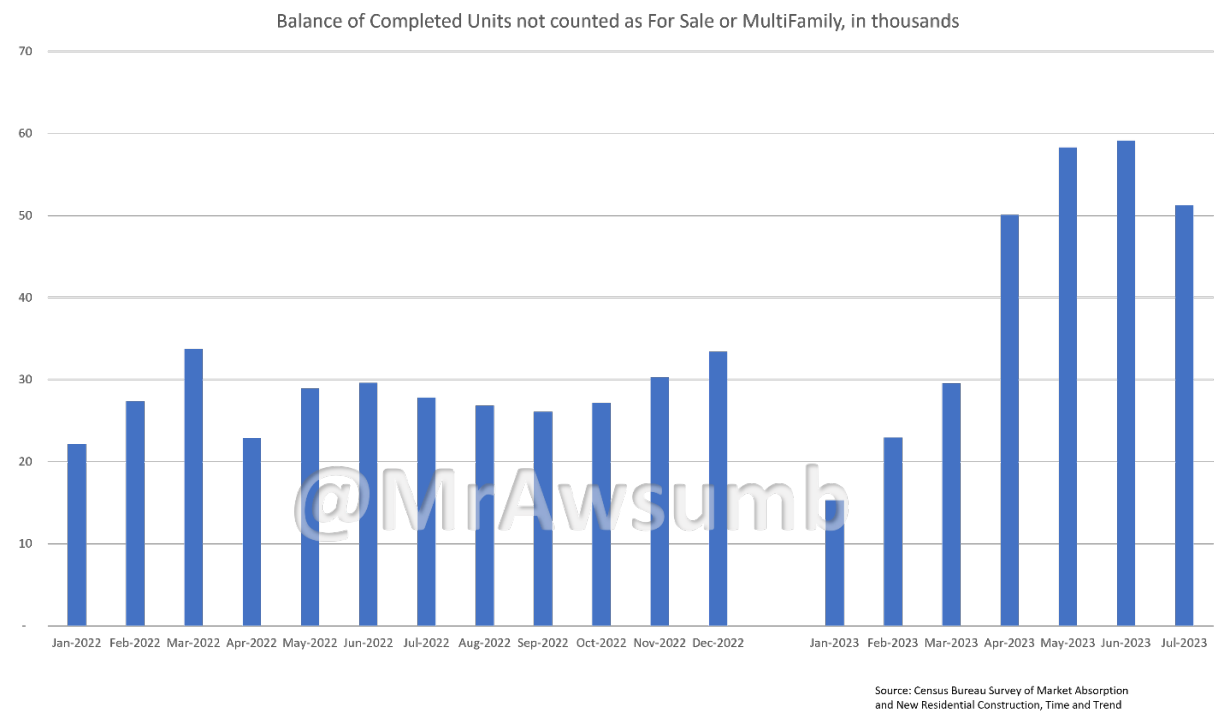
I took the same data regarding completions, but this time used Census Bureau SOMA (survey on market absorption for Multifamily Apartments) and we get the following inventory build in multifamily.
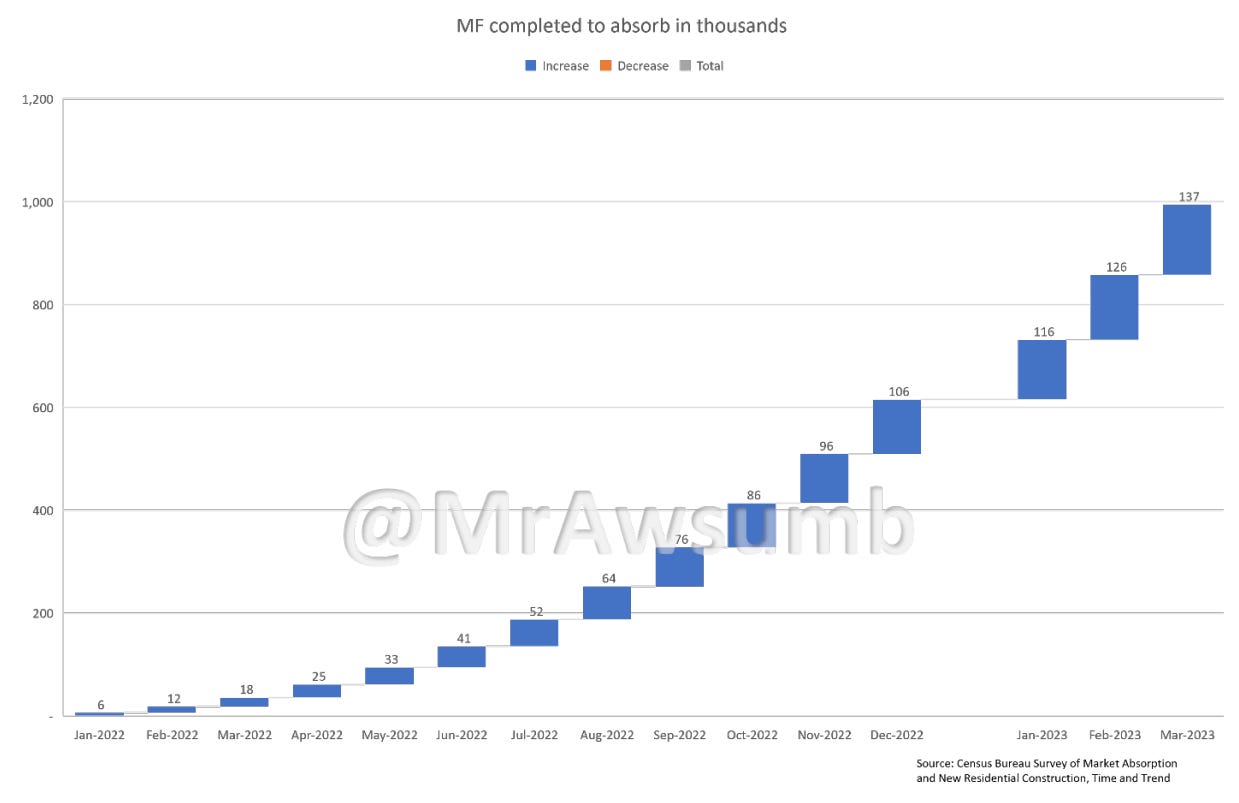
These two account for all but 627,000 completed units/unsold/unabsorbed in that same time period.
Given this statement from Dana Hamilton, head of real estate at Premium Partners, in an article for Builder Online in 2021, I think I know what those completions are used for:
“There is a fundamental mismatch between increasing demand for affordable, single-family homes and new supply,” says Dana Hamilton, head of real estate at New York–based Pretium Partners, a single-family rental operator that, along with Ares Management, recently acquired single-family rental REIT Front Yard in a $2.4 billion deal to grow its portfolio to 55,000 units. The company says 5% of its portfolio now comprises build-to-rent homes. “BTR is one of the ways that the market is responding to increased demand for single-family rentals.” - Via BuilderOnline.com
With homebuilder earnings coming up, I think this is important information to know given the fact that there’s a ramping of inventory on top of the pressure of continued buying down of rates.
I used BuilderOnline’s Top 100 builders from last year to get a sense of where these may land equally distributed:
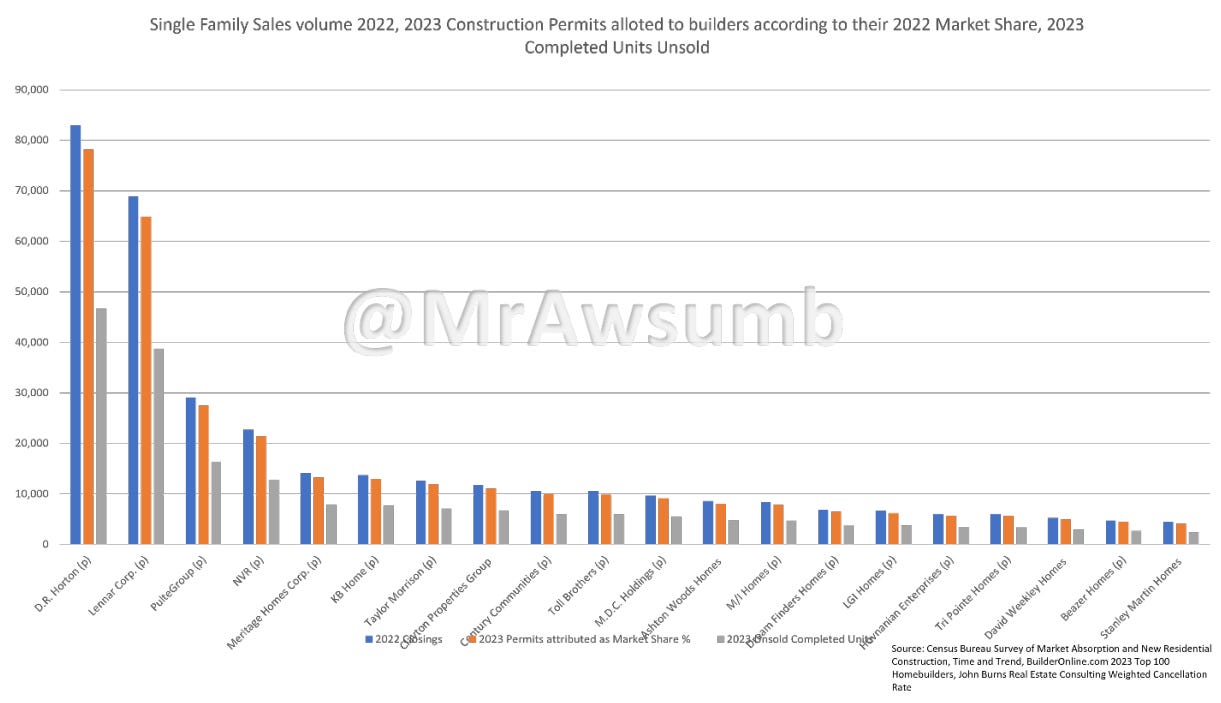
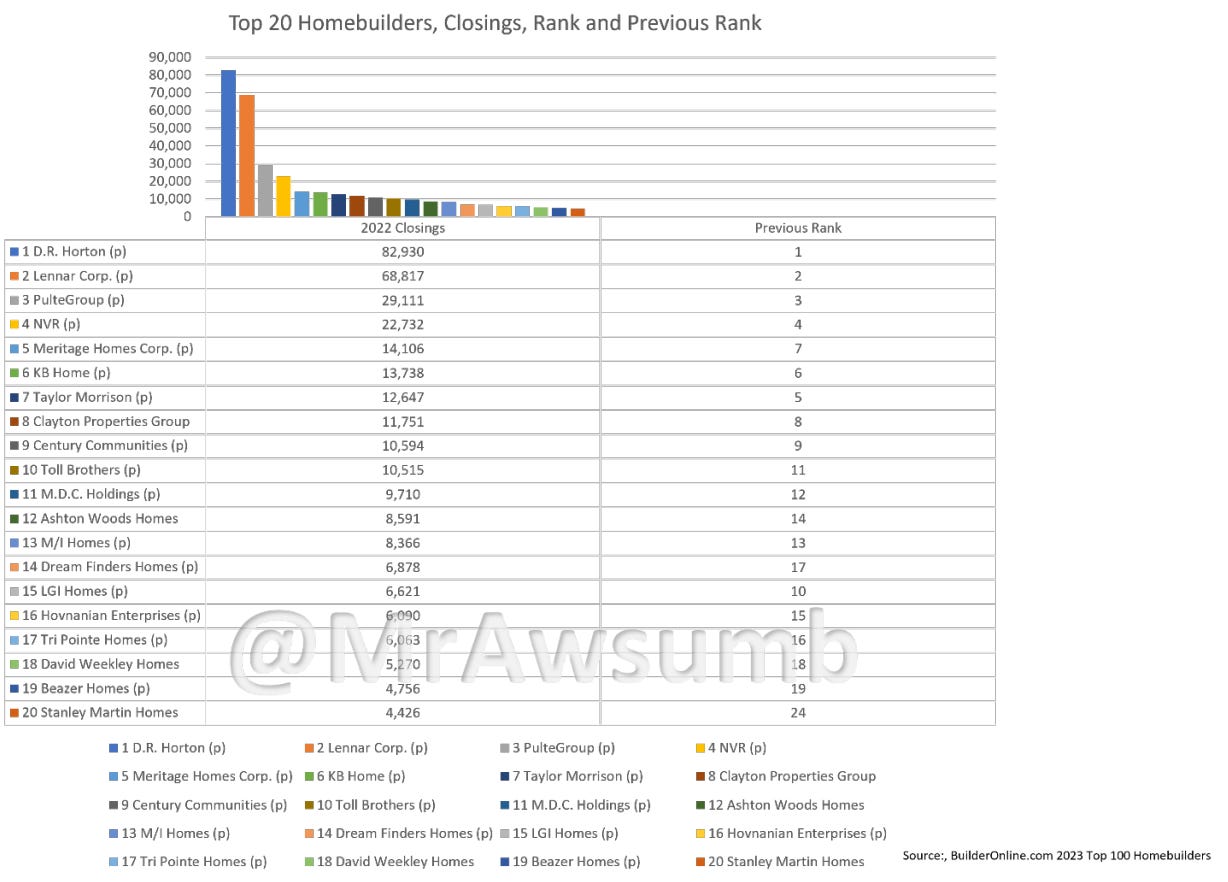
Here are the top 20 Builders from last year. I actually compared all permits for sale this year to the sales volume of the top 200 last year and spread it equally based on last year’s market share. For example, DR Horton makes up 16.85% of the entire homebuilder market. Now, the business has winners and losers, so I am positive this last chart I put together will be wrong simply because I distributed these permits equally. Just look at the top 20 here, with the current rank and the previous year’s rank. Some builders will fare better than others:
So, if the equal weight is wrong, what good does it do? Well, it shows a couple of things:
There are fewer for-sale units than there were closings last year based on the closings of the top 200 builders and comparison to the for-sale permit data.
There’s ramping inventory. You’ll probably hear/read even more about “Inventory Control” during earnings. In fact, I expect this to be tossed out the way AI has on earnings calls.
Some builders will lose market share and have trouble paying for inventory.
If you’re interested in homebuilder stocks, now is a good time to start looking at how much stated inventory is out there as compared to their carrying costs, and most importantly, how much cash they have on hand. Because as more pressure is applied on sales, the carrying costs are going to get heavy, and those without cash to carry might just fall. And those with cash may start buying out those who can’t. Maybe Buffett sensed something about DR Horton’s position after all.
Just for a visual, here’s another map that contains all the unsold for-sale completed inventory, and all the unrented for-rent apartment completions. Again, where they fall will likely be different based on sales, but if they were equal to their permitted starts, this is a fun visual:
An Old Story from 2007 with a Modern-Day Twist (@RealJohnGaltFla, MacroEdge Contributor)
I normally do not dig back in my archives to post my older stuff again unless it suddenly becomes relevant in the conversation of the current era.
In March of 2009, the Federal Reserve under Ben Bernanke decided to accelerate the downfall of America by choosing to save a corrupted system instead of allowing a hard recession, perhaps a depression, to flush all of the bad debt and companies out of existence. The results would have been painful with 19-25% unemployment, massive credit contraction, and the loss of some of the major banks.
In the end, the US would have bounced back quicker, the horrid Dodd-Frank legislation would have been unnecessary, and our society hopefully learned a lesson about speculative paths to riches versus pragmatic saving and investing.
Of course that did not happen and politics, not economics, changed the course of history.
Fast forward to today.
Speculation is seen as the ultimate risk-reward play because everyone believes the government will bail them out in the end. Zombie banks like Citigroup still exist because it was the will of the Fed and the Obama administration. General Motors was stolen from the bondholders and repurposed to provide the unions with government-guaranteed employment instead of broken up into smaller, more viable automakers perhaps with some units being acquired by solvent overseas competitors. The largest corporations were saved during the Covid pandemic also while the government willing sacrificed small and mid-sized businesses; and they will be allowed if not forced to fail again as the recession begins to impact our society in the months ahead.
As President George W. Bush famously said:
“I’ve abandoned free-market principles to save the free-market system”
December 2008 CNN Interview
What is the end result now?
The United States has a telling and terrible road ahead. If we fail to allow the Federal Reserve to raise rates above 6% to check inflation for the long term, odds are we repeat the late 1970’s to early 1980’s inflationary recession disaster which crushed America. Even worse, the political leadership of this era is even more incompetent on both sides of the aisle and even more corrupt than at any time since 1867.
In other words we have a nation run by cowards, unwilling to lead, and only engaged in the eons old tradition of politics for profit.
Thus why I see the beginning of a deflationary nightmare in 2024, followed by a political attempt to stem that tide as the national election approaches. That political attempt will eventually become known as the advent of Weimerica, where we truly do print ourselves into oblivion to protect the banks and political elites. Deflation is not an option in modern society, so prepare accordingly.
And now the blast from the past:
Three kinds of gold? Yellow, black, and white? Oil as black and lithium/silver as white? Ammo?