
8/27 Weekly Report: We've Been Jackson Hole'd - the Fall Ahead, 'Chilly' Restaurant Data, AirBNBye, China Bounce?, and More...
In this weekly MacroEdge report - Don & the MacroEdge team delve into some of the most pressing economic issues - covering everything from the latest restaurant data, to AirBNB, China, and more.

8/27 MacroEdge Weekly Release
@DonMiami3 - MacroEdge Chief Economist, @SixFinance - MacroEdge Head of Research, @MrAwsumb - MacroEdge Contributor, @TexasRunnerDFW - MacroEdge Contributor, @DedKatBouns - MacroEdge Contributor, @GregCrennan - MacroEdge Contributor
Weekly Data Dive and the ‘Fall’ Ahead (@DonMiami3, Chief Economist)
Yet another weekend is nearly in the books - feels like the year is flying by faster and faster as they always tend to do towards this time of year. Hope you all enjoyed the usual Jackson Hole debauchery as well. We have a great lineup tonight for the weekly report including our newest resident restaurant industry expert @DedKatBouns, who’s got some great data for you all. I will keep my piece short this evening because there’s so much content from everyone else - but I am excited to announce that our MacroEdge Job Cuts Index will be available sometime next Sunday evening and data will be compiled on a rolling basis from 9/1/23 onwards. This index should give us an even better view of how the job market is holding up and is just the first element of many that will be brought to the table under our research umbrella. While the full Ascend platform and data dashboards are built out - this index will be viewable on our current side at MacroEdge.net and updated weekly.
With Fall now rapidly approaching - let’s see how things are progressing in the context of the labor market versus past cycles:
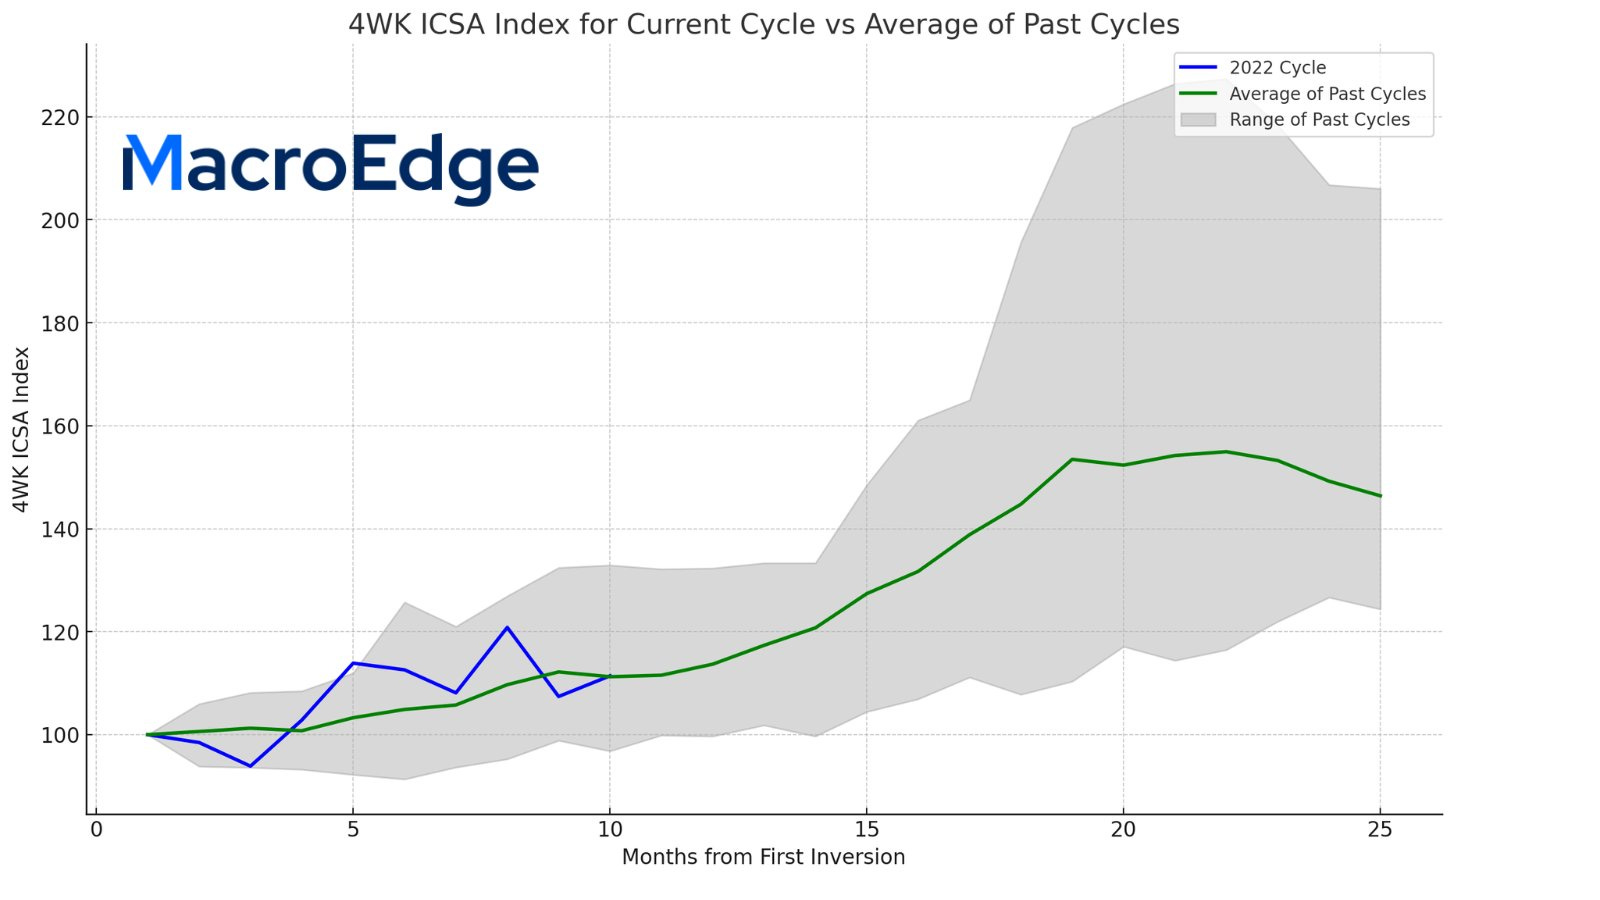
Our current initial claims scenario continues to echo past cycles - progressing right above/on the average trendline of the past cycles (dating back to 1969). Notice that most deterioration happens between months 13-18 based on past cycles, which at month 10 currently would be months away. This chart will be included on the MacroEdge data dashboard and I will update it next week when we have the final 4 week average that includes this last week of August data coming up.
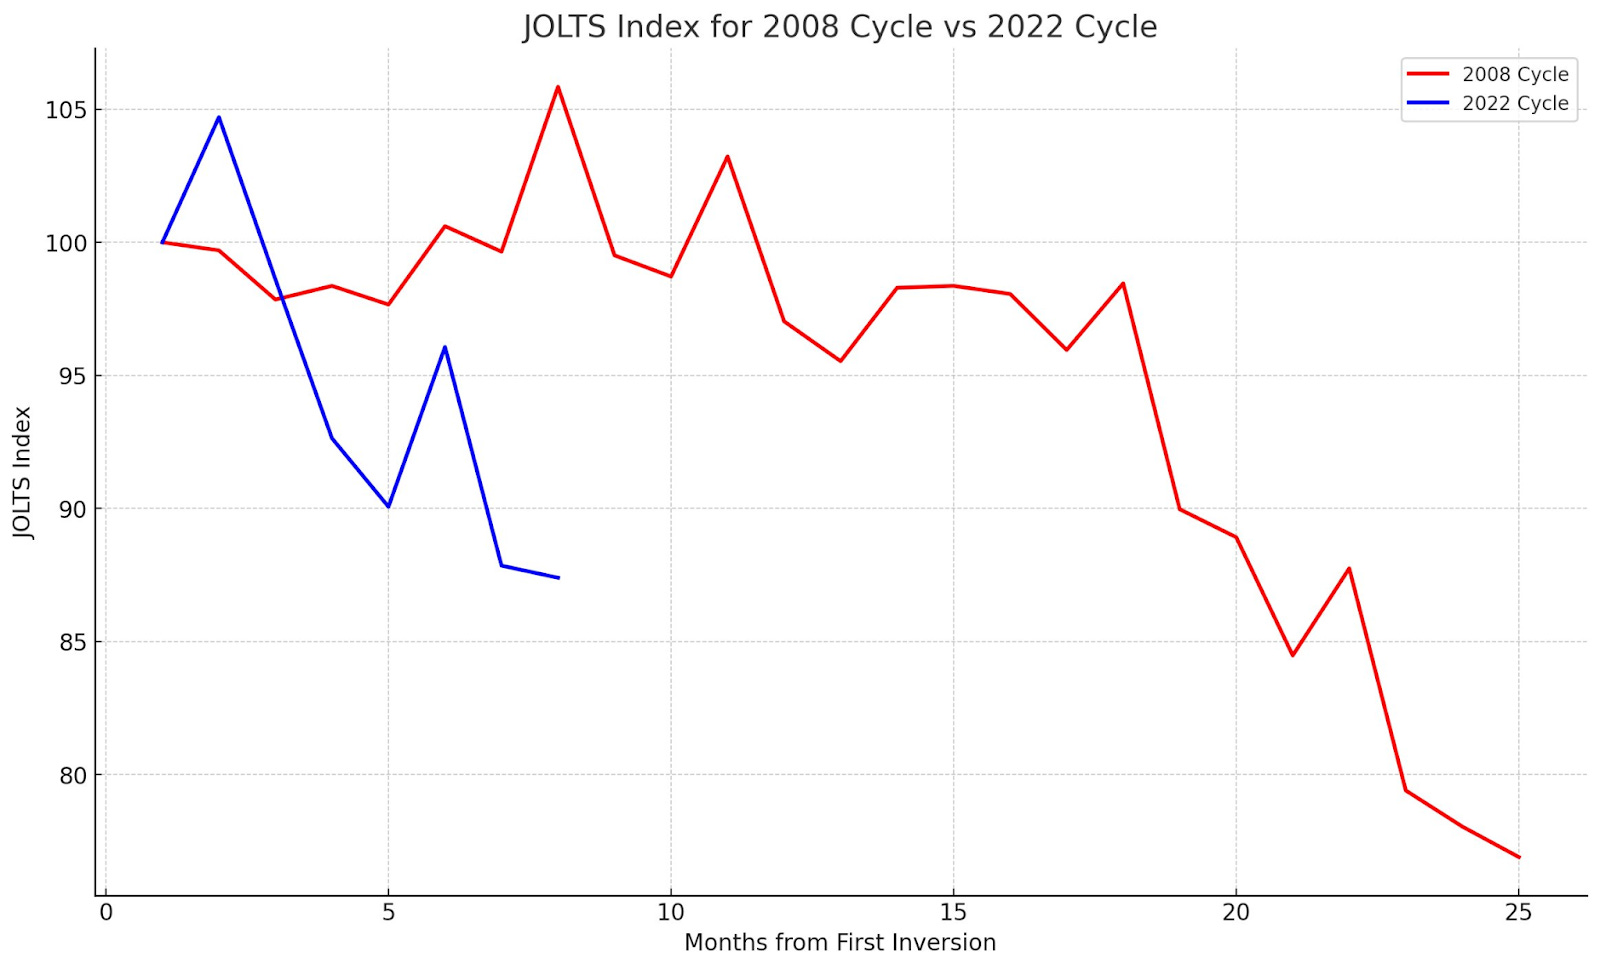
Regarding job openings - the Fed is closing up openings at a quicker pace than the 2008 cycle - you can view the comparison of the 2022 JOLTS index to the 2008 index which is in % terms of total job openings off of the high. Given that we are trending out of summer as well - it’ll be interesting to see if we get further shrinkage of this number as the Fed continues its hawkish agenda in the battle against inflation:
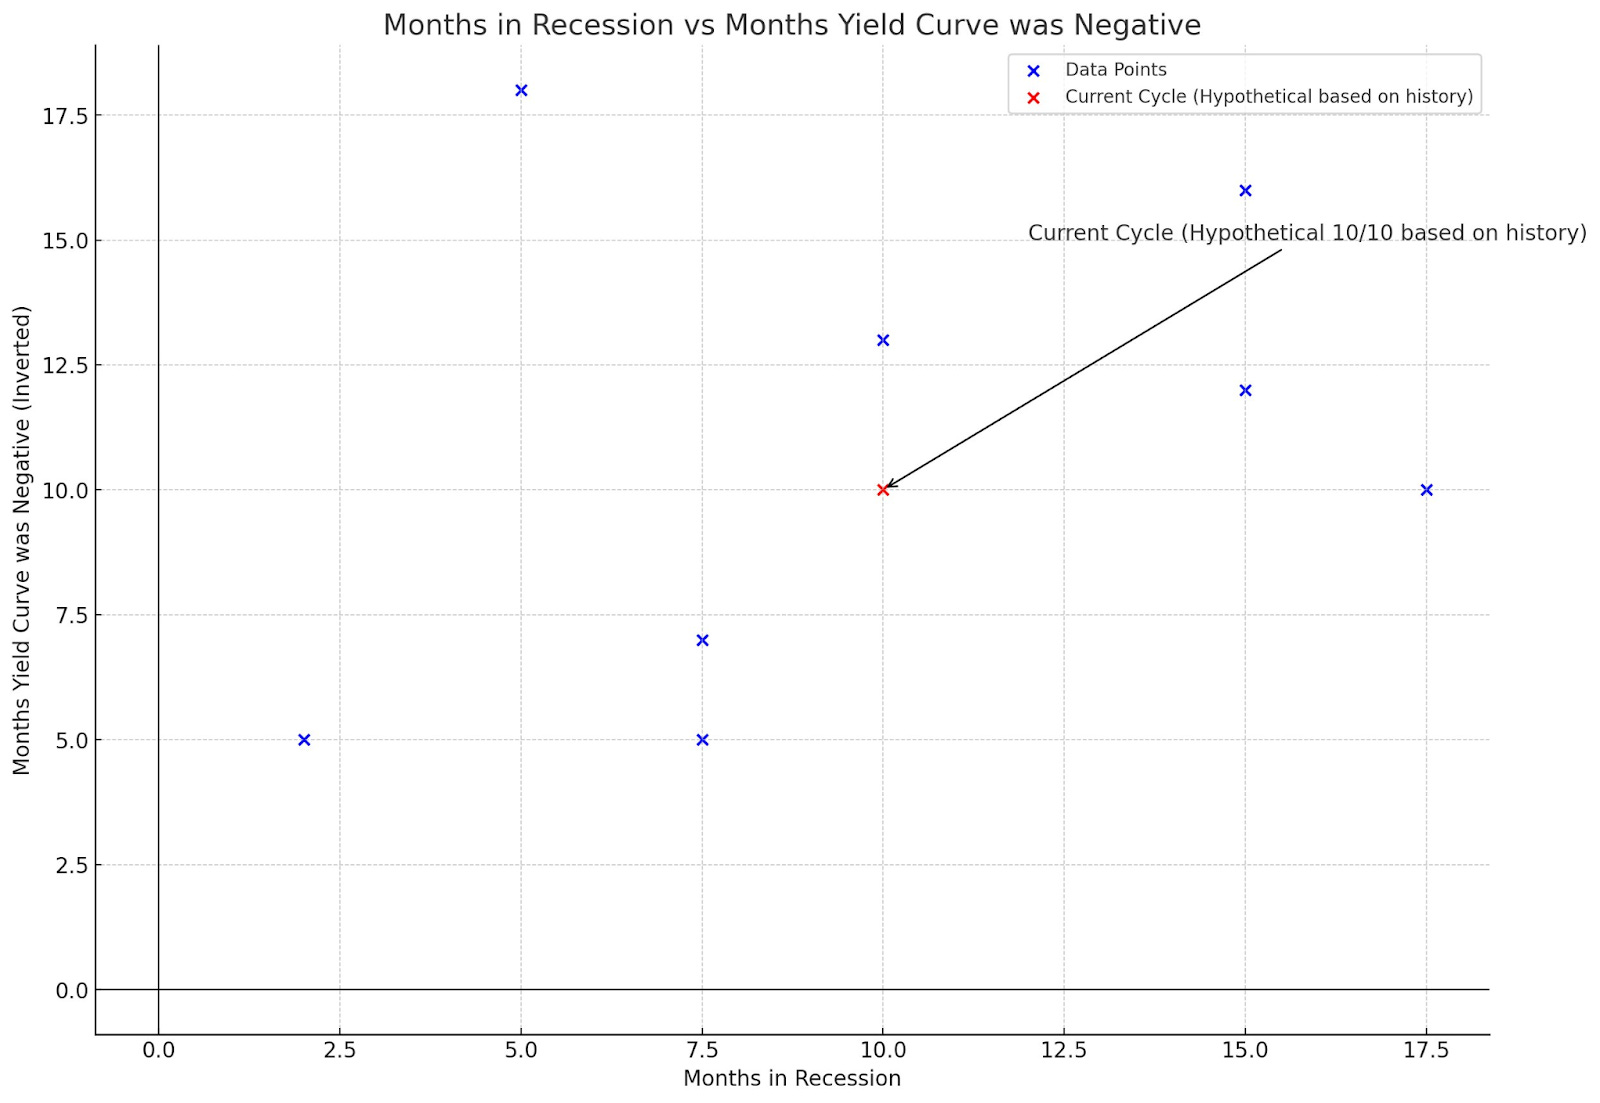
On a final chart for my very brief piece this week - an important note regarding the length of time we’ve spent inverted (10Y3M) versus the length of past recessions. In all instances but one (1980 with an unprecedented cut not even possible today given the 525-550bps Fed Funds rate) - inversions >9 months have led to recessions >9 months. You can see the diagonal bifurcation on the chart pretty clearly with shorter inversions seeing the shortest recessions and longer inversions seeing the longest recessions.
A lot of interesting data continues to come out of Europe - specifically, Germany, Canada, New Zealand, and Australia that highlights the ‘dead cat economic bounce’ seen across these economies and it appears that we are now beginning to see the rollover worldwide (excluding China which is hard enough to gauge). We saw this in our latest S&P Global data release showing weakening services in the United States along with weakening employment - which could put upward pressure on things like the initial jobless claim data discussed above.
I pretty firmly believe the market upside is quite limited here given the liquidity and situation with bonds here. Odds of that Fed ‘cut’ continue to drop and the hawkish pause can drive home the lag effects many of us have been waiting on for over a year now (see pinned Tweet on @DonMiami3, for first release of 10Y3M recession forecast). Let’s see if we finally get that ‘Fall’ ahead in the continuing weakening of the employment sector… and keep an eye on those regional banks too.
Hope you all have a great rest of your evening and enjoy all of the fantastic contributor pieces from our team below!
Tradeable Bounce in China? (@SixFinance, Head of Research)
Tradeable bounce in China?
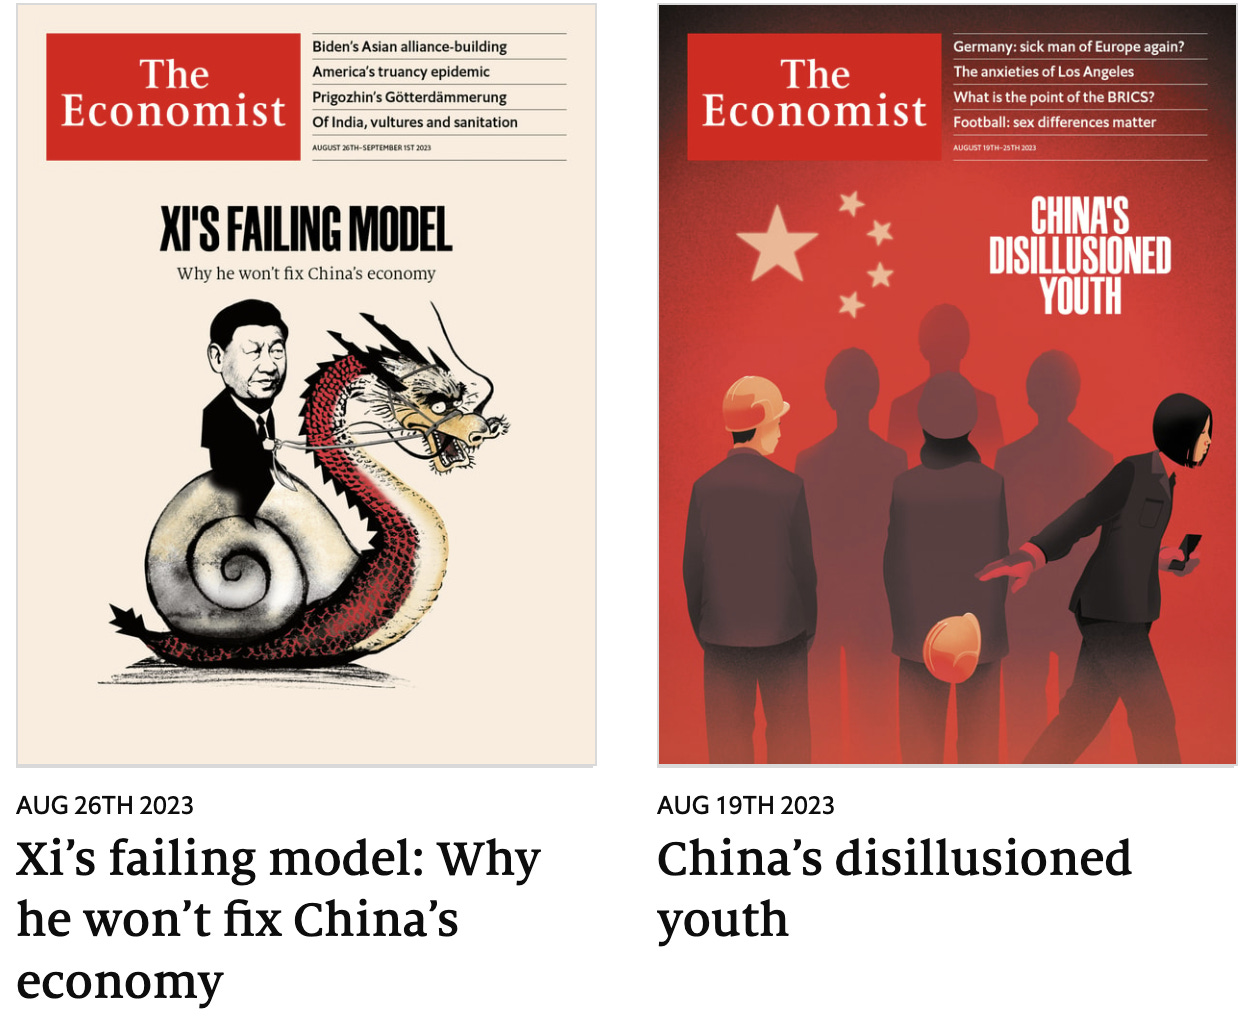
Crazy? Not as much as you’d think. Data out of China continues to surprise and alarm to the downside. Now in deflation, investors are becoming scared of a large waterfall sell off in Chinese equities. In fact, China doom and gloom headlines along with mainstream media coverage is exploding. For good reason, and we have covered this recently. However, when we have historically seen things like the Economist publishing two doom and gloom pieces in back to back weeks about a country, that’s typically a decent time to start looking for a bounce.
Last week we examined a slew of negative data on China and controls being put in place to stablize Chinese markets, including banks being forced to buy chinese stocks.
We now also have as of today 8/27 Chinese authorities announcing the tax on Chinese stock trading gains to be HALVED, reduced margin financing requirements (big), restricted listed companies refinancing, and restricting share reductions by major shareholders. So essentially they are asking everyone to stop selling, and may now lever up further to buy. There is little doubt that orders to stabilize markets are being given internally. As large numbers of traders likely take short positions against Chinese markets, internal controls will fight against the speculators.
While I don’t believe this is the time to be outright long China on an investment basis because of underlying conditions, a tradeable bounce in China is on the table. I will be watching for more poor economic data to come out of China, only to be met with a flat market response. The Hang Seng index is down just over 20% from recent highs and nearly 50% from December 2017 highs, and I will be watching for a muted or bullish reaction following economic releases or other spur of the moment news to tell me that the bounce is on.
The Wind Down - A Look at Rite Aid (@MrAwsumb, Contributor)
With the news that Rite Aid (ticker: RAD) is preparing to file for bankruptcy, I thought this would be a good time to follow up from last week on the end of a business cycle. Because, in the end, the story of Rite Aid is a story of how real estate is the economy. But first, there's some bad news regarding the real estate industry in general. It's been well-publicized how poorly office property is performing and losing value at an incredible pace. But it seems the not-so-long-ago "Retail Apocalypse" has been mostly forgotten, despite the fact that the sector is still in a free fall that started over a decade ago. It's just a sign of how far the fall of a cycle can actually be. To illustrate, after seeing some store closure notices, I did some digging. This year there have been over 4,000 publicly announced store closures for 2023. Here's the list along with their average store size and total square footage.
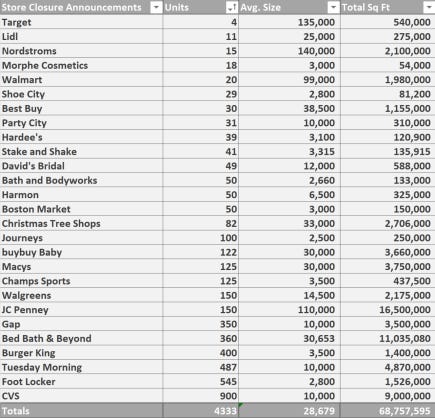
That's 68+ million square feet of retail space that will stop producing revenue this year, using the average store footprint. Using average U.S. retail rent calculations, that's $1.5 billion in rents that won't be paid next year. While some stores only rent spaces, like inside shopping malls (Champs Sports/Foot Locker), others anchor them (Macy's/JC Penney). There's a large subset of these that sell their stores and lease them back, like Rite Aid, Walgreens, and Burger King. Doing an analysis of brands that develop their stores to sell as NNN (Triple Net Lease) or sale/leaseback paints a startling picture.
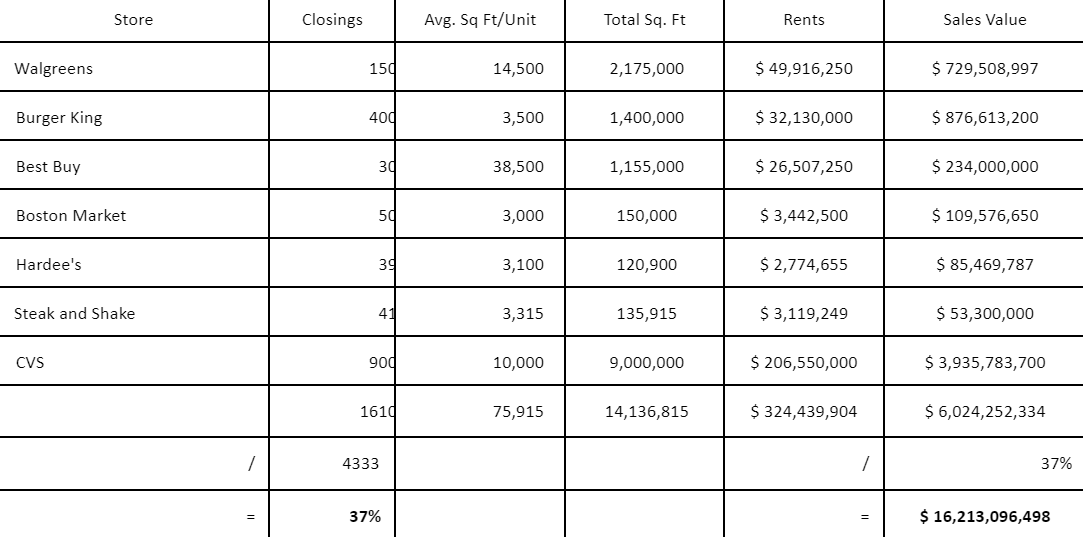
This list of actual announced closures represents only 37% of the total closings, to the tune of $6 billion dollars' worth of real estate sales value impacted. These are using the average asking price nationwide at the time of publication. But these are what should be the focus. Because the model these companies use to grow is to develop their property, sell it to an investor, and lease it back. And at very low rates of return. In fact, over the last few years, they have sold at returns under what Treasury bills will get you right now. Why? Well, some folks look at these as "passive" real estate, and they are less involved than other types. Others yet have bought them as 1031 Exchange properties (like-kind to defer tax payments after a capital gain on property sale). 1031s have been a bit of a bubble themselves of late because of the time frame given to defer taxes.

The important detail in all of this is what it does for the companies and their stock. They can grow because when they deploy capital to develop a property, they get the capital returned much faster by selling it off as a NNN instead of holding it as an asset. The capital can then be spent on product/marketing/stock buybacks, etc. And it's the only way that Rite Aid, CVS, and Walgreens have been able to grow into the oligopoly that they are.
Breakdown of financials:

In pre-internet days, to gain sales you either built/bought more stores or had mail-order catalogs. Companies like Sears and Victoria's Secret were built on catalogs as their foundation. But pharmacies as a roll-up worked because they relied on people needing to be there to get their medications. When you need medicine, waiting for the mail isn't ideal. With the advent of grocers and other retailers having small pharmacies in-store, the need to be at the oligopoly is disappearing. And for all the other merchandise that these pharmacies sell/sold as a convenience, there are a multitude of other places to buy, including the modern mail-order catalog: the internet. This is the wind-down of the long roll-up.
It's always been the real estate that's allowed these companies to grow to the size they have. And in case you think this only affects the outlook of retail real estate, allow me to introduce you to the other assets retail companies impact: Rite Aid Distribution Center top, CVS middle, Walgreens bottom. Maybe YRC won't be the only one adding vacancy to the industrial market or freight industry this year.


Why Does Everyone Still Want to Own an AirBNB? (@TexasRunnerDFW, Contributor)
Powell's hawkish remarks at Jackson Hole should have struck fear in the hearts of overleveraged landlords around the US. Seasoned investors are aware this is not a macro environment that is friendly to real estate investing. But many novice investors, it seems, are still hanging in there, riding on paper equity and hopes and dreams of a pivot. There are A LOT of new landlords in the past few years whose deals likely only cash flow in a zero-interest rate environment. Not a slightly lower interest rate environment—a ZERO interest rate environment. And it doesn't sound like Powell intends to bring that back anytime soon.
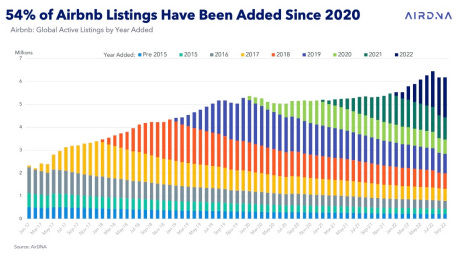
Why, then, do we still see so many retail investors (on TikTok, YouTube, and Facebook) clamoring to get their hands on short-term vacation rental properties? Beyond the obvious fact that most average Americans are financially illiterate and have no idea what Macroeconomics is, people want to own Airbnbs because other people who bought them 2+ years ago with favorable rates made a lot of money—and they're talking loudly about how much money they've made. If you refer to the chart above, 54% of Airbnb listings have been added since 2020. That is a huge supply boom! And it has been met with an equally impressive travel demand boom. It's been met with record property equity increase. But both of those are rapidly dwindling.
Late-stage FOMO is powerful. It is the reason why on most classic mania or stock bubble charts, you'll find what is referred to as a "blow-off top." That last rush in at the end is what drives the asset valuation up to astronomically ridiculous heights before it peaks and begins its descent downward. And it's typically a last-in, first-out type of liquidation process.
The Airbnb mania is reaching the end stage of FOMO. We're now seeing seasoned investors pull back and even start selling deals while the least sophisticated new "investors" trickle into the market, buying deals that barely pencil in (if at all), grabbing at their lotto ticket to real estate riches.
We know how it ends.
Many are going to be in for a rude awakening soon. Because America's ability to fund another post-Covid Instagram vacation is winding down as inflation and credit contraction continue to sink their claws into discretionary consumer spending. Never forget: a leveraged cash-flowing asset quickly becomes a cash-draining liability.
The Big Chill: The Unsettling Slowdown in the Restaurant Industry Heading Towards Fall After the Summer That Never Showed (@DedKatBouns, Contributor)
How often do we consider the impact of restaurant trends on our daily lives and the broader economy? Perhaps not as often as we should, especially when we reflect on the role restaurants play in our personal and collective narratives. From hosting our birthday parties to sponsoring our little league teams and offering first jobs to eager teenagers, restaurants have woven themselves into the fabric of our lives. Beyond these personal milestones, they've also been a launchpad for countless careers. Many have climbed the ranks from hourly roles to management, and some have even transitioned into corporate roles like recruiting, local store marketing, and restaurant design. It's a testament to the industry's potential that 8 in 10 restaurant owners and 9 in 10 restaurant managers started in entry-level positions. In fact, a staggering 63% of adults began their working journey in this very sector. Clearly, restaurants leave a mark on our lives, memories, and the economy in ways we might not always recognize.
Yet, despite their presence in our lives, the past three years have seen the industry navigate tumultuous waters. Recent trends paint a picture of mounting challenges, underscored by a summer sales season that, for many, promised much but delivered little.
Traffic and Sales Performance: The Numbers Show the Music is Slowing
Dwindling Visits: Traffic to QSRs in the US has dipped by -2.1% YoY in Q3 2023, following Q2's -1.8% YoY. This trend isn't isolated to just a few; from Papa Johns to Noodles & Company and beyond, establishments are most vocal and concerned about this trend. According to Black Box Intelligence reporting ending in June, the industry posted its 15th consecutive week of negative traffic growth. The industry has only posted 7 weeks of positive transaction growth in 2023.
Smaller Orders: The quantity per transaction is down by -3.8% YoY. It seems diners are becoming more conservative with their orders, often skipping the extras that can make or break the budget.
Losing Dayparts: With many companies continuing to allow remote work, people are not grabbing lunch or the morning breakfast sandwich on the way to their desk. According to a new report from Square data, Saturday brunch is now restaurants busiest daypart replacing the 2019 Friday lunch reign. More than 10% of all dining dollars were spent from 8am to 1pm on Saturdays in Q2.
Sales Dynamics: A growth of +5.2% YoY in net sales might seem promising, but delve deeper, and it's clear that price hikes (+7.1% YoY) are driving this. Digging deeper into the state level, almost half of all states (24) experienced negative sales growth in June.
Hiring Trends: A Slow Dance
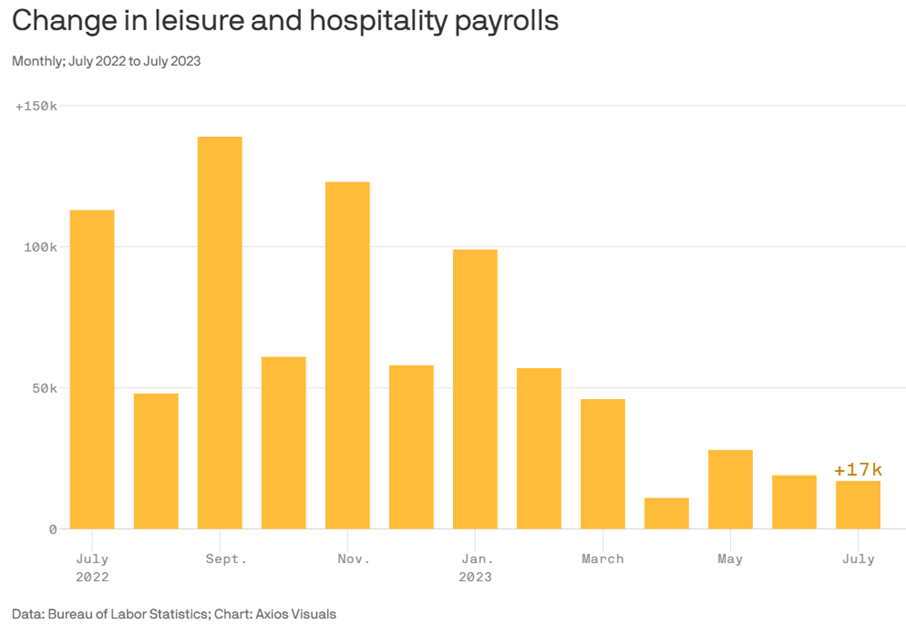
The hiring patterns reflect the broader slowdown. Data from the Bureau of Labor Statistics reveals a tapering in hiring within the leisure and hospitality sector. From an average of 81,000 job gains each month in Q4 2022, the momentum has slowed to just 19,000 in Q2 2023.
Further compounding this trend, a report from Nation's Restaurant News highlighted a decline in restaurant and bar jobs for the first time in over two years. June 2023 marked a reduction of nearly 1,000 positions. What's striking is that this dip occurred right in the heart of summer, a period typically characterized by a hiring spree in the restaurant industry.
July 2023 saw an even more pronounced slowdown, with a mere addition of 17,000 jobs.
Wrapping Up
The numbers tell a story, but there's no substitute for the firsthand accounts of those on the front lines: our restaurant servers. On your next visit to your favorite diner or local pub, strike up a conversation. You'll find they're not only open to share the pulse of their business but also the sentiments echoed by their customers. As we digest the reality of dwindling visits, conservative orders, and a cautious hiring approach, it's crucial to remember that as we head into fall, a season that traditionally witnesses a 10-15% decline in sales as noted by the National Restaurant Association, the industry's resilience will continue to be tested.
An Inflation Update (@GregCrennan, Contributor)
Inflation, which has been a major concern to every American, has taken center stage of the US economy. To grasp the complexities of inflation, it's imperative to comprehend its essence. Originally defined as an increase in the money supply, the concept evolved about a century ago to represent the persistent uptrend in the general price level of goods and services. Over the past two decades, the US economy has witnessed a gradual core inflation averaging around 3.5% per year till 2020. This phenomenon is primarily attributed to the expansion of the money supply, particularly the M2 money supply, which has surged by a significant 320% since 2000. However, it was the year 2020 that marked a pivotal turn, thrusting inflation into a spotlight of heightened concern. This article takes a dive into the interplay of money supply, velocity, and their impact on inflation today, while highlighting the pivotal events that have shaped the trajectory of the US economy.
The Money Supply Surge
The last two decades have seen a substantial growth in the US money supply. This growth escalated notably in 2020, witnessing a 40% surge in M2 money supply in just two years. This monetary expansion, controlled by the Federal Reserve, conflicts with the central bank's mandate from Congress, which aims to maintain maximum employment and stable prices with a targeted 2% annual inflation. The aftermath of the 2008 recession spurred new central bank tools like quantitative easing, where the central bank purchases government bonds to inject fresh digitally-printed money into the economy, coupled with a drop in interest rates to 0% to stimulate consumer spending, these actions sought to invigorate the economy. While the initial years witnessed inflation that no one really noticed between 2000 and 2020, the recent expansionary policies have culminated in recent years’ causing concern of the recent trend of inflation averaging 5.5% (20% in total over the past three years).
The Inflation Catalyst: Surge and Contraction
The pivotal shift in inflation dynamics began to unfold in 2020. The Federal Reserve's purchase of $4 Trillion worth of US bonds triggered a substantial increase in total money supply from $16 trillion in 2019 to $22 trillion 2022—a wild 30% surge. This acceleration underscored the sensitivity of price levels to rapid monetary expansion. In a recent shift, the money supply has contracted by approximately four percent over the past year, mainly due to policy changes by the Federal Reserve, including the fastest interest rates rise from 0% to 5.5% in US history.
Money Velocity: Deciphering the Circulation Enigma
Money velocity, a cornerstone of runaway inflation dynamics, gauges the pace at which money circulates within an economy. While the past two decades saw subdued money velocity, several factors like the 2001 and 2008 US events hindered spending and kept demand for goods low. However, the scenario today has transformed with an unprecedented money velocity of 10.5% year-over-year surge—an indication that previous stored money is now being exchanged for goods at an alarming fast rate. This acceleration has created a demand-supply mismatch, potentially contributing to price surges as demand outpaces supply, this causes supply shortages.
Navigating the Challenge of Inflation
Amidst the rising inflation challenge, the Federal Reserve are grapple with complex decisions. The expansion of the money supply has undoubtedly fueled inflationary tendencies, but the surge in money velocity has added an intricate layer to the equation. Striking a balance between supply and demand dynamics within the monetary realm is now paramount.
Regaining Control: Achieving Monetary Equilibrium
Addressing the risks posed by runaway inflation necessitates a balanced approach. While reducing demand for money may appear counterintuitive, it is a necessary step. This phenomenon is evident in the real estate sector, where mortgage demand has hit record lows. However, the overarching concern lies in the substantial US government deficits—hovering around $2 trillion annually—indicating an injection of money into the economy exceeding tax revenues, barring instances like the 2020 lockdowns.
Conclusion: Charting the Path Ahead
Between money supply expansion, heightened money velocity, inflation presents a multifaceted challenge for Americans, Government and the Federal Reserve. The consequences of unchecked inflation have far-reaching implications, destroying purchasing power, economic decay, and financial instability. As the nation navigates these challenges, history stands as a testament to the urgency of vigilant actions and prudent intervention. To ensure a stable path forward, a strategic equilibrium must be established, safeguarding the economy against the potential perils of unbridled inflation.