
8/20 Weekly Report: The Bible of Doom? A Cold World for AirBNB, Powell’s Valhalla Ending Moment, Data Updates, Market Outlook, What’s Ahead, and More
In this very extensive weekly report - Don, Six, Awsumb, and John dive into what's driving our markets, what's ahead, discuss the headwinds facing the economy, talk Powell, and more!

8/20 MacroEdge Weekly Release
@DonMiami3, MacroEdge Chief Economist
@SixFinance, MacroEdge Head of Research
@MrAwsumb, MacroEdge Contributor
@RealJohnGaltFla, MacroEdge Contributor
Weekly Data Dive and the Week Ahead (@DonMiami3, MacroEdge Chief Economist)
Hope everyone had a fantastic weekend - trying to stay out of the heat myself and definitely ready to see these temps switch into Fall mode even though we’ve got hurricane season to get out of the way first…
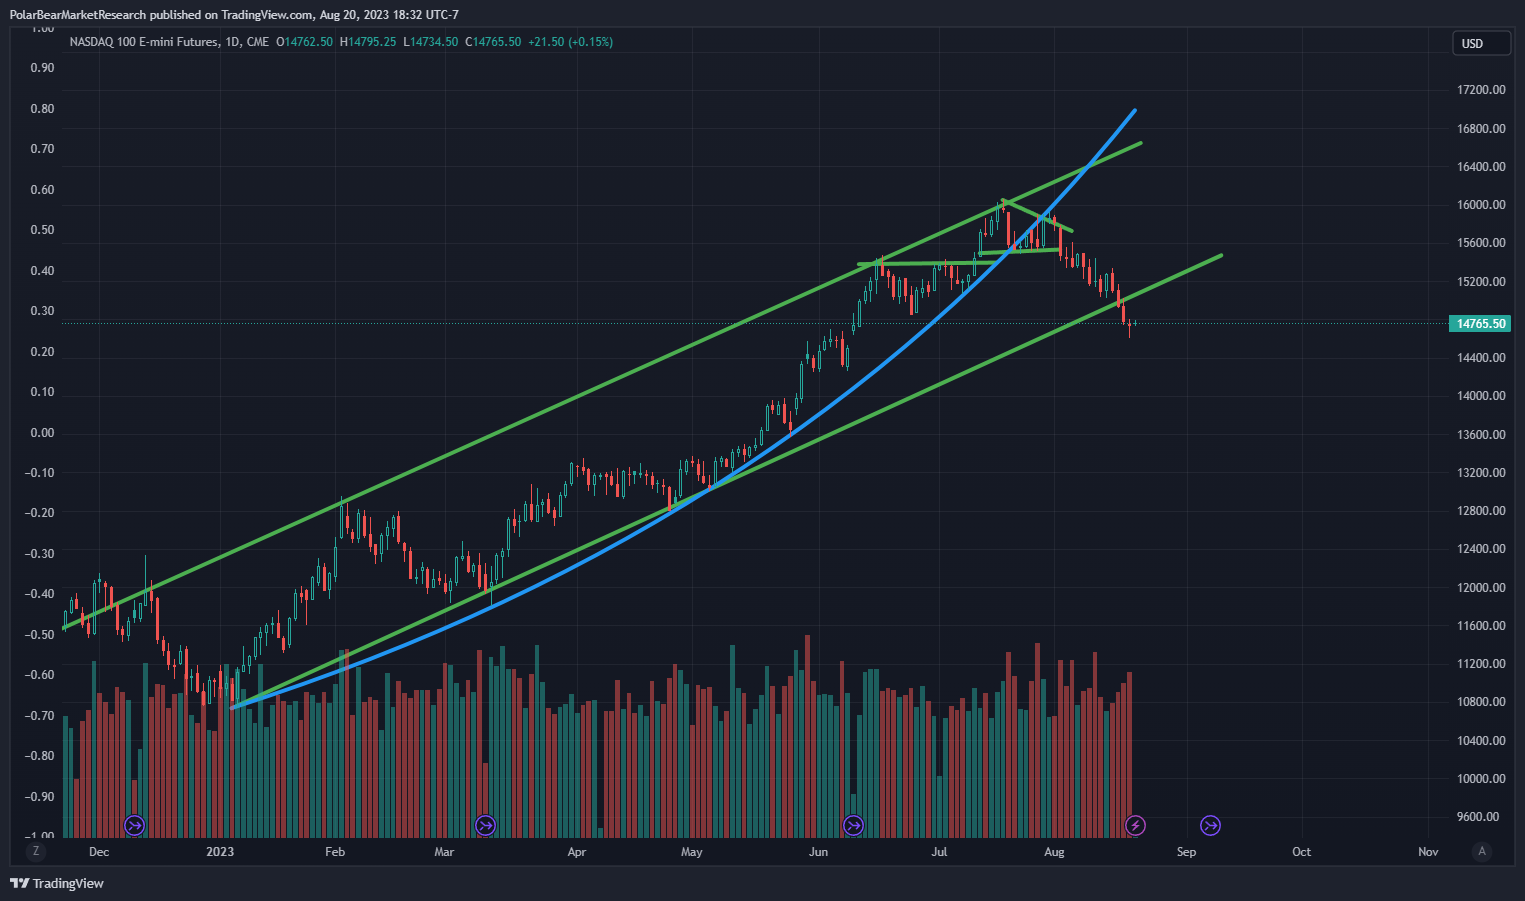
Right now we’re in this historical lull period where we may begin to see the ‘long and variable lag’ take effect in things like labor data and industrial production. Things are still running strong in the economy - but we aren’t seeing these huge celebrations after earnings like we were in Spring/Early Summer on the run up. The Nasdaq index lost that channel we titled ‘Valhalla’ months ago:
NVDA is going to set the course for the week with earnings coming in on the 23rd after market close. The rest of the larger ‘macro’ data has been pretty non-spectacular - especially on a more forward-looking basis (Q4-Q2 ‘24) which is the horizon I care more about right now than the immediate quarter.
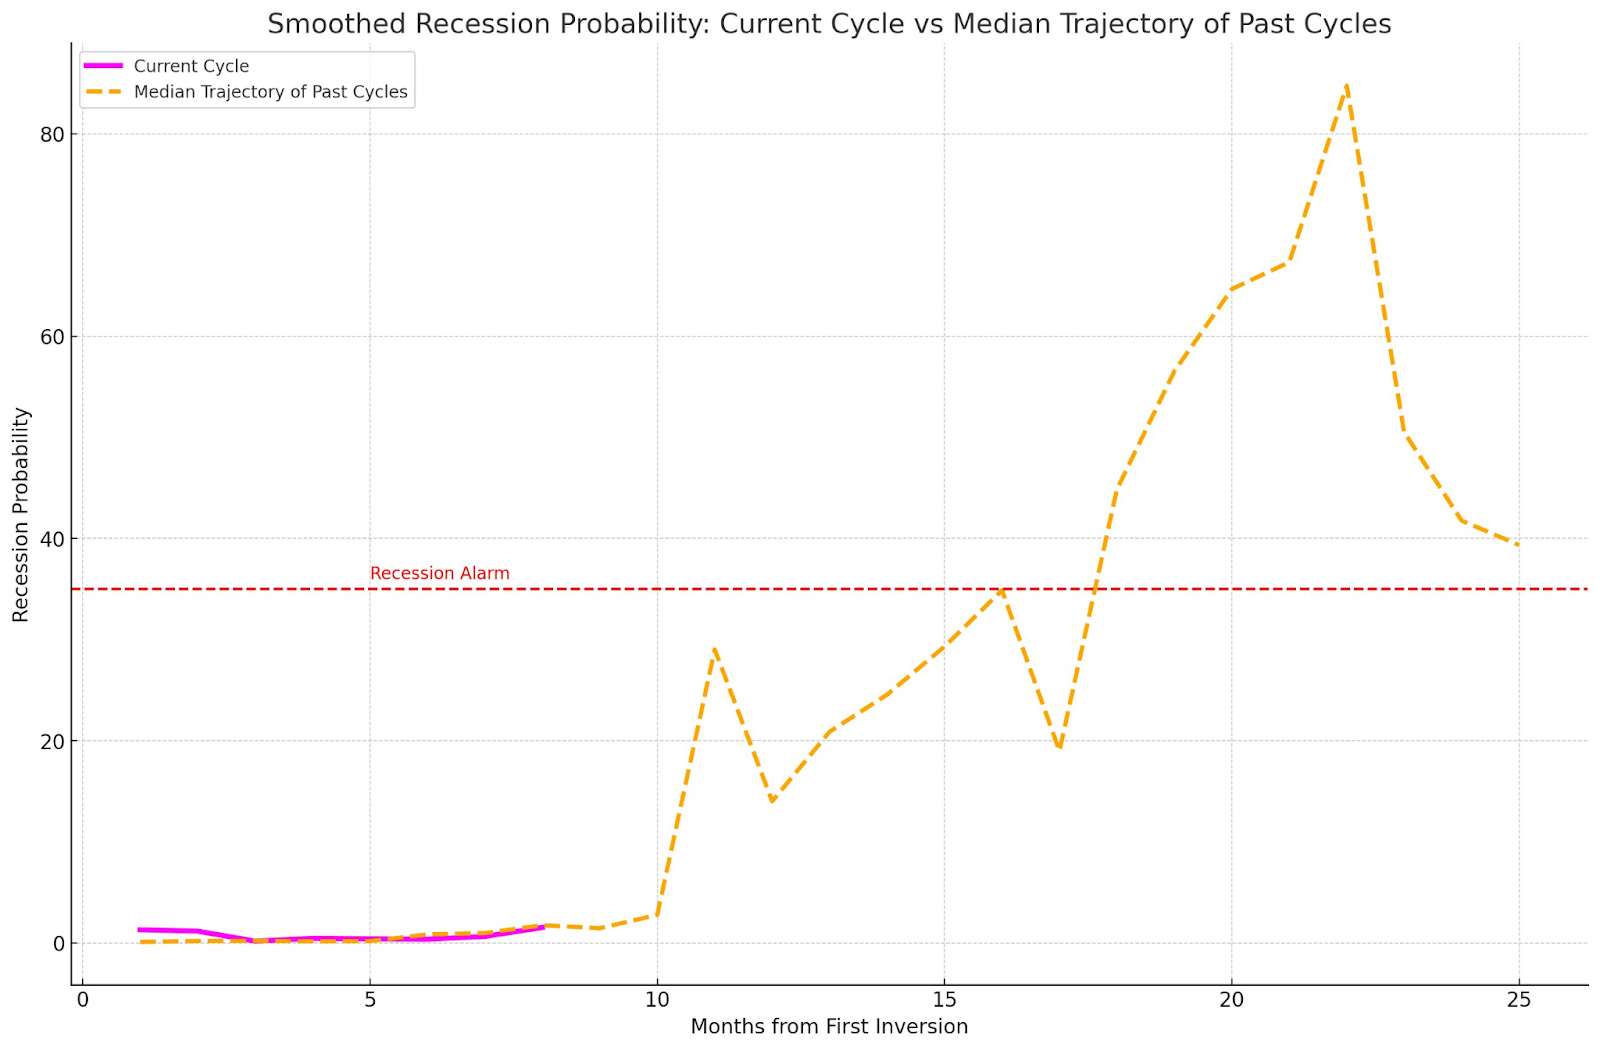
Now let’s dive into the charts and data. Here’s Chauvet, Marcelle; Piger, & Max's smoothed recession probability model. Utilizing the median trajectory of past cycles since 1969 - we can see that this current cycle is running a very typical track of when we would start to see this indicator begin trending up towards the ‘recession alarm’ threshold at .35 on the y-axis, and this is another helpful model that we can utilize in the context of the many other models that we’ve been tracking in order to analyze the actual lag effects from this neck-snapping hiking cycle taking effect.
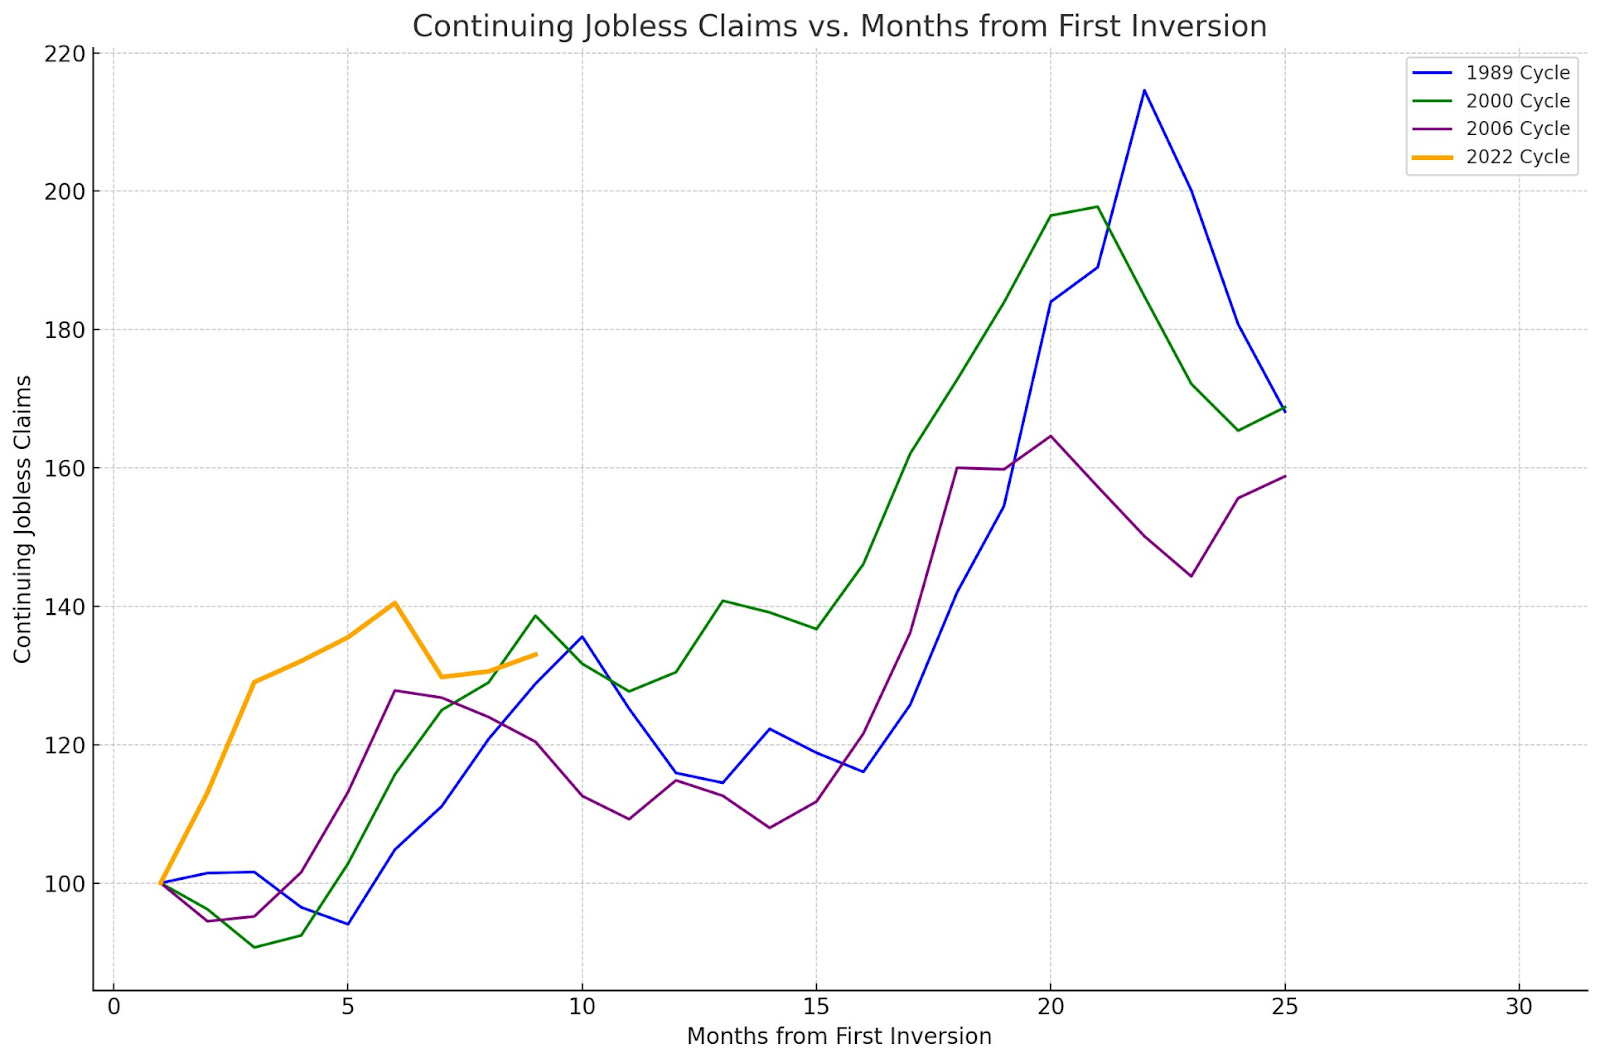
Now let’s look at lending standards and jobless claims:
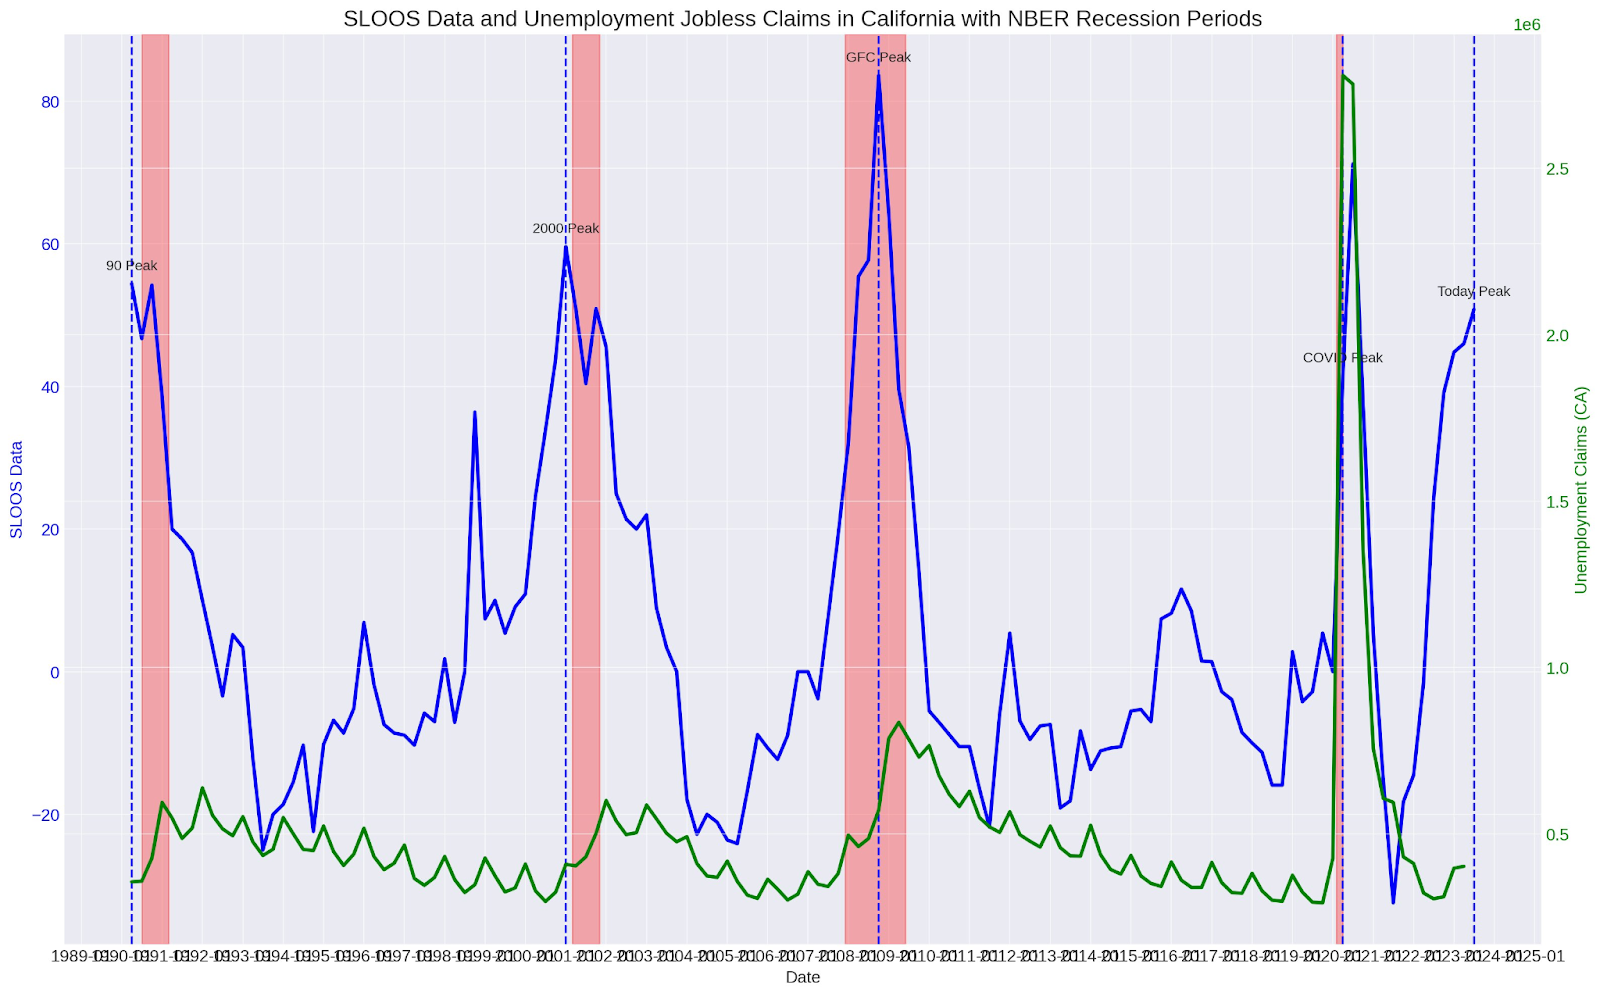
As we can see - going back to the 1990 recession, continuing claims tends to see its largest increases after the peak net % tightening reported by bankers.
Now turning to AirBNB and potential trouble ahead for the STR market - ABNB has gotten hammered since it was reported that the founder Mr. Gebbia sold a huge % of his stock ownership at the end of last month. You can see AirBNB in the context of this massive rising wedge here:
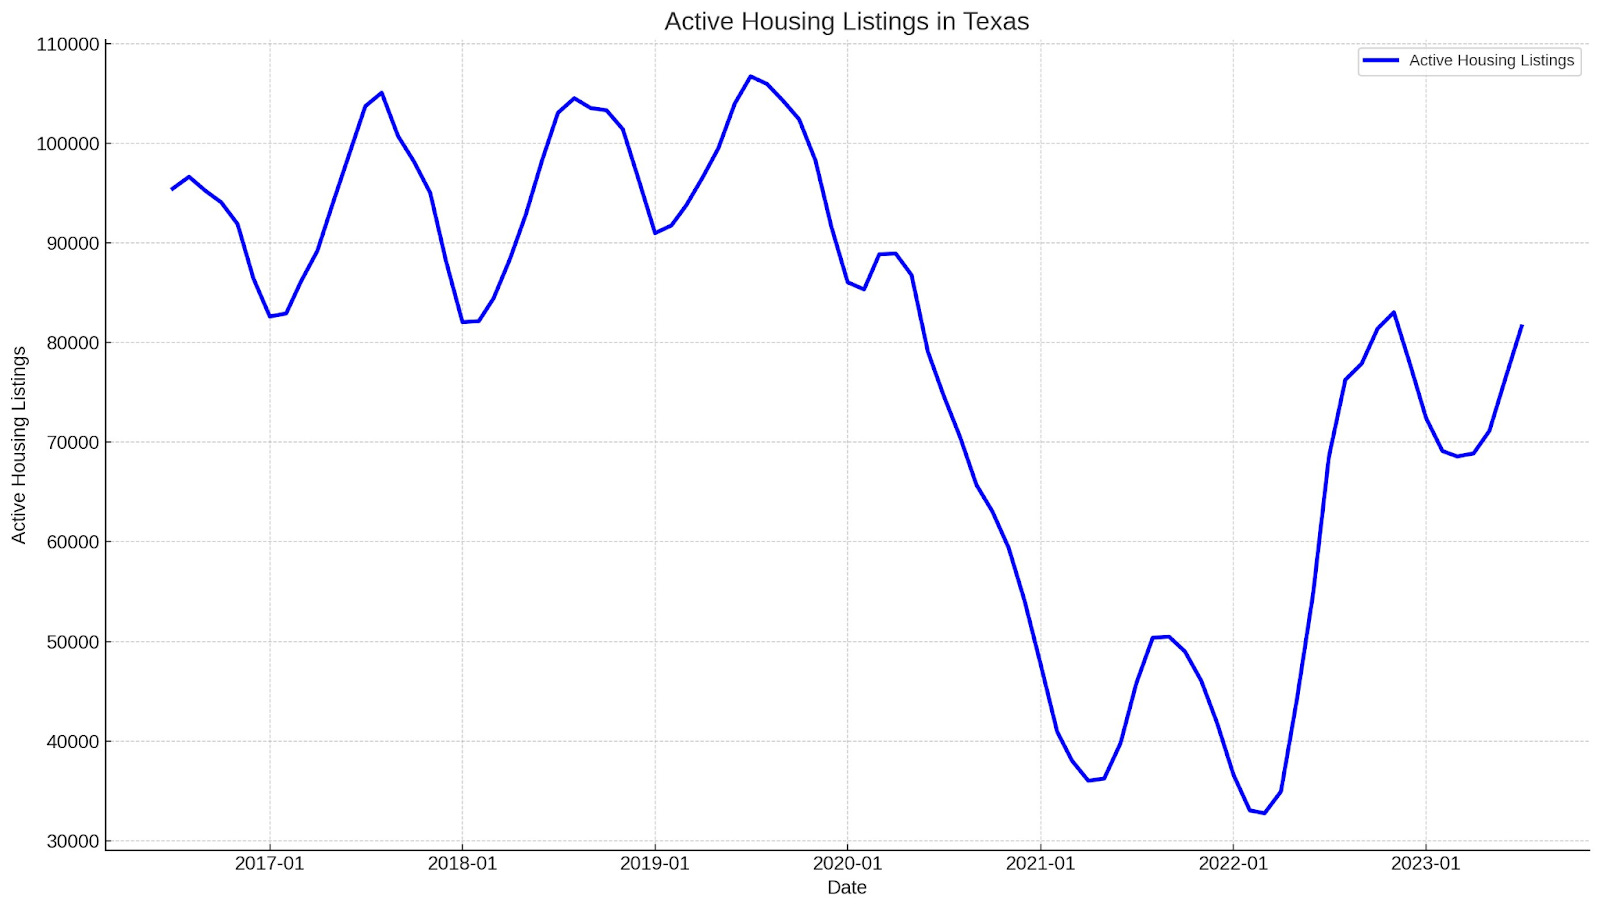
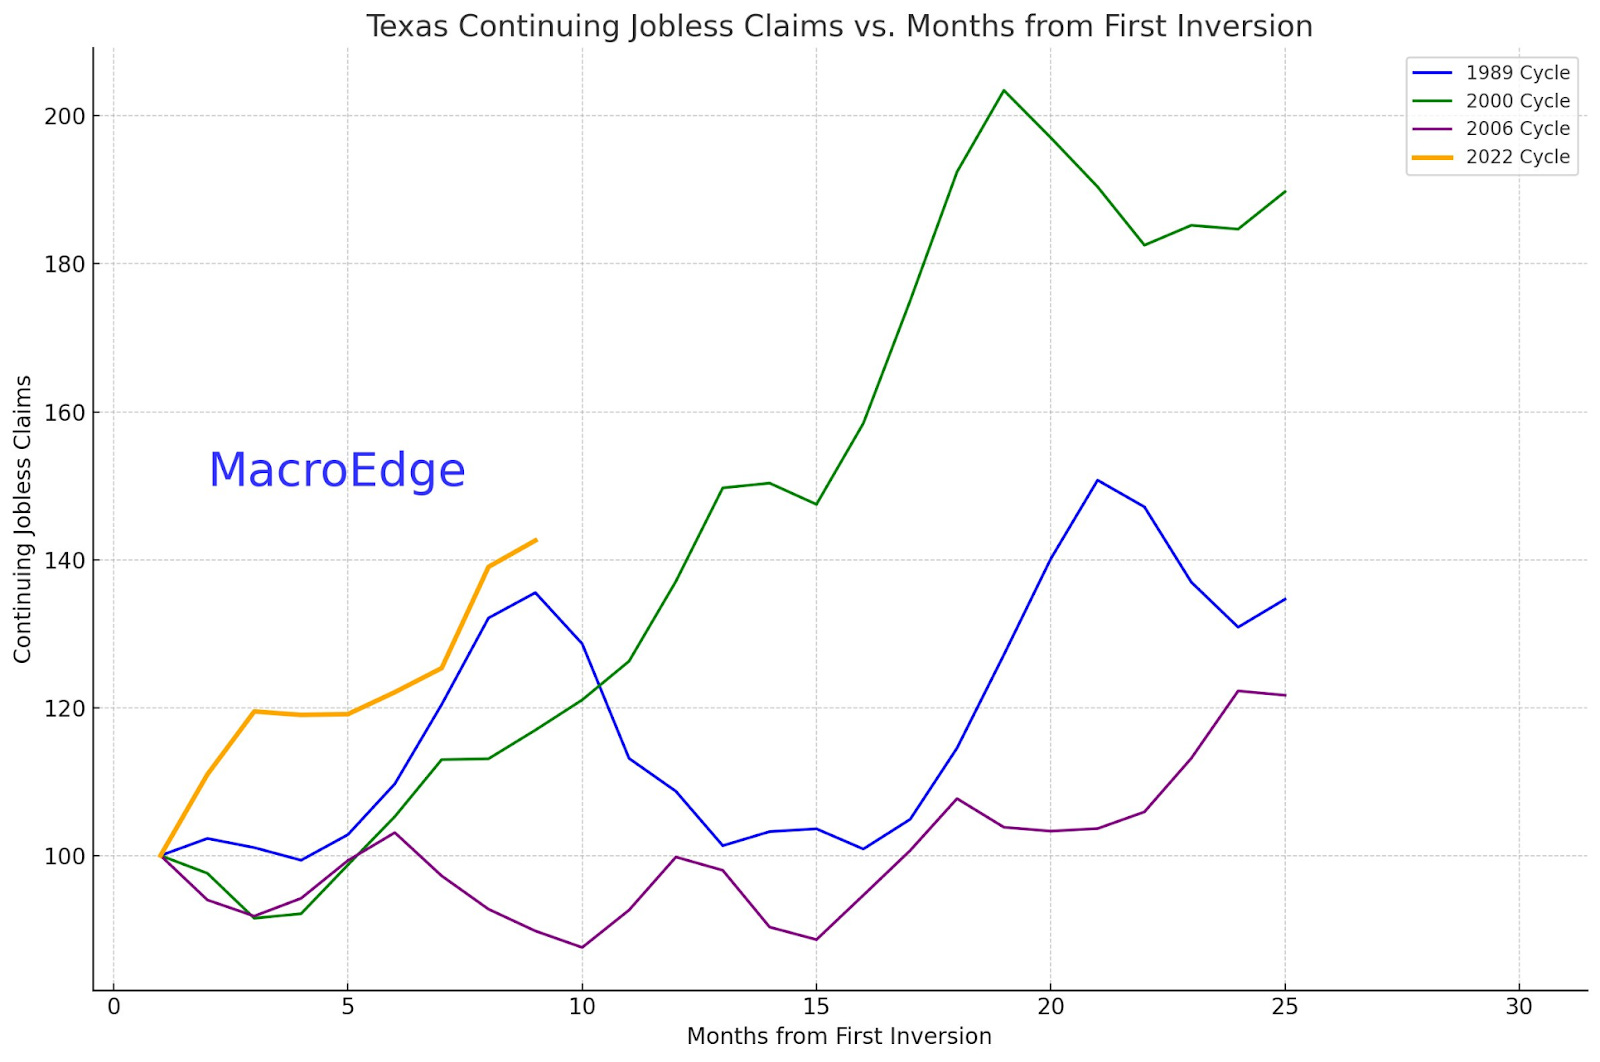
This comes also as we have ABNB heavy states like Texas seeing their housing inventories normalize back to pre-pandemic levels - which is in sharp contrast to the continued narrative we hear about catastrophic housing shortages being the cause for high prices. Blame that on the rate lockout!
Lastly - I want to turn our attention towards Georgia, California, and Texas - the three largest states seeing sustained increases in their unemployment rate as well as continuing claims rate. This will absolutely be something to watch out for as potential lead for the economy as these state economies have historically had their employment data lag the national data, and now it appears that they are leading.
Continuing Claims Index for California (above)
Continuing Claims Index for Texas (below)
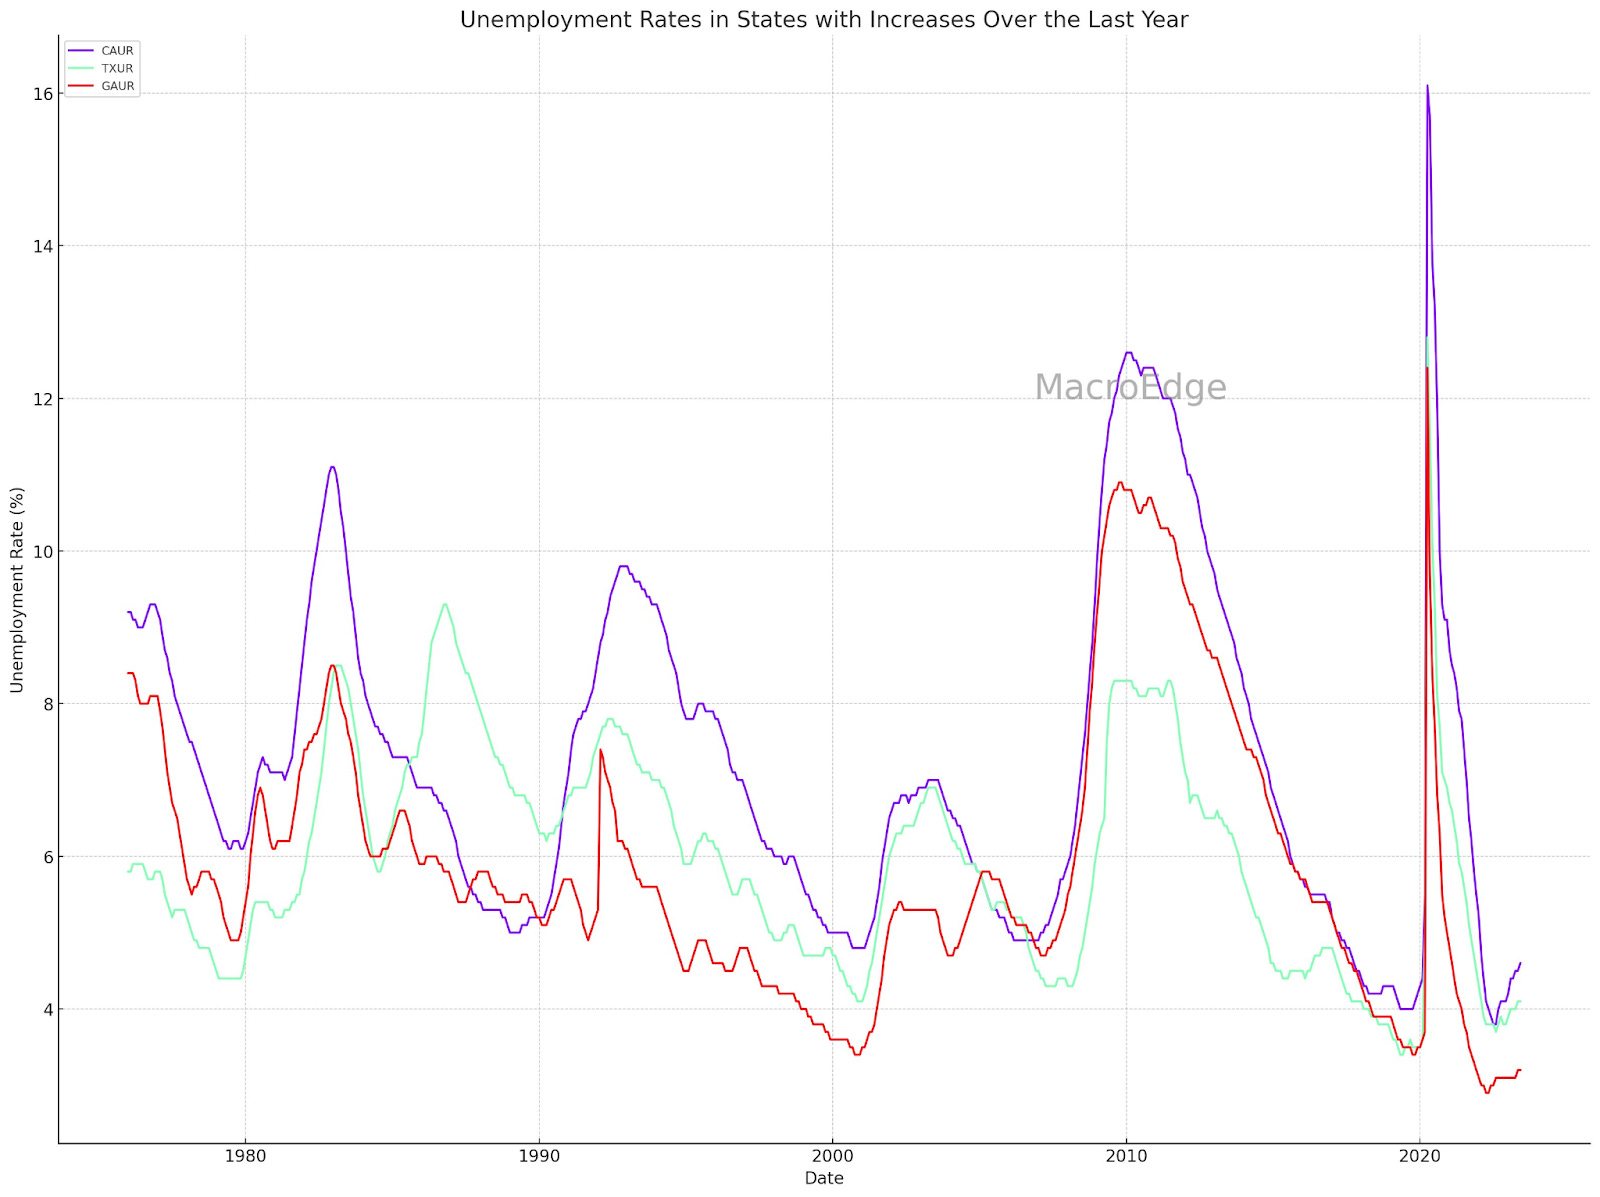
CA (purple), TX (green), GA (red), unemployment rates
We’ve got a huge week ahead with earnings and the wonderful Jackson Hole speech that could get volatility rolling… but in the mean time, don’t forget to claim your air miles from Frontier (I wish this ad wasn’t real):

Will Powell kill the markets this Fall for a second time and put in motion acknowledgment of the long-forecasted ‘recession’ - we shall see… until then, have a great start to your week.
Market Commentary and More (@SixFinance, MacroEdge Head of Research)
Yields Exploded higher this week with the 10 year Treasury yield hitting a cyclical high of 4.32%, sending Equity and bond markets lower. Mortgage rates hit a 22 year high moving higher with yields.
China takes a front seat in markets right now as a potential canary in the coal mine for the global financial system. It turns out when you shut down an economy for years for a germ, you make a real mess of things. Chinese home prices fall 3.09% month over month. China enters deflation, and cuts medium term lending facility rate 15 basis points this week. Chinese exports drop 14.5% YoY. China july retail sales, industrial output, and asset investment all missed expectations. They also as of this week announced they will stop publishing the dataset on youth unemployment. With a rapidly aging population due to one child policy and a last reported youth unemployment rate of 21.3%, this spells big trouble for the Chinese economy. Chinese banks were ordered to stop selling and start buying stocks. Private equity funds were “asked” to consolidate confidence in stocks, as Chinese indexes enter bear market territory. On Wednesday, the World Trade Organization ruled that China tariffs on US goods breached international trade agreements. On Thursday, Chinese property goliath Evergrande filed Chapter 15 bankruptcy in New York.
“I am concerned that we will become the object of China’s frustration and that will tempt them to lash out. I think we need to be very careful in our approach to China at a moment of this kind of difficulty and we need to be more attentive. I think some of the policy advocates in Washington are too avoiding a situation where we terrify China with potential economic damage that we are going to do to them,” Former Treasury Secretary Lawrence Summers said.
We must remain vigilant for a further and potentially rapid cascading decline in Chinese markets potentially throwing the entire region into contagion. We must also watch for a potentially accelerated timeline on a Taiwan event.
Also in the region, Japan printed a 6% annualized GDP growth. USDJPY rose off this news with USDJPY only 4 handles off the more than 30 year high. While Japans’ GDP numbers may look great from a birds eye view, its’ important to note that while GDP is up, the contributing factors are an influx of tourism and prices coming down, with many internal facets of economic health showing meaningful declines. Exports also fell YoY for the first time since February of 2021.
Back on US soil,Empire state manufacturing survey falls from 1.1 to -19, below -1.0 expectations.
NAHB housing index falls from 56 to 50, below expectations of 56. Popular retail bond vehicle TLT tanks, only about $1 above the lows of the cycle. Long medium and long duration bonds are tanking with new lows being put in almost daily. Fitch ratings, who recently downgraded the US Credit rating, discussed potentially downgrading major US banks including the big four. In a humorous and hypocritical display, Goldman Sachs blamed 0 day to expiration put options for this weeks’ sell off, despite being quiet for months as 0 day to expiration call options fueled much of the YTD equities rally and putting in record volumes while doing so. One year default rate on US loan borrowers soars to 4%, eclipsing 2.7% on high yield (junk) bonds. The US also announced that Ukraine will finally be getting f16 jets via Denmark and the Netherlands. At least 61 to be delivered. This week we have both NVDA earnings on Wednesday(which I have spoken at great lengths already as the fuel for much of the YTD equity rally), and Federal Reserve Chairman Powells’ Jackson Hole speech, which fueled a steep sell off following his 2022 meeting. I expect the FED to reiterate higher for longer on rates. I do not believe the market's current pricing of the first rate cut early 2024 will be alluded to or stated by Powell at Jackson Hole. Barring serious economic turmoil in the coming months, which is very possible given the deleveraging that is needed by the global financial system, rates will as Powell continuously reiterates (although markets don’t seem to listen) be higher for longer.
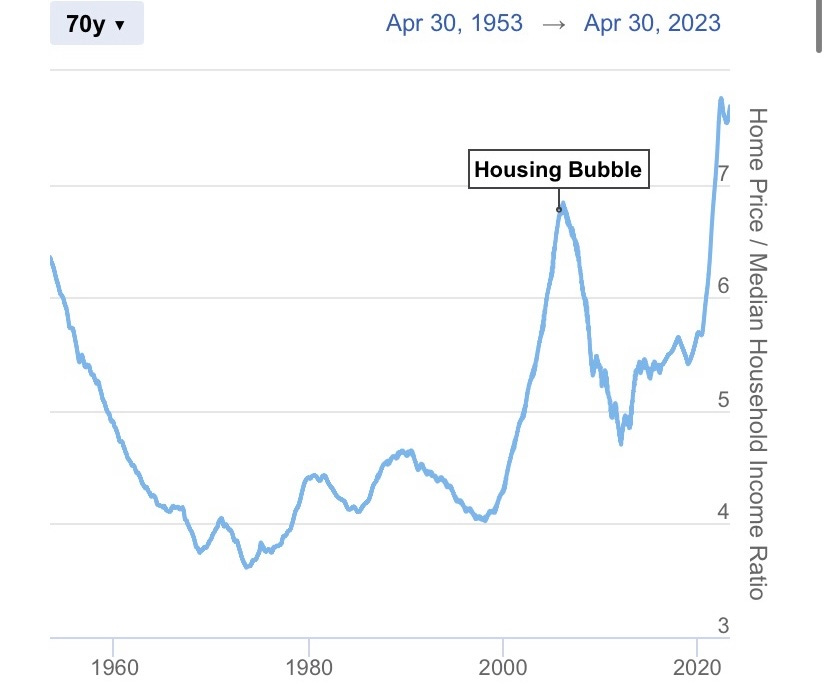
*** Watch housing. Housing continuous to be in a bubble (worse than 08’ on a relative basis)in terms of simple median price to median income. Add in high cost of debt servicing on an asset that is already in serious bubble territory, and we’ve got trouble right here in river city.***
The Hitchhikers Guide to Real Estate (@MrAwsumb, MacroEdge Contributor)
"Far out in the uncharted backwaters of the unfashionable end of the western spiral arm of the Galaxy lies a small, unregarded yellow sun." Okay, maybe let’s not take it back to the beginning.
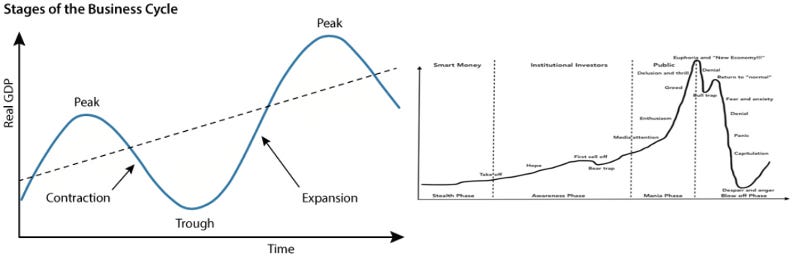
Wouldn't it be handy to have a compass to read where we're at in the cycle? Do bubbles exist?
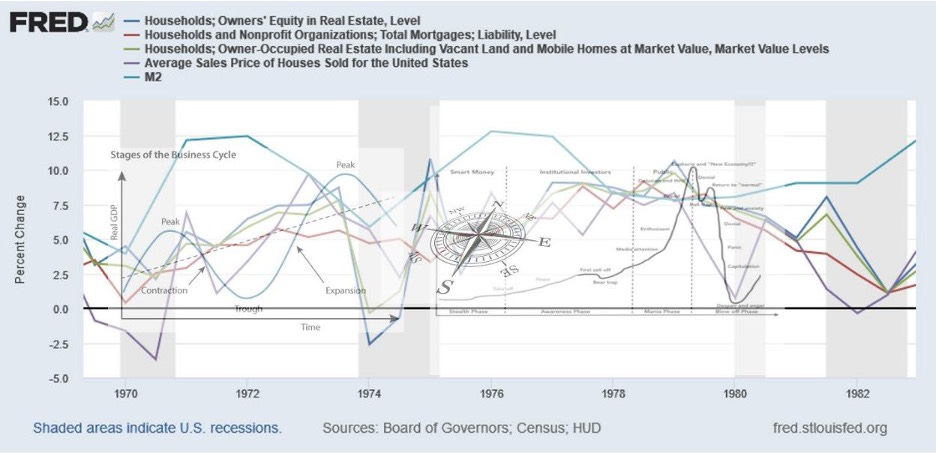
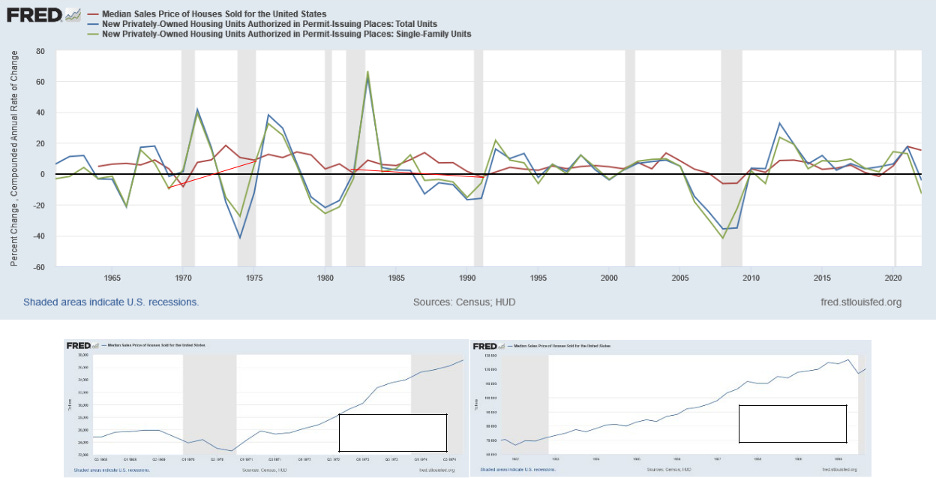
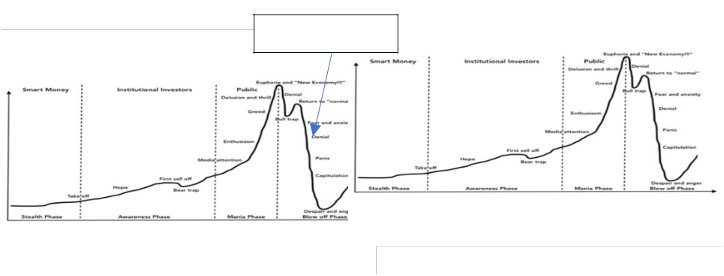
Let's begin somewhere in modern times. Real estate, as all businesses are cyclical. This mocked-up graph above shows real rates of change, along with these two well-known graphics:
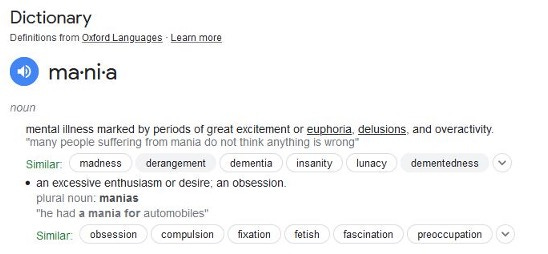
Now while both represent something accurate, both are also not always accurate. These cycles can take many shapes. What they show is the amount over time, or rate of change depending on how you are viewing them. Here's a chart of the Median Sales Price for a new home. Kinda looks like Mania, right?
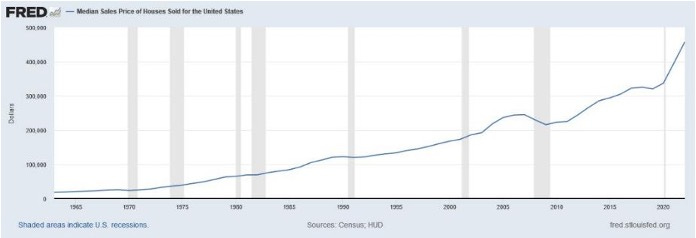
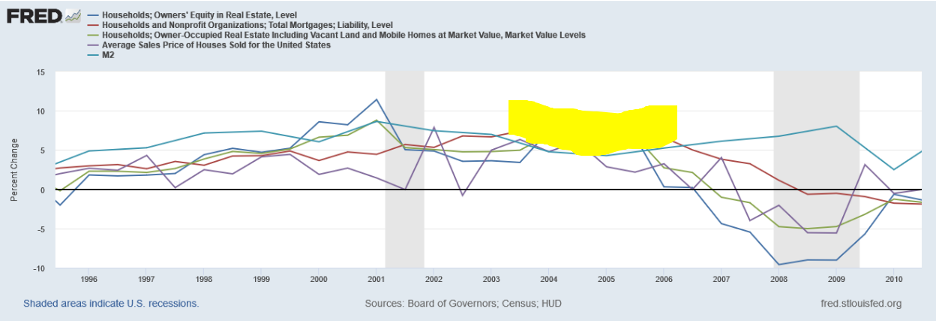
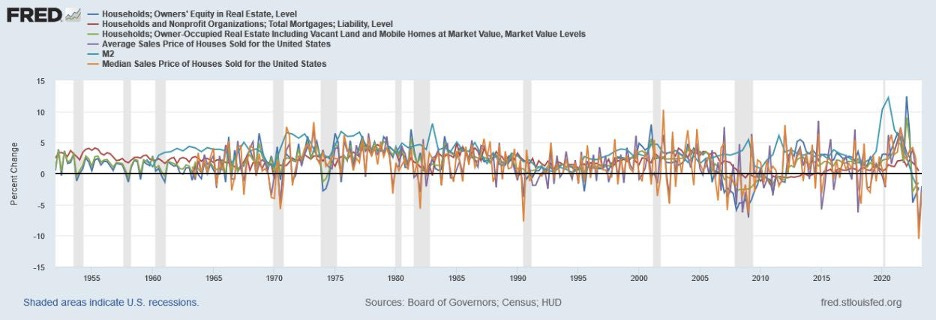
The reality is the chart shows the overall volume of dollars, spread out across a very long time. And doesn't paint an accurate picture. Despite being able to vaguely see some bubbly spots and drops in recession. Let’s take another look at that chart, over a long time, but measure the rate of change:
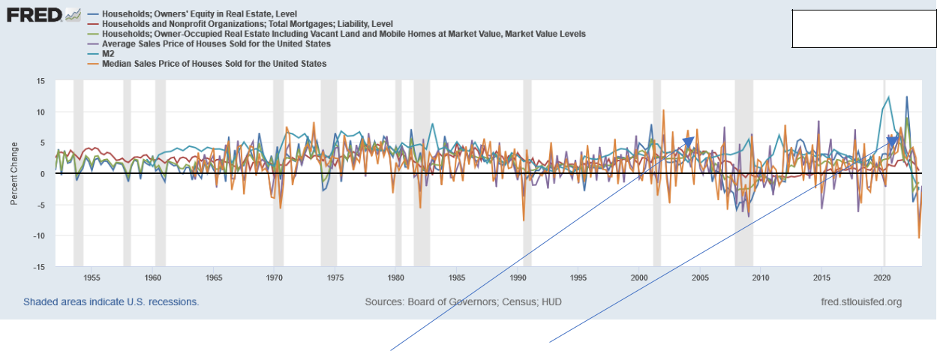
In the graph above, we can compare the rate of change of Equity, Mortgages, Value of Real Estate vs M2 Money supply (everyone does this for money, and none of it works without money, right?). So the blue line floating above all the other bands is the rate of money supply, or “the cycle” of money as relating to real estate. Every spike above that level of M2 is “a bubble”. No cycle or business operates up and to the right at a direct 45-degree march continuously forever. It has multiple factors that contribute to difficulties of “peak” performance. Below, you can see the cycles of permitting for construction. I added red lines so you can see the shape of the cycle. In 1970 we see there was a huge effort “construction starts” (cycle start) with a peak in sales price (Peak) of the cycle towards the end of the cycle despite inflation, it was a very normal-looking cycle. Compared to the 1983 cycle start of construction, the sales price peaked “late” but the return was spread out more evenly between all years. Below that is the “volume” of dollar change to the median sales prices from 1970-1975 on the left, and 1982-1990 on the right.
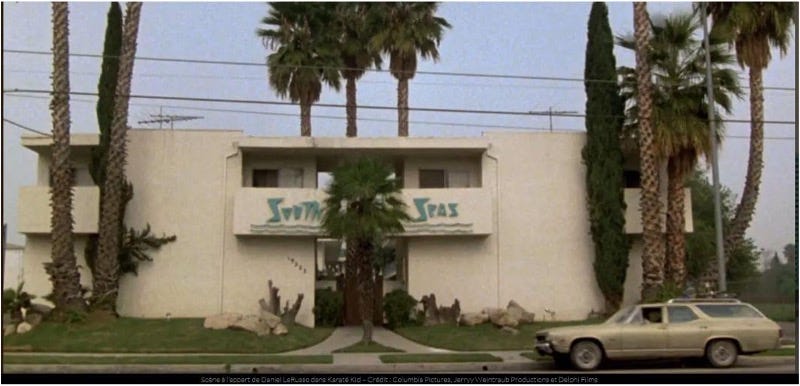
"Let's take into account that part of the cycle is not just homes. In the 60s/70s cycle, they were building mid-century gems like this:
And in the 80s, we made sure to build office towers and radical shopping malls like these:

Fun fact: Nakatomi Plaza, er I mean Fox Tower, was actually completed in 1987. Also, Pine Bluff Mall in Arkansas is 100% empty and for sale if anyone is interested.
Speaking of 1987: The green “spike” at Q1 1987 is commercial real estate mortgage asset level.
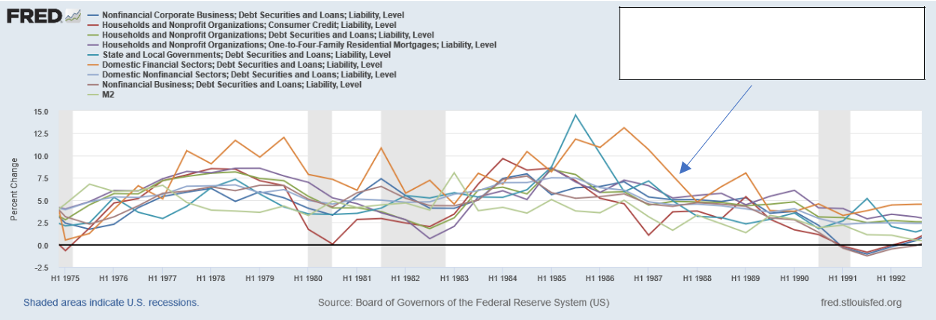
Black Monday again, but with domestic financial debt securities liability level.
Let's fast forward. In the early 2000s, people were building and buying homes like mad. And building these:
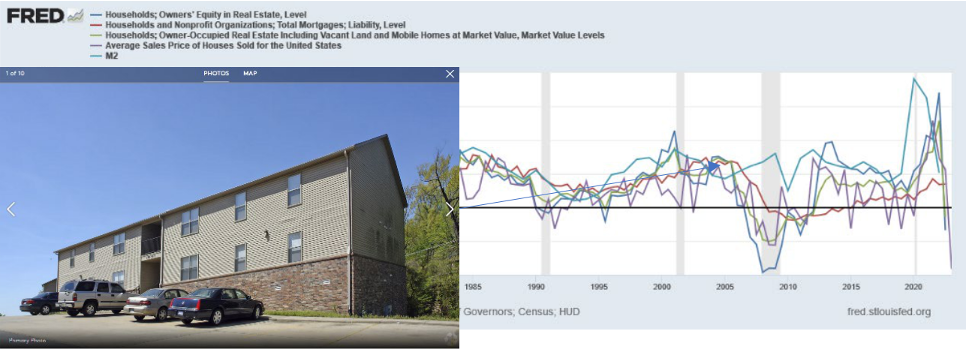
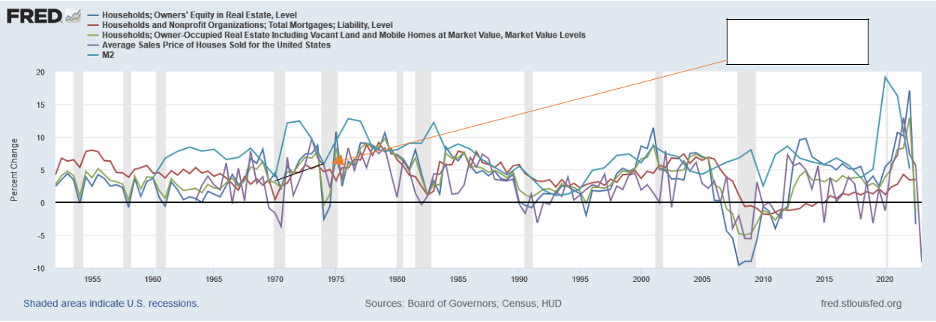
Sounds familiar, doesn't it? Let's zoom in. The highlighted area is the “bubble” above M2.
Compare to:
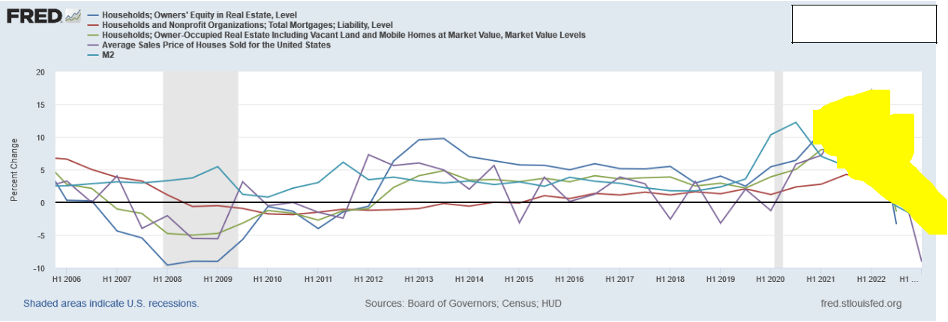
You are here
Another way to look at it is, once the liability level surpasses equity and money supply, things break. See 2005 vs Current. From 2005 to 2006 liabilities extended beyond the rate of change of equity and money.
And again, we've extended liabilities beyond the rate of change of money and the ability to generate it This is as of Q2 2023.
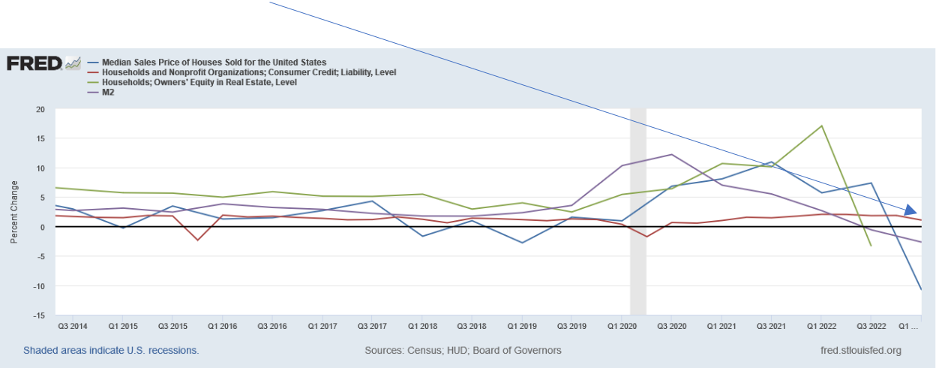
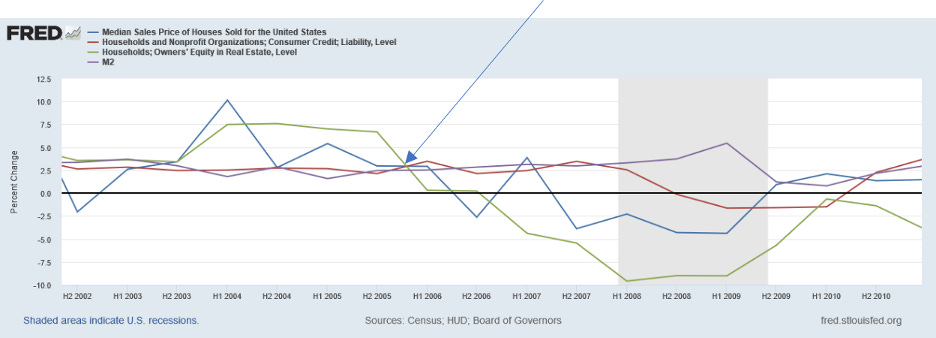
Let's expand the timeline a bit and add the median sales price in:
You are here
Here’s the median sales price peak of 2005 and trendline down into 2009. Vs. the median peak at 2021 and continued slide.
Now, you may be thinking I'm leading you astray, but I assure you these bubbles are being monitored by the galactic overlords as well. Here’s proof:
Gretzky is denied!
I was this close! I touched it.
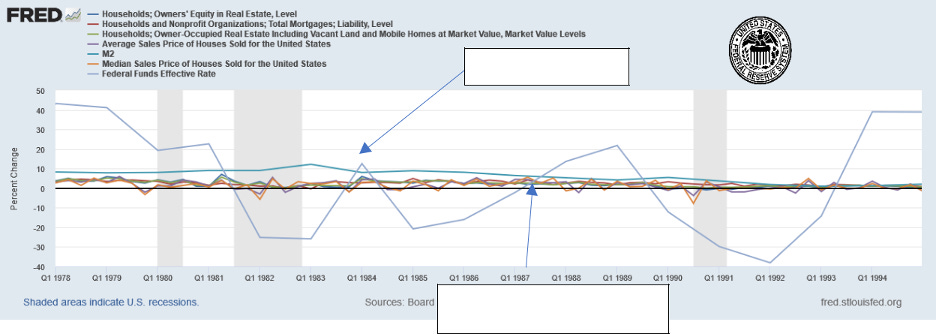
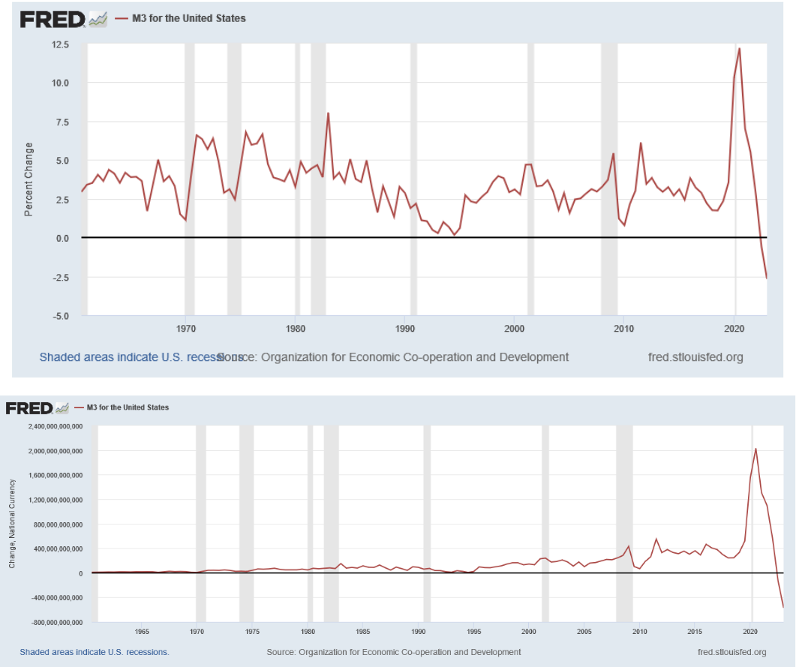
Notice how every rate of change increase getting closer to M2 deceleration, we see the change of pace of the federal funds effective rate increase to encase the “bubble” or peak of rate change increase. There's an attempt to stave off the increasing rate or encapsulate bubbles. In reality, the federal funds rate of change needed to encapsulate rate of change increases in 2021, not 2022. And 2003, not 2004. And 1986, not 1987. Another note: At no other time in this timeline has M2 rate of change continued to decrease into negative territory. In fact, here's a look at M3 money supplies rate of change and dollar change:
What sets the bubble areas apart from the rest of the cycle? A couple of things. First, a fundamental misunderstanding of business cycles, and that recession is both natural and necessary. You output energy/capital, then you need to recuperate for the next output. Recessions don’t have to be completely deflationary, as we’ve proven. Second: Debt, and a fundamental misunderstanding of debt. If you plan on your investment being worth more in the future, but don't plan for the increased costs including debt associated with it, then as the kids say you're NGMI.
Thirdly, FOMO. The fear of missing out, keeping up with the Joneses, a psychological reaction. Mania.
Every cycle has it, and as this latest cycle, it travels faster than ever before. These used to just be yellow signs at random corners advertising to “teach real estate investing:
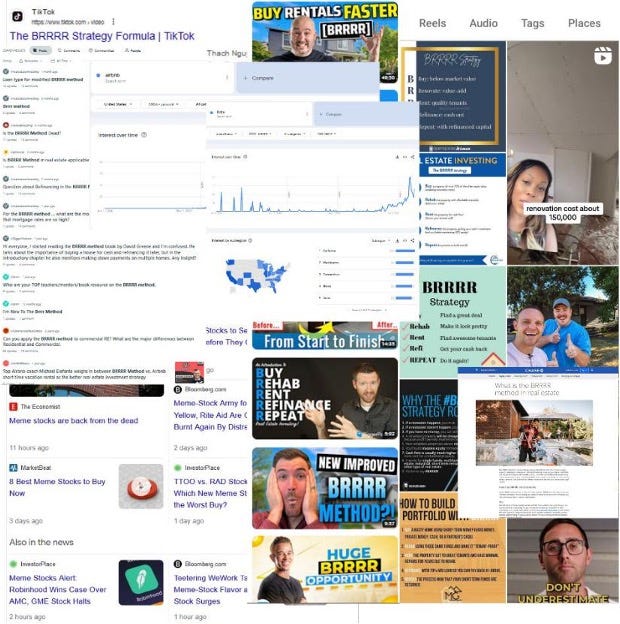
From BRRRR (even you, JPM?) to meme sto(n)ks, Airbnb, yolo, 0DTE options. Easy debt and lack of fundamentals. And these aren't street corner signs anymore. It's every social media platform on earth and lenders willing to participate.
"The Hitchhiker's Guide to Real Estate"
Remember this chart from just a moment ago?
For our final view, from the ship we’re hitchhiking on, here is this exact same chart, from space, with only one addition: Federal Funds Effective Rate.
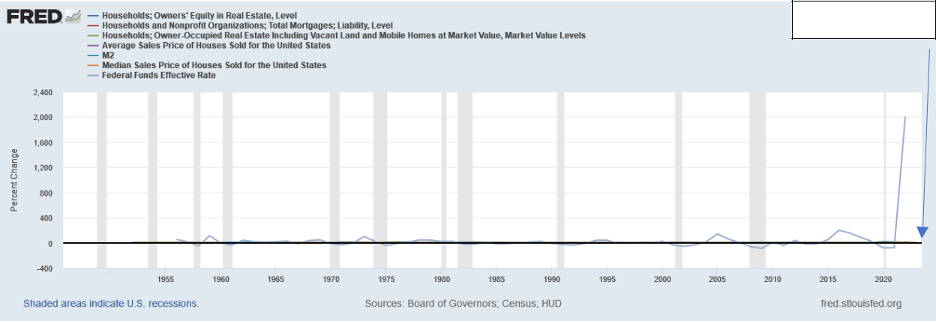
You are here
Now, since “nothing travels as fast as the speed of light, with the possible exception of bad news, which obeys its own special laws”, let me leave you with some hope. While this cycle is ending, there’s always another one, it just may take a while and may be different than any of us expect.
You are here
Make sure to subscribe and read next week's MacroEdge for more. - @MrAwsumb
Why Friday’s Jackson Hole Symposium Matters More than Ever (@RealJohnGaltFla, MacroEdge Contributor)
The constant debate between television economists and FinTwit commentaries (Financial Twitter) is that the statements and papers submitted by Federal Reserve members, including the Fed Chair, are only relevant in the spectrum of an ongoing or potential major financial crisis. However, it is this author’s opinion that the current chairman, Jay Powell, inherited a slow motion train wreck from his two predecessors Ben Bernanke and Janet Yellen, which makes every word spoken or written at Jackson Hole more important than ever.
To understand what has been happening after the ten year period from 2008 to 2018, the latter being the year Powell took over, it is worth delving into key statements and summations from each of Jay’s speeches and reviewing the market reaction afterwards.
I. August 24, 2018
Federal Reserve Chairman Jay Powell’s speech:
Monetary Policy in a Changing Economy
This statement is the key excerpt for reference at that time and now, this current era of economic dislocation.
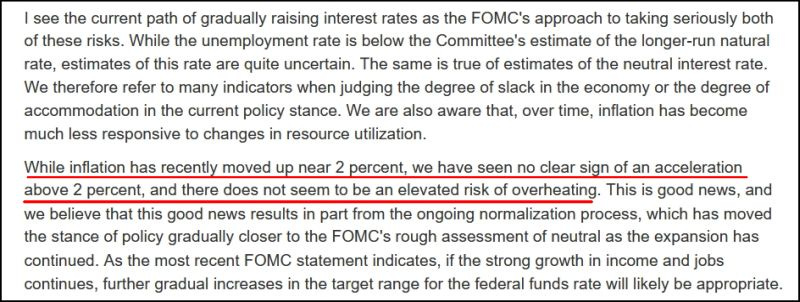
Times were good. The initial shock of a Trump election win seem to have stabilized and resulted in moderate economic growth. The tax policies brought some degree of relief to consumers and the initial financial risks seem to have faded allowing for increases in greater speculative risk in markets.
Unfortunately for Chair Powell, his predecessors failed to tell him about the lurking financial crisis in the banking system which was simply postponed from 2009 and serviced by the taxpayer. In October of 2018, just two months after the speech, equity markets caught a whiff of this problem and in December began to liquidate positions in anticipation of a 2019 financial crisis.
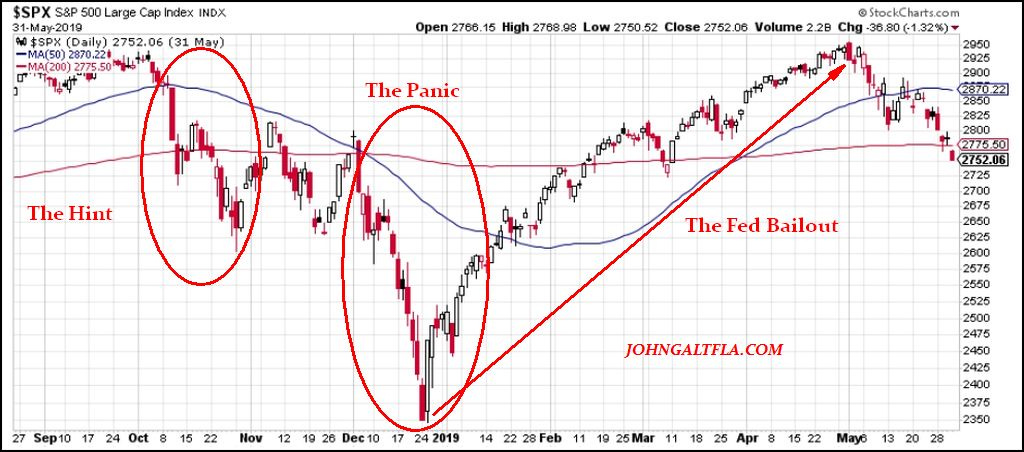
If it were not for a leaked statement from the Federal Reserve on Christmas Eve of 2018 reassuring the markets that QE was not dead and the Fed would still backstop the major bank’s garbage collection, odds are America would have experienced a major recession in 2019. Instead the Fed and the rookie Chairman Jay Powell simply postponed the day of reckoning.
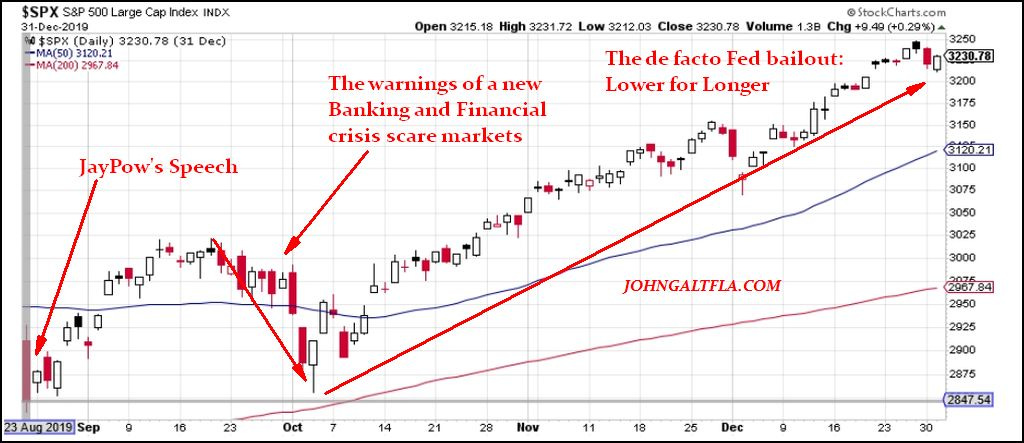
II. August 23, 2019
Chairman Powell’s speech had a definitively different tone in 2019:
Challenges for Monetary Policy
The following excerpts might justify renaming that speech “Arrogance of the Gods” because the warnings were there.
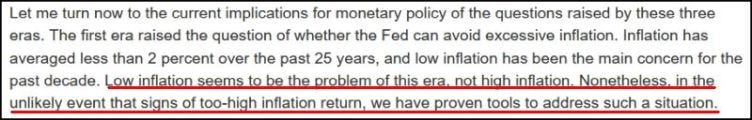
The tools however, were built on models conceived in the early 1980’s and during the 2007-2009 GFC.
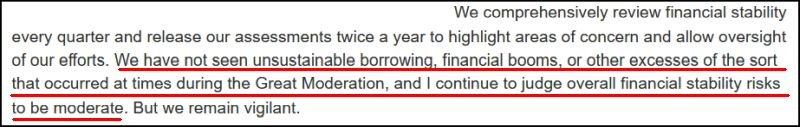
The Fed and Jay Powell determined the stability risks to be “moderate” however others disagreed. Mervyn King, the former head of the Bank of England stated during an IMF presentation in October 2019:
“Another economic and financial crisis would be devastating to the legitimacy of a democratic market system,” he said. “By sticking to the new orthodoxy of monetary policy and pretending that we have made the banking system safe, we are sleepwalking towards that crisis.”
The equity markets sniffed this out also during the Jackson Hole speech until the October FOMC statement which was interpreted as “lower for longer.”
III. August 27, 2020
New Economic Challenges and the Fed’s Monetary Policy Review
The S&P 500 chart displayed above was cut off by this author to not include the Covid insanity which happened in February and March of 2020. But heading into Jackson Hole, WY, the “virtual” symposium was interesting as hell, needless to say.
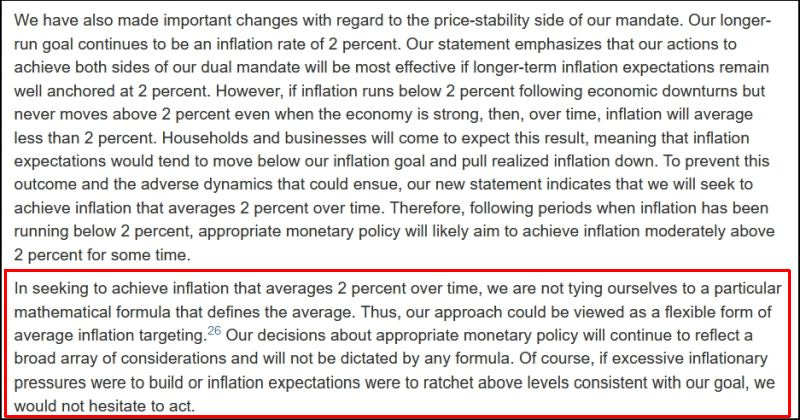
Unfortunately for the Fed, political instability at that moment in conjunction with economic instability due to the pandemic created the perfect formula for mistakes on all sides to be made. Thus the markets viewed this new period of economic distortion poorly as none of the institutional models could interpret how to react to monetary policy expanding inflationary policies while fiscal restraints were non-existent politically.
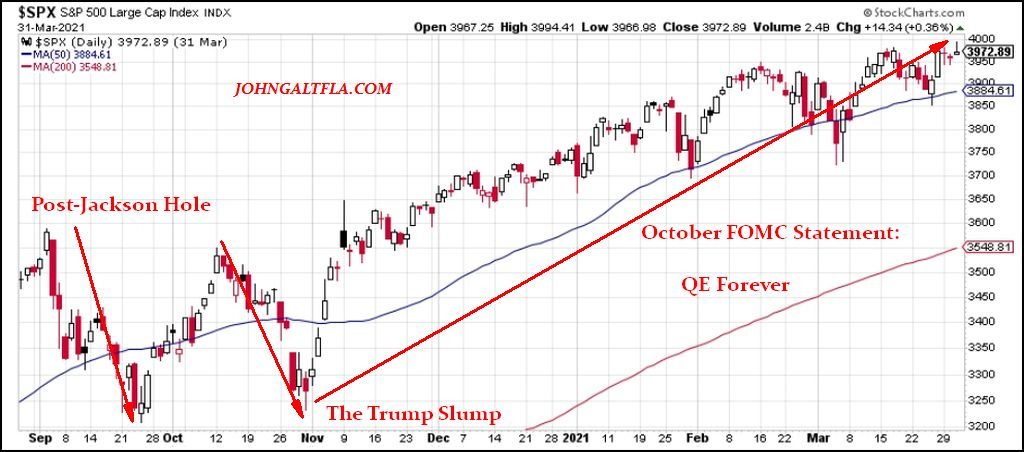
The die was cast with the October 2020 FOMC statement which said:
To support the flow of credit to households and businesses, over coming months the Federal Reserve will increase its holdings of Treasury securities and agency residential and commercial mortgage-backed securities at least at the current pace to sustain smooth market functioning, thereby fostering effective transmission of monetary policy to broader financial conditions. In addition, the Open Market Desk will continue to offer large-scale overnight and term repurchase agreement operations.
Add in the election of a leftist government by the American citizenry just two weeks later and the fuse was lit for an inflationary disaster.
IV. August 27, 2021
Monetary Policy in the Time of COVID
If anyone ever told me that this was going to work out for Americans worse than Jay Powell, then that Fed Chair would have to have been Bernanke or Burns. In his Jackson Hole speech, this statement demonstrated the blinders of ancient Fed modeling which left the door open for the nightmare that followed.
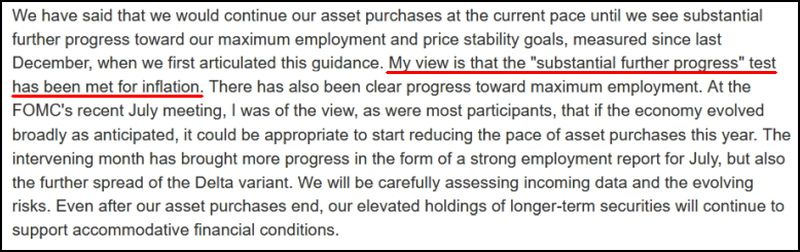
Needless to say, he failed that test also. When I penned a piece in August of 2021 titled “The Everything Crash of 2021,” I had no clue it would become the slow motion crash that has permeated throughout our society for the last two years and is still ongoing. However, the stock market reacted as one would expect with the blessings of QE∞ from the Fed.
The fuse was lit. The disaster obvious to everyone since May of 2021. Real inflation, 1970’s style inflation had arrived.
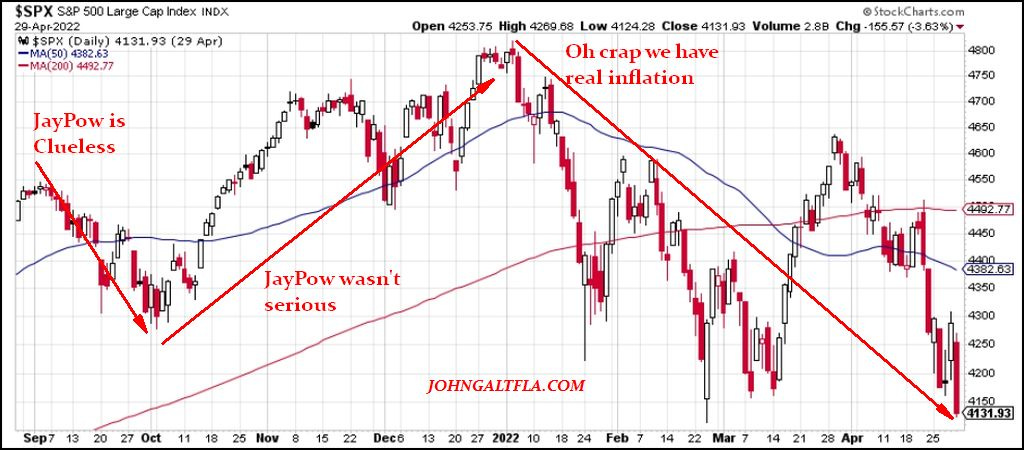
V. August 26, 2022
Thoust shall not anger the monetary gods.
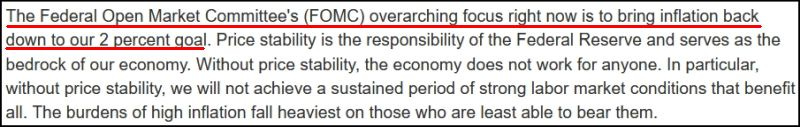
Monetary Policy and Price Stability
If there was ever a speech for the ages in Fed lore, this one was it.
He even looked angry. But was he serious this time?

Needless to say, Chair Powell had to say this to try restore the Fed’s credibility. But the equity markets were not 100% certain he meant it.
Despite all of the political posturing, the speeches, the outright lies (you really don’t believe your eyes do you?), the S&P 500 has yet to revisit it’s all time highs. The Federal Reserve has lost he faith of the masses and the investors are just tagging along praying that “this time” their brokers and television carnival barkers will not screw them over.
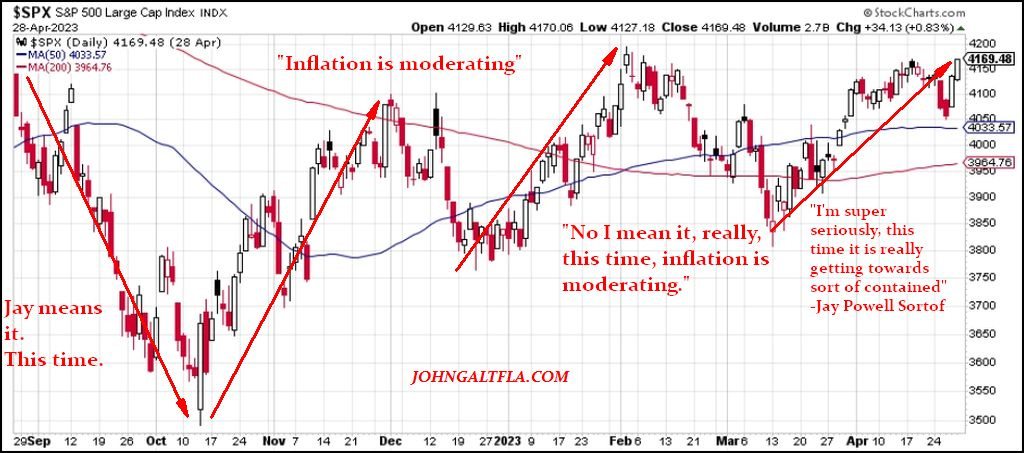
VI. August 25, 2023
There is a chance, albeit slight, that Jay Powell has learned a Greenspanian lesson to baffle the befuddled boobs with broadsides of BS. Odds are though, because he believes he is smarter than the markets, the elites in DC, and the masses he’ll make a speech of great consequence and once again misread the room. Inflation is not under control by any realistic measure as disinflation does not result in deflation at current levels, which means that prices will remain higher for longer, further penalizing the middle and lower classes of our society.
Prepare for impact everyone and yes, another classic Federal Reserve monetary policy blunder.
Great post, everyone! Great data and perspective....nuggets on housing and China are especially juicy.