
8/13 Weekly Report - Respect the Lag, Golden Handcuffs, Homebuilders, Student Loan Sledgehammer, and More
Join our contributors as they unravel the week's data and explore what lies ahead. Discover the lingering effects of the fastest hiking cycle in decades, rising property ownership costs, & more!

8/13 MacroEdge Weekly Release
@DonMiami3, MacroEdge Chief Economist
@TrishaSunFL, MacroEdge Contributor
@TexasRunnerDFW, MacroEdge Contributor
@GooniStonks, MacroEdge Contributor
@GregCrennan, MacroEdge Contributor
@SquirtLagurtski, MacroEdge Contributor
Weekly Data Dive and the Week Ahead (@DonMiami3, Chief Economist)
With so many contributor pieces this week - I will keep my piece very short… Absolutely fantastic that so many decided to join in for a piece this week and we’ll make sure to keep em’ coming for our readers (over 4,500 of you last month).
While charts and markets are covered below - our consensus continues to be that we are in the ‘long and variable’ lag period from the fastest hiking cycle in decades…
Here’s a few useful charts to keep tabs on where we are in this cycle relative to past cycles following inversion:
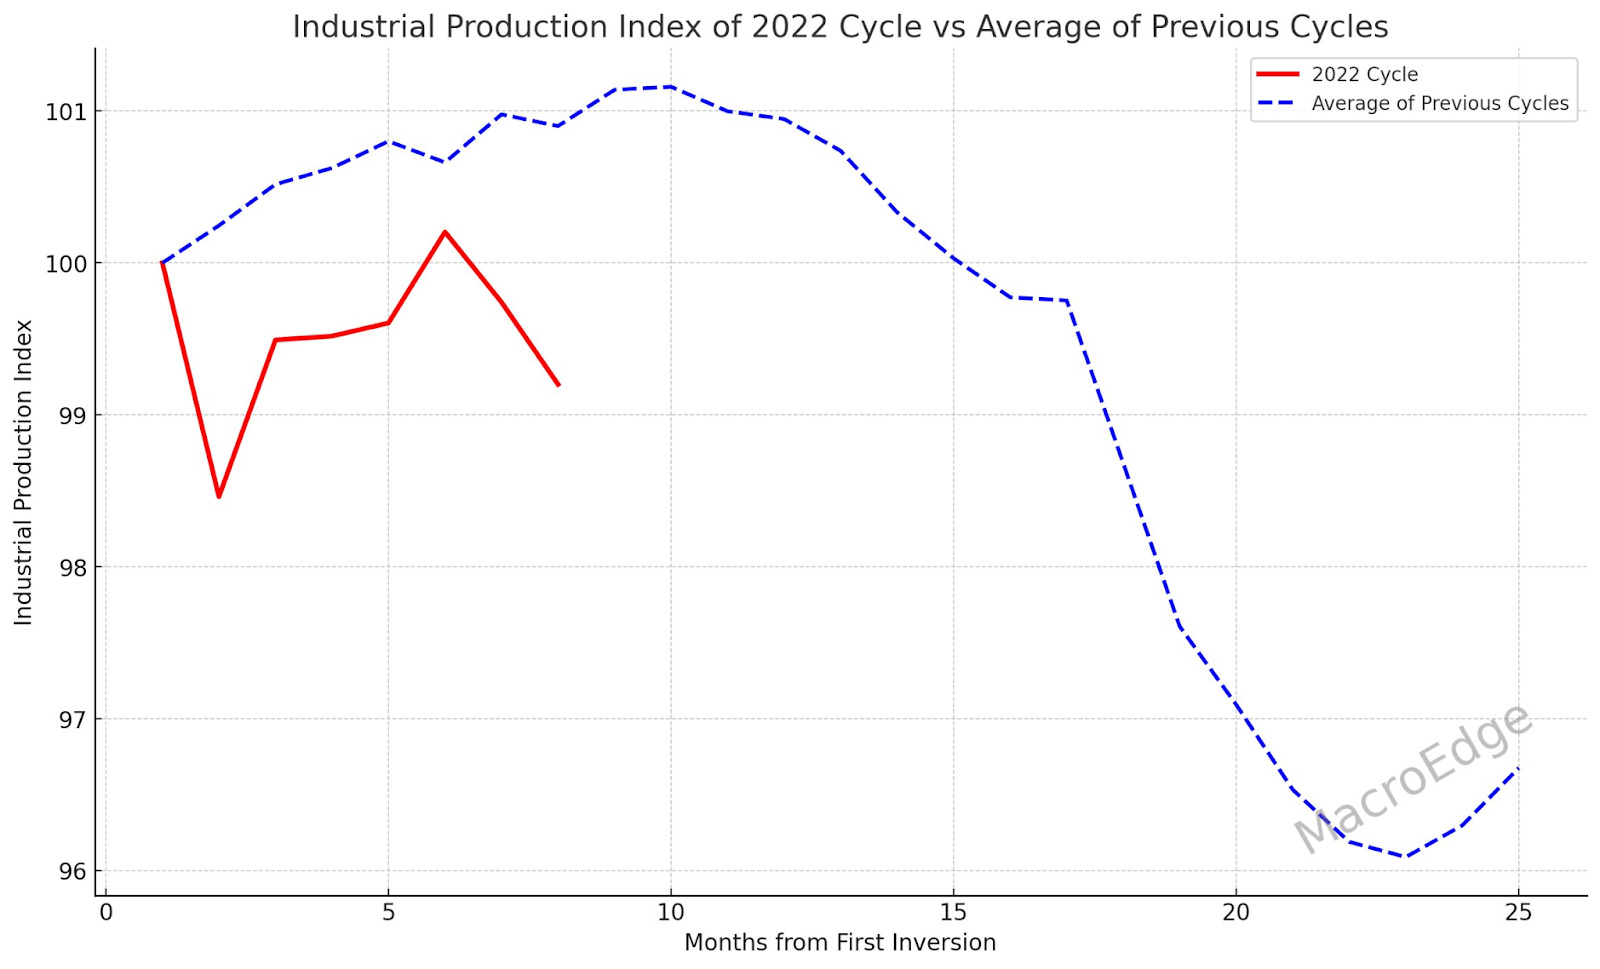
Updated Industrial Production Index (=100)
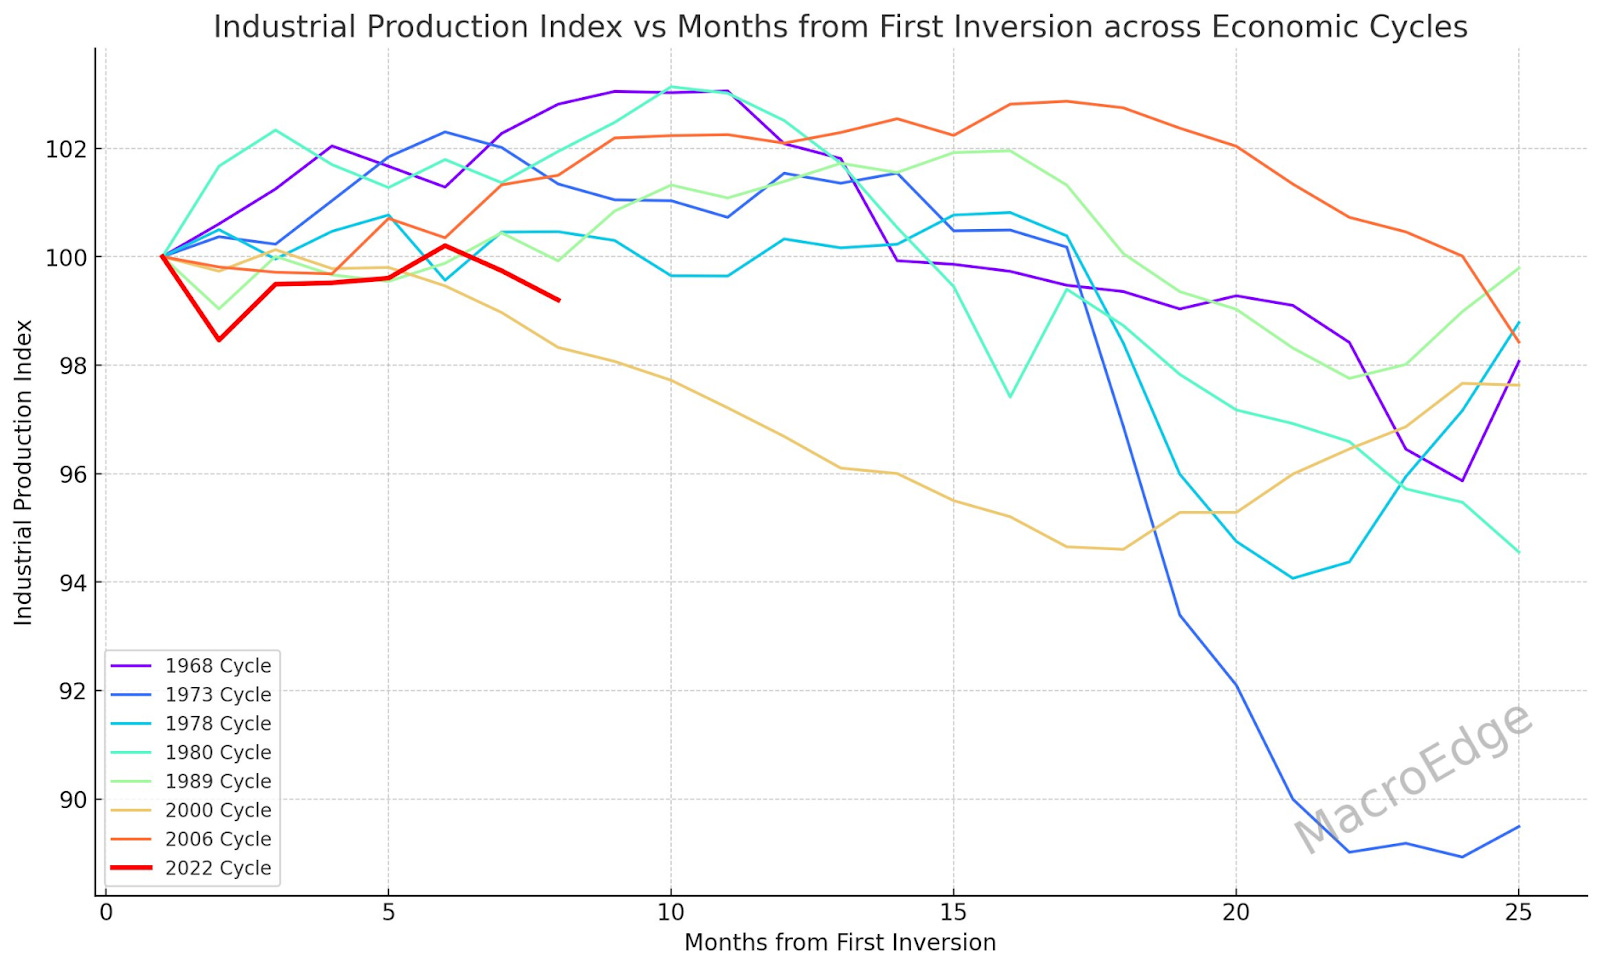
This chart includes our current industrial production index (red) relative to all previous recessions going back to 1969 along months from first inversion. While we are now 9 full months thru inversion - this data is updated through 8 and we get an update this week on Industrial Production so I will make sure to post the updated chart on Twitter. It’s obvious with employment and industrial production how long many of these cycles take and this average chart helps us visualize the lag time for Industrial Production:
Here’s a few other charts of note that I thought were interesting to top off my very short piece with. First, note search trends for Google for ‘Soft Landing’ going back to 2004:
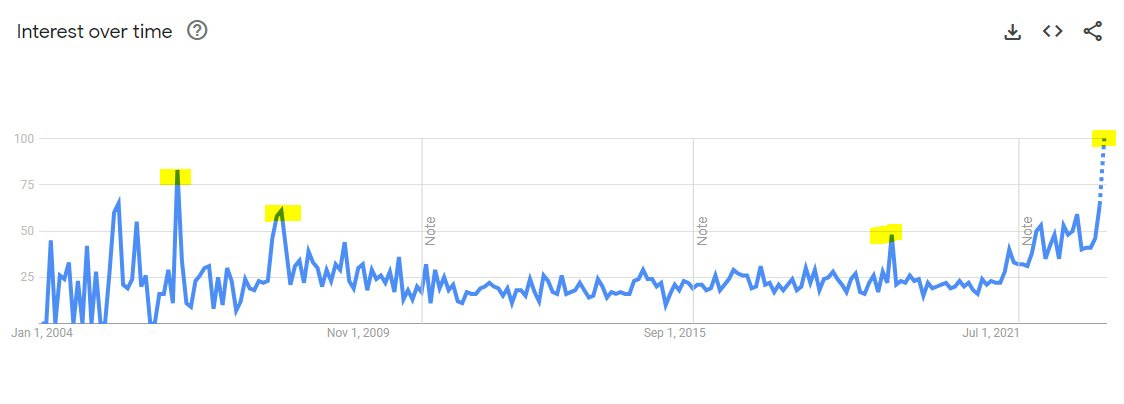
Peaks in search interest seen in July of 06, June of 08, September of 2019, and presently we are hitting a peak. Michael Kantrowitz of Piper Sandler has posted some great charts of interest and news searches for Soft Landing peaking before the hard landing arrives.
On a final note - check out current CTA exposure (they’ve been right once, as pointed out by Tom M. - chart credit to him):
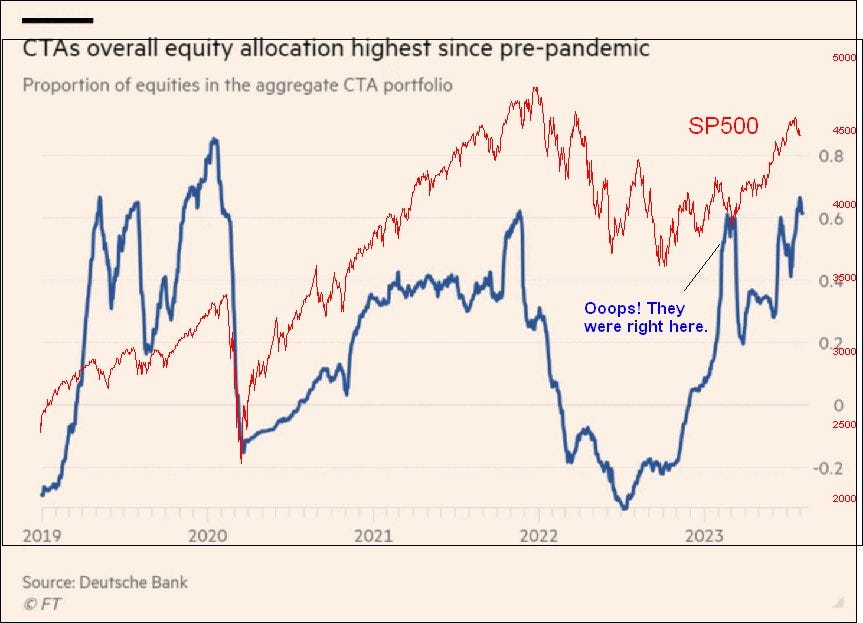
While it’s certainly not looking like a major pullback yet, we’ve lost that crazy parabolic trendline so it’ll be interesting to see how the rest of August shapes up.
Keep an eye on my Twitter for the latest data/news, as well as on @MacroEdgeRes - and have a great start to your week!
Property Owners with Golden Handcuffs Aren’t Immune to Rising Costs of Ownership (@TrishaSunFL, Contributor)
After rising interest rates created increasing issues with affordability that’s resulted in fewer sales, longer time on market and increasing inventory, we are seeing the lagging effects that rapid appreciation is having on property owners. I’ve written previously about the growing crisis we are experiencing in Florida with insurance premiums skyrocketing but now that it’s August, it’s time to discuss property taxes. In the coming weeks, Florida property appraisers will be mailing out TRIM sGatements to property owners. TRIM, which stands for TRuth In Millage, is part of the budgeting process for local governments and provides property owners their assessed value and proposed millage rates, the rate at which taxes are assessed.
While often expected, the amount of that increase can often catch some owners off guard, particularly whose Florida property isn’t their primary homestead and those that purchase the year prior. As a state that has long lured speculative activity and endured some vicious market cycles, legislation has been passed that provides protections to existing property owners. While highly beneficial to existing property owners, they can often lead to an unpleasant surprise for new property owners who without examining the method by which the prior owner’s taxes were determined.
Starting with the basics, there are two types of property taxes: ad valorem (based on the value of the property) and non-ad valorem (not based on the value of the property). For homeowners who make Florida their primary residence, they are able to claim a Homestead exemption. This exemption reduces the just value by $50,000 except for school board funding which is a $25,000 exemption. There are additional exemptions but for simplicity, I am only discussing the basic Homestead with the exception of Veteran’s with 100% disability that I will address later. Now again, these exemptions only apply to homeowners who make Florida their primary domicile.
Additionally, we have a benefit called the Save Our Homes (SOH) which caps the increase in assessed value. This protects both, Homestead residents and non-Homestead owners although, the amount of protection varies greatly. For Homestead owners, the cap is at 3% or, the change in CPI but for non-Homestead, that cap is 10%.
These exemptions can lead to significant savings to property owners that accrue over the years but when there is a change in ownership, the capped value is reset to the current market value effective the following tax year which can often lead to sticker shock for buyers which they don’t often learn of until a year after they close.
Take a look at these examples from 2021 sales. Both sales were from property owners who had Homestead and a significant built up cap in their assessed values. The 2022 property taxes were approximately double due to taxable value being re-assessed.

And the longer a seller has owned, the greater the amount of cap they have accumulated. I also mentioned, there are additional exemptions, the most significant being for Veterans with 100% disability who receive a 100% exemption on their Ad Valorem taxes. For an uneducated buyer, the tax bill they receive in the following year, particularly during periods of rapid appreciation, can be shocking.
Unfortunately, buyers are often unprepared for these significant increases as they are rarely explained, particularly if they don’t ask. And even when they do, due to subjectivity used by property appraisers in determining the market values & general lack of understanding, most professionals they would ask for that information are unable to provide an estimate.
While focused on the shock that is often seen by new buyers, given the rapid appreciation we’ve experienced over the past few years most if not all property owners should be expecting to see an increase in their bill come this November. In fact, one down side to the capped assessed values is even once prices begin to level off or even in the case of declining values, many property owners continue to see their tax bills rise as assessed values due to their accumulated cap remain well below the property appraiser’s just value. This was a source of frustration for many property owners following the Great Financial Crisis who didn’t fully comprehend the way in which the taxes were assessed.
So while many housing analysts continue to focus on narratives such as the Golden Handcuff theory, they fail to recognize that for many property owners, especially those who are second homeowners such as we have a high proportion of in Florida, will continue to feel the negative effects of the manic market we’ve experienced in recent years which will continue to motivate many to contemplate selling.
But this topic can go much deeper as we see this impact many classes of property owners and affiliated vendors who should be watching carefully what happens in the Florida real estate market in the coming months and years. This is the first of a three part discussion regarding this topic. If you would like learn more about the what loan servicers should be paying close attention to in the property tax market in Florida, I’ll be sharing more in a piece to be shared with @M3_Melody Substack. As we see the TRIM statements released, I’ll have some more insights for investors here on MacroEdge you won’t want to miss.
“Real Feel Inflation” (@TexasRunnerDFW, Contributor)
I’ve been in the early stages of training for a marathon this summer in the oppressive Dallas heat. Most mornings, I wake up and immediately look at my phone to see what the temperature reading is. But I’ve learned that in order to gauge what conditions are really like, I can’t just look at a numerical reading on a thermometer. I must also look at the dew point, cloud cover, and air quality. Together, all these pieces of information create what is called the “Real Feel” temperature. THAT number tells me how warm I am going to feel during my run.
CPI came in this week at a modest 3.2%. But, just as with air temperatures, we can’t just look at this one number to gauge what the state of inflation in the economic atmosphere really feels like. We must do a deeper dive.
There are over 200 categories of expenditure items calculated into the CPI, and these are arranged into 8 major groups:
• Food & Beverage
• Housing
• Apparel
• Transportation
• Medical Care
• Recreation
• Education/Communication
• Other Goods and Services
For an American consumer, the price of a few of these items hit the wallet particularly hard: Food, Gas, and Housing. Every week, groceries must be bought, and cars must be filled with gas. Every month, rent must be paid. So even if we see massive disinflation in other categories that bring down the overall aggregate CPI number, when these items remain highly inflationary, the consumer is going to feel pain. In other words, the “Real Feel” inflation is much worse than 3.2%.
In July, Gas prices picked up by 0.2% and grocery store prices increased by 0.3%. Owner’s equivalent rent is still up a whopping 7.7% YOY. All these numbers translate into real feel inflation that is significantly higher than 3.2%. So even though the narrative is, “Inflation is cooling,” the consumer isn’t really seeing or feeling it yet. Instead, the consumer is watching savings dwindle and feeling the heat.
The latest CPI reading tells us the tail risk on inflation proving stickier than anticipated, especially in some sectors, is very real. Markets are still trying to digest what this means. But in the meantime, consumers continue to have sticker shock at stores and are waiting and hoping for relief from this period of red-hot inflation. Like those of us who live in Southern states, a cooling off can’t come soon enough.
An Update on Homebuilders (@GoonionX, MacroEdge Contributor)
If you have been following the market this year, you could not have missed the epic run up in tech stocks. The Nasdaq or $QQQ has posted over 37% gains. Quietly under the surface, the $XHB, and index that tracks the homebuilders, has also rallied over 37% as well!
Traditionally, home sales, like tech stocks, would decline as mortgage rates rise, however this has not been the case in 2023. The rally has come on the backs of a peculiar set up in the housing space, one we have not seen in a very long time. Rising rates have caused a decline in existing home sales, leaving new home sales as a larger portion in the housing market than usual. This has given strong tailwinds to the builders, and justified their outperformance on the year.
Lets look at a couple charts:
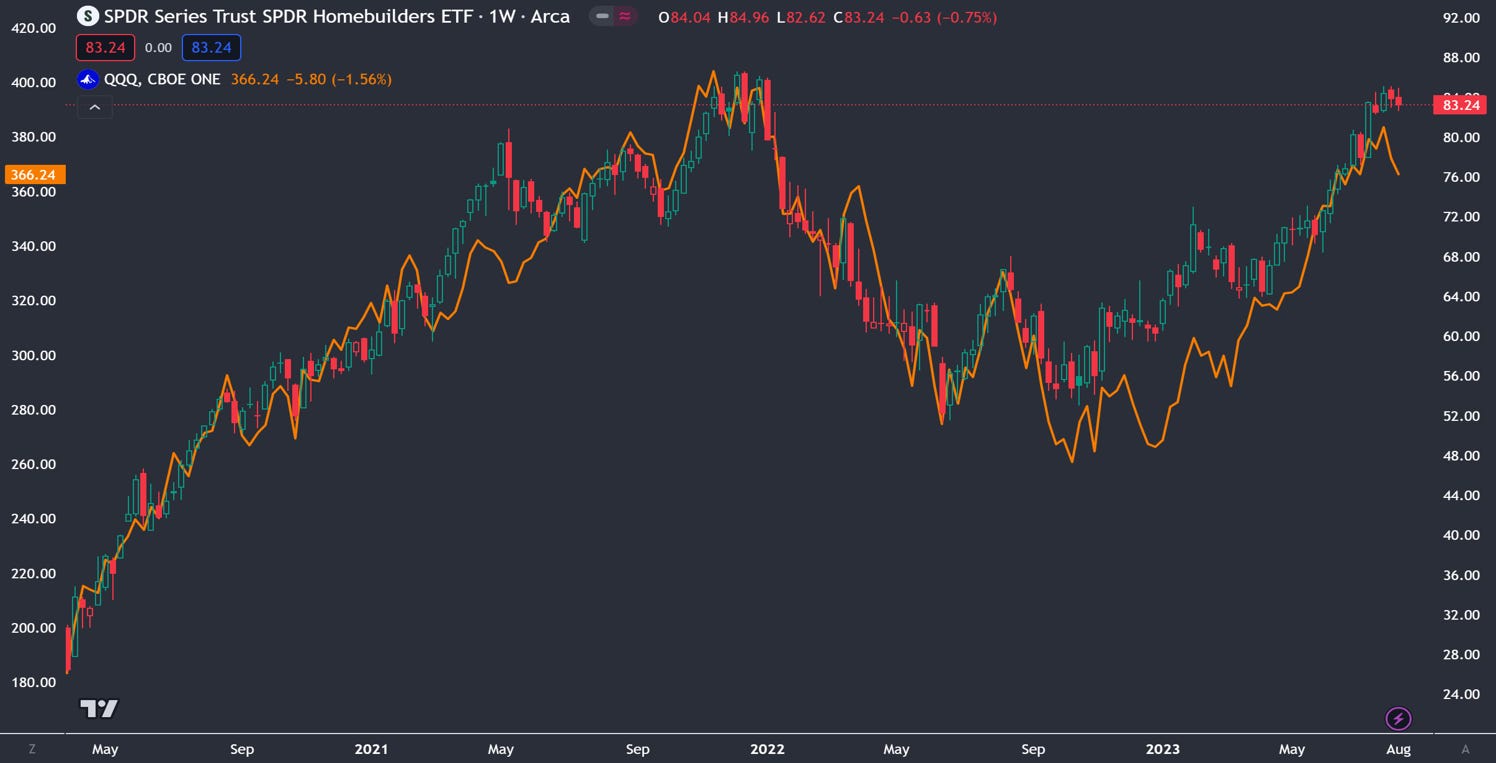
Above is a chart tracking the performance of the $QQQ and the $XHB. Quite similar, no?
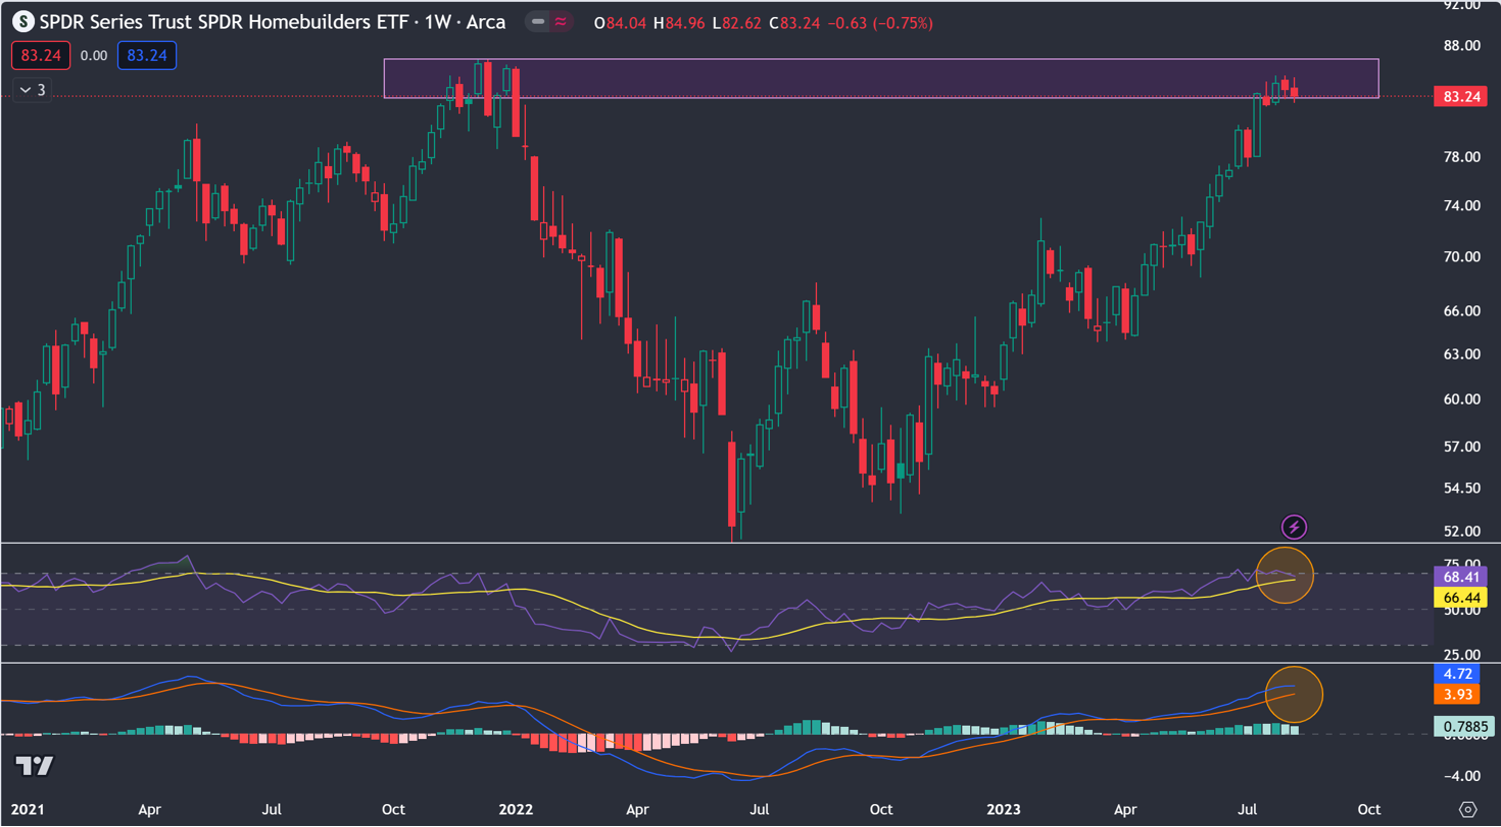
$XHB is nearing a level of key resistance, very close to its 2021 all time highs. It appears its relative strength is beginning to flat line in overbought territory as well as it is losing some momentum on the weekly chart below. This could be a sign that the outperformance YTD might be stalling out.
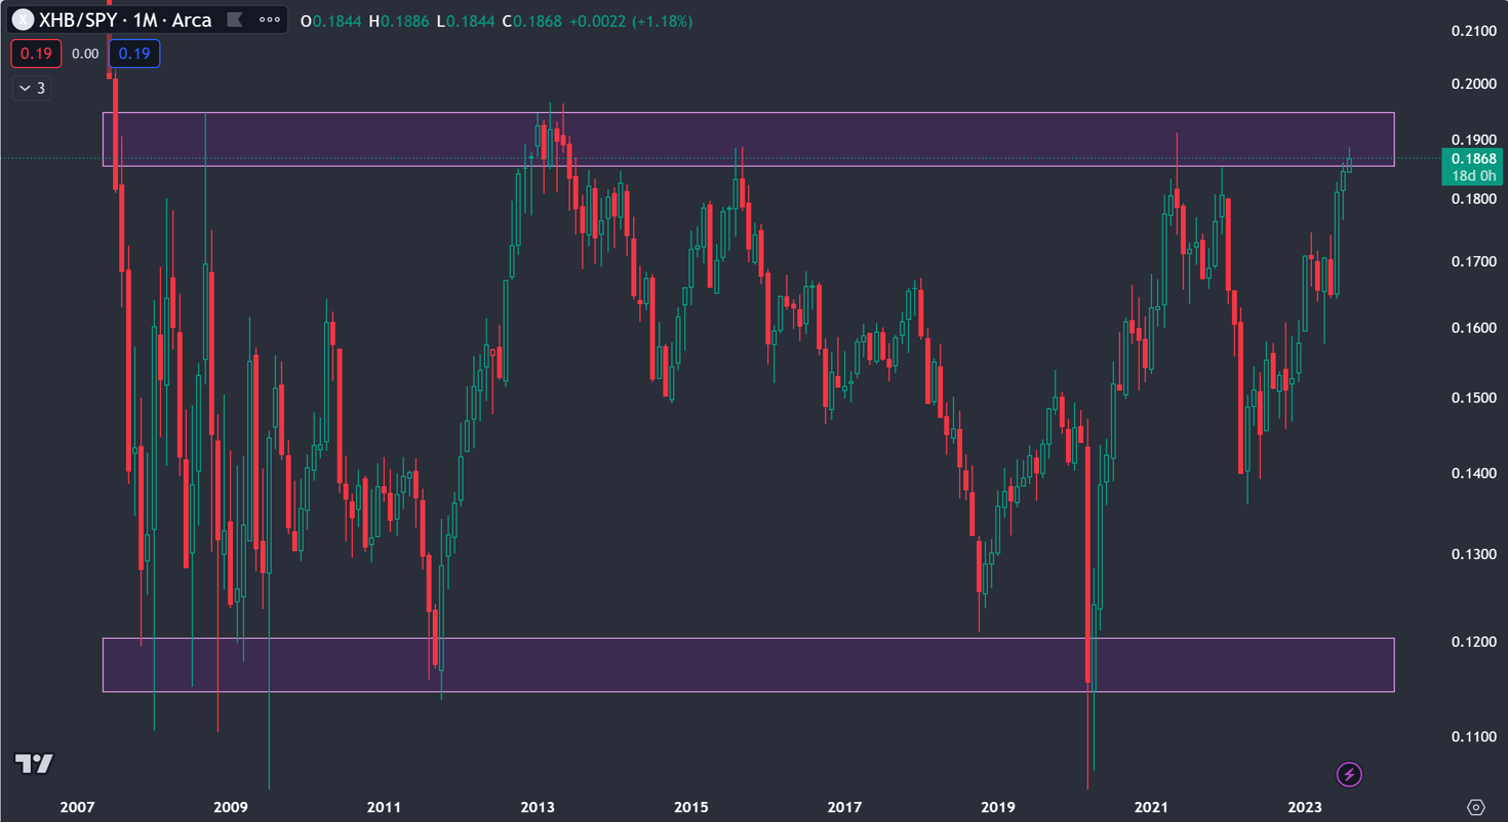
Coincidentally, $XHB has come to a similar level of relative performance to the $SPY, a zone dating back to 2008.
*Important MacroEdge Contributor disclosure: Full disclosure, I own options on the $XHB expressing a bearish view on the ETF that benefit from the price moving lower. All research/analysis is of my own opinion, it is not a recommendation and is not investment advice.
The Inflationary Nature of Deficit Spending (@GregCrennan, MacroEdge Contributor)
In the midst of concerns and heightened political issues surrounding inflation, the causation behind this phenomenon has remained shrouded in a veil of reluctance. The absence of comprehensive dialogue on the origins of inflation can be attributed to the fact that is exposes bad government policy, intricately woven within the fabric of government actions, particularly the expansionary fiscal policies that encompass surplus expenditure and monetary influx. This profound implications it carries, is an aspect often shrouded in the shadow of its intricate complexity.
At the heart of this conundrum lies deficit spending, a mechanism when the US government prints more money than it garners from tax revenue. This fiscal year, 2023, has witnessed an unprecedented increase of deficit spending at a staggering $1.7 trillion, a pinnacle that scarcely rivaled any precedent minus the 2020 pandemic-ridden era. This proclivity for deficit spending, conspicuously unabated since 2021, has substantiated claims of its nexus with inflationary pressures. While acknowledging the utility of measured deficit spending as an instrument for fostering economic expansion, the unchecked continuation thereof has culminated in inflation's ascendancy. The crux of this correlation stems from the irrefutable increase of the money supply, an inevitable consequence of unchecked deficit spending.
Astonishingly, 61% of government spending goes directly to bolstering consumerism without parallel productivity increase. Within this spending, social security accrues a notable 21%, corresponding to $1.7 trillion. This reliance, albeit aiding in averting immediate crises, remains a fragile solution, as the efficacy of these funds progressively wanes, with the value of these dollars dwindling by nearly 20% over the same time span.
An enduring relationship between government spending and inflation emerges from a historical backdrop spanning centuries, from the Roman Empire to today's United States. The surge in deficits by 20% in recent years mirrors an alarming 18% decline in the US dollar's purchasing power. While digital currency creation may offer a temporary solution and even a euphoric feeling, it inadequately addresses underlying issues, potentially worsening societal divisions in the country today & in the future. The urgent need for public awareness about inflation causality becomes crucial. Without this foundational grasp, effective solutions remain elusive.
The Great Resumption (@SquirtLagurtski, MacroEdge Contributor)
During the onset of the pandemic, the federal government halted around $5 billion in student loan payments per month, affecting 26 million people. The motivation for the pause was to ease the economic burden on borrowers during an uncertain time and an unprecedented economic slowdown. But there was another side effect: during the pause, borrowers have seen an approximately 9-point (however, this figure is also reported as around 30 points in some cases) increase in their credit scores. As of 2022, nearly 3 in 10 borrowers (about 8 million people, representing $280 billion) are predicted to be at high risk of missing payments when the great resumption begins.
Things get a bit more interesting when we look at who benefited from the synthetic increase in credit scores, resulting in a positive credit report print. It turns out that some of the most impacted individuals were those who had recent delinquencies or had lower credit scores before the pandemic.


Those represent roughly 25% of the entire student loan debt under the umbrella of the repayment pause. Not overbearing, but there's another 52% of borrowers who couldn’t be categorized accurately enough to predict whether or not they would struggle (likely strugglers and unknowns both represent the 52%). In addition, there are around 13.5 million (obviously the lion's share) of borrowers (or 51% of the student loan debt under pause) who are low risk for missing payments; these borrowers showed more positive financial trends during the pause without having any factors like outside delinquency.
Case in point, we are coming out of a record hiking cycle, with no absence of pressure points in the everyday life of an American family. Inflation is persistent, other debt levels (credit card debt, etc.) are still rising going into the Holiday season of 2023, fuel prices are increasing again, etc., and there seems to be a theme of reflation beginning. All of this is taking the US consumer right into the Holiday 2023 shopping season. The FED has a goal to continue rate hikes until they reach the mythical 2% target, but the American consumer is a big question mark when it comes to continued strength as credit keeps rising with rates. At some point, one or the other (my prediction is holiday retail sales data in Feb/March 2024), we may see the big resumption showing its effect on consumers' ability to maintain higher debt burdens, coupled with a reversion of credit scores that have been synthetically higher since the pause began, which could lead to a credit event early in 2024. If the borrowers (especially subprime borrowers since they saw the highest rating increase) have been adding credit on a higher score and haven't been able to stabilize their finances, or if another event impacts them, causing added strain, we could also see a credit event.