
7/9 Short Weekly Macro Update
This weekly macro short report features a summation of macro data from the previous week. Big travel week ahead for myself and tons of important data coming out in the week ahead!

In this weekend's weekly macro report - I will be covering a few charts from the last week.
In the spirit of keeping it short - short of my big trip coming up tomorrow - I will be reviewing a lot of the data covered from the past week on my Twitter feed (@DonMiami3). This email will be a summary of important points made from over the week. This report also features important jobs data from our great friend (@GregCrennan).
If you haven’t joined the pre-access list for MacroEdge Ascend - you can do so now at
https://www.macroedge.net/
- which will be rolling out in late July. MacroEdge Ascend is our professional research service that will be drafted and delivered by our team 4 times monthly with 3 concise weekly updates and a once-a-month in-depth report with forecasting.
Weekly Macro Report (@DonMiami3)
An inverted 10-year 3-month curve bottoms typically right around the time the Fed begins cutting rates (with the exception of 2007). (Only) If the yield curve has bottomed - this historically would tell us that the Fed cutting rates is not that far off. If the curve hasn't bottomed - the Fed make the Federal Funds rate higher before a usually brief (pause) at their desired terminal rate. 1982 - T+2 months before cuts 1989 - T+1 month before cuts 2000 - T+1 month before cuts 2007 - T+6 months before cuts 2019 - T -1 month before cuts (spread bottomed after cuts had started) The average time historically is 1.8 months although it has varied cycle to cycle. NBER recessions also begin fairly soon after an inverted 10y/3mo curve bottoms, historically.
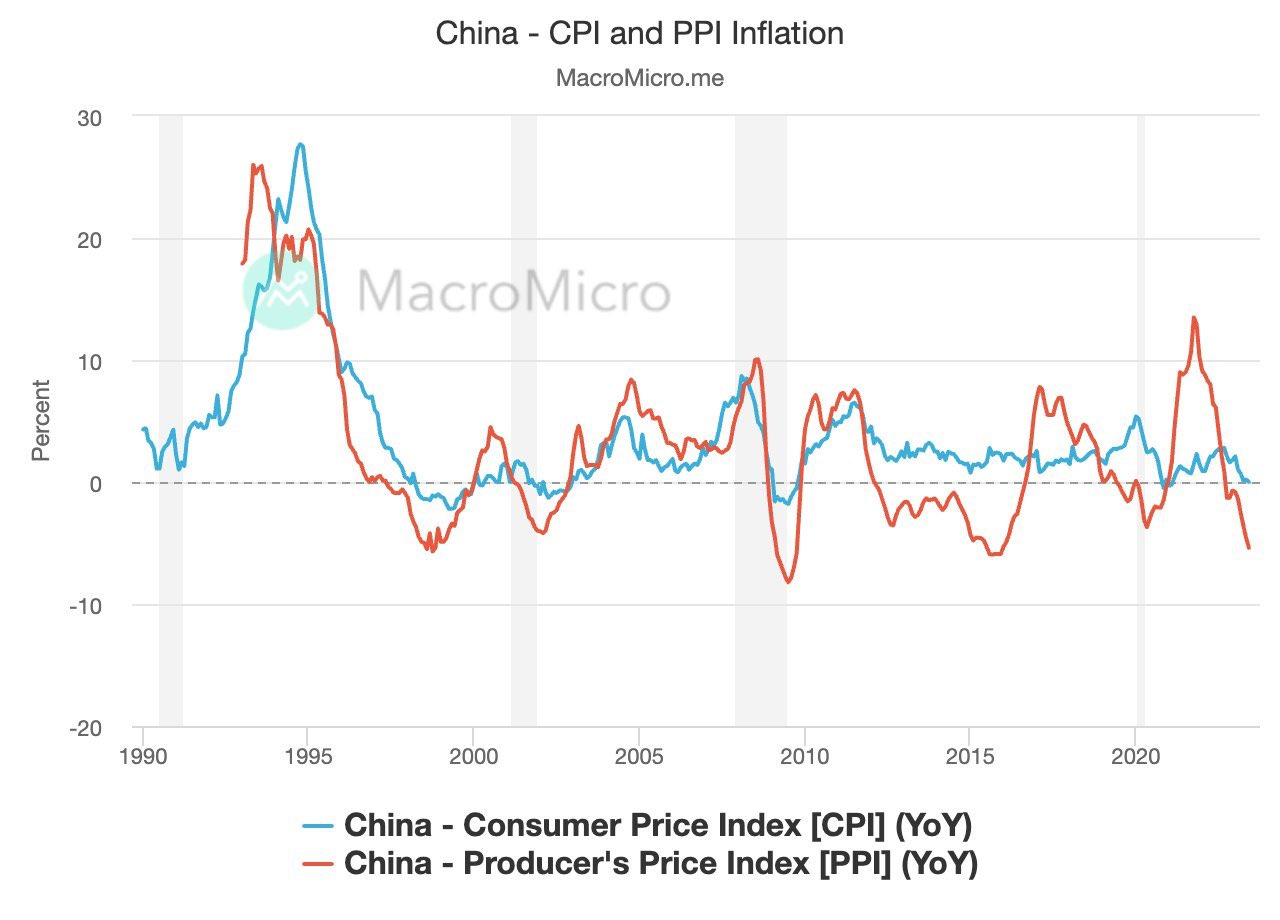
Deflation is hittinga
The yield curve inversion ratio is nearing 90% now - historically a reliable leading indicator. Still have yet to see any meaningful tick up on the NBER recession measures as the economy rolls along.
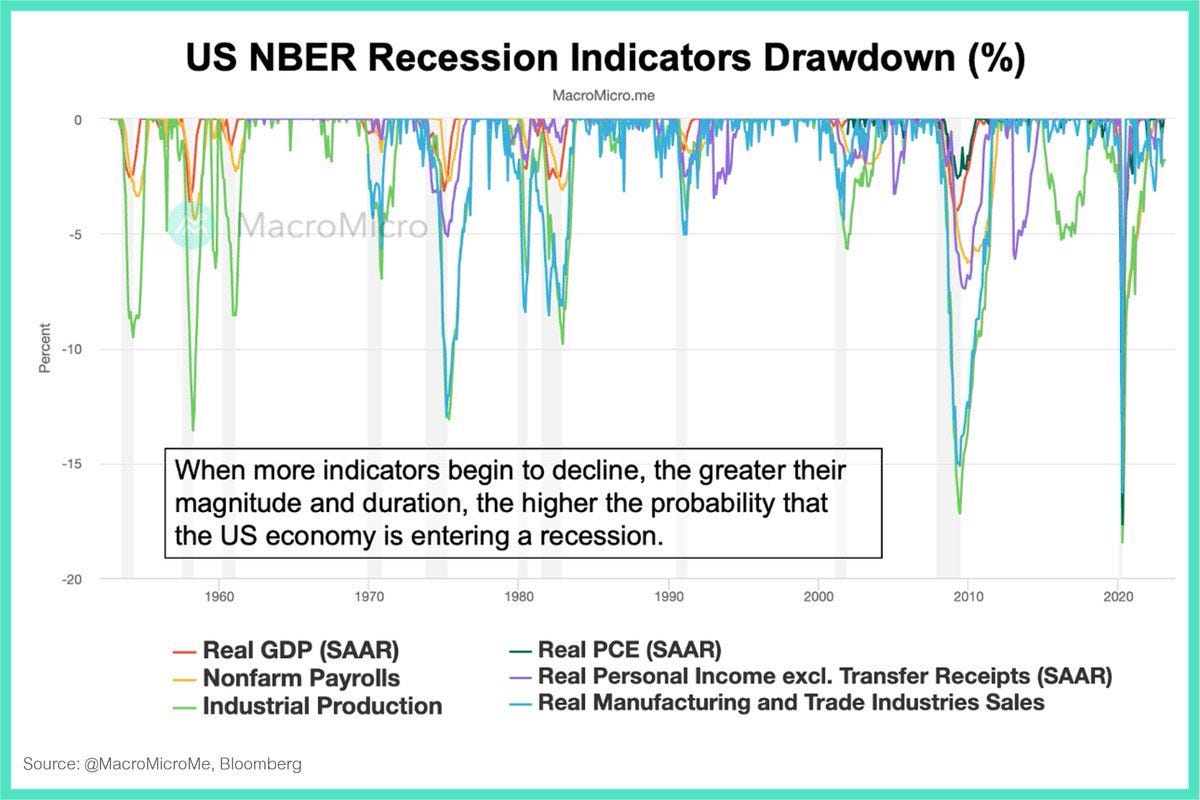
The 10 year treasury yield creeping up towards the 3 month yield will put resumed pressure on the economy & lending (RE, etc). General consensus seems to be ‘recession delayed’ into late 24 or 25 - not sure I’m on board with this narrative yet even w/continued consumer euphoria.
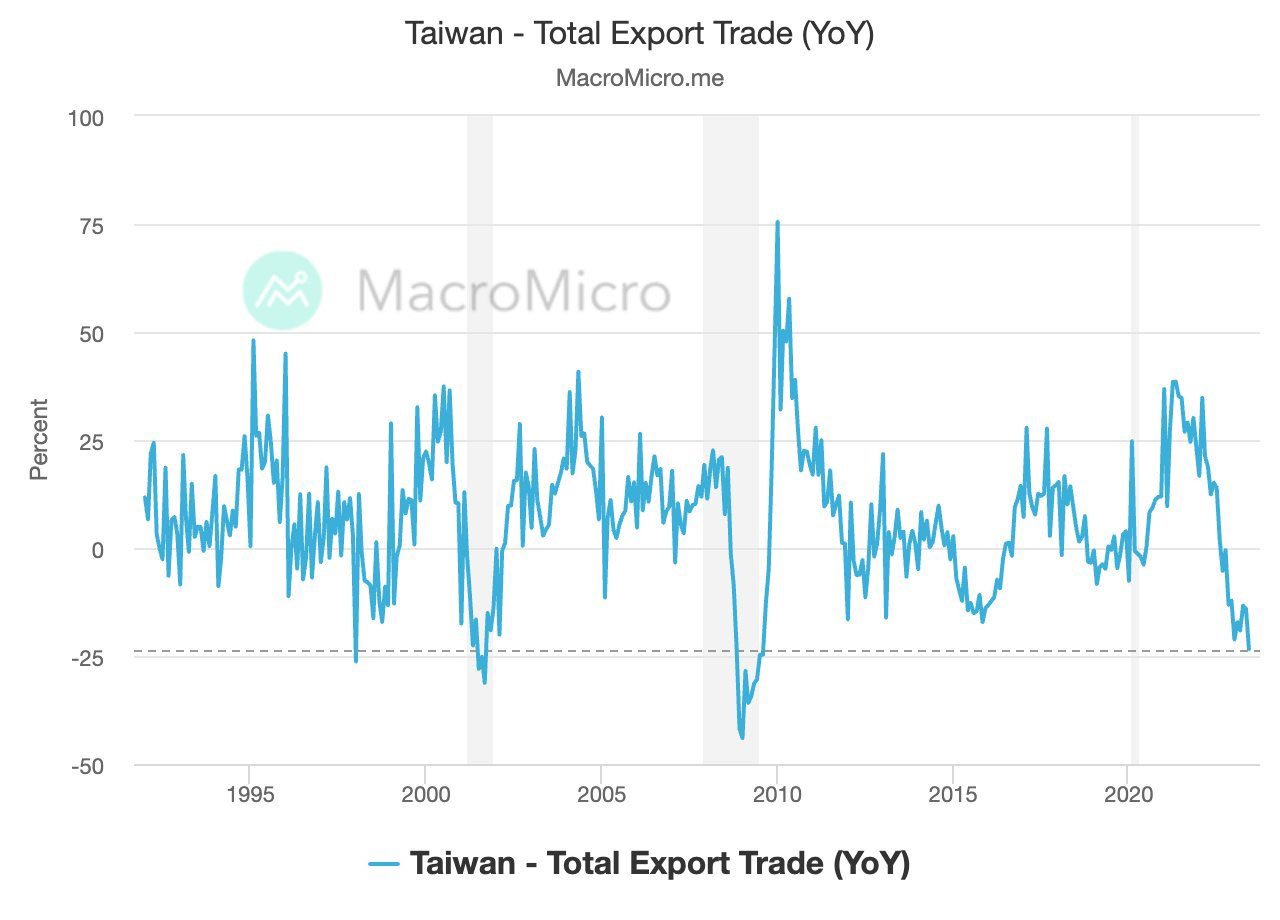
Taiwan’s exports are plummeting at the fastest rate since 2008 - notice the 2020 COVID blip had almost no effect on exports.
Respect the lag folks
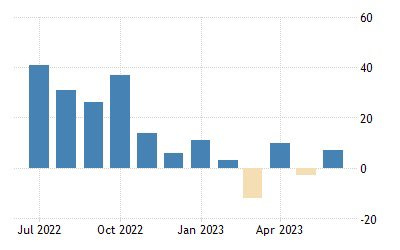
Private sector payroll adds were the smallest in a year. 149K private sector job adds versus 259K previous.
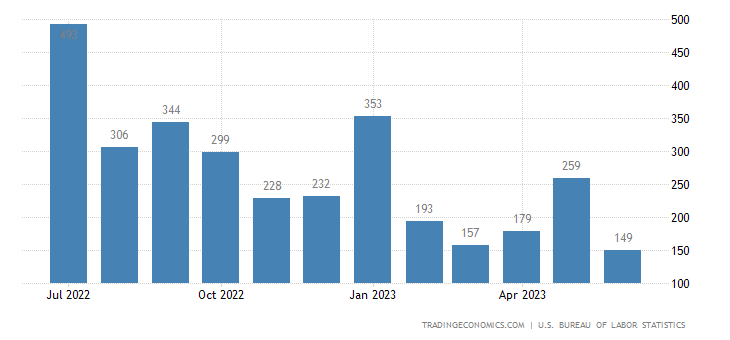
Manufacturing sector added just 7K jobs in June even with all the talk about so much construction spending in the US on new plants - hospitality/service and government continue to drive core job growth now.
Manufacturing sector added just 7K jobs in June even with all the talk about so much construction spending in the US on new plants - hospitality/service and government continue to drive core job growth now.
’
Worldwide central bank liquidity rolling over in a big way for the first time since the SVB pivot where it saw a several month increase & many CBs chose to pause to assess data:
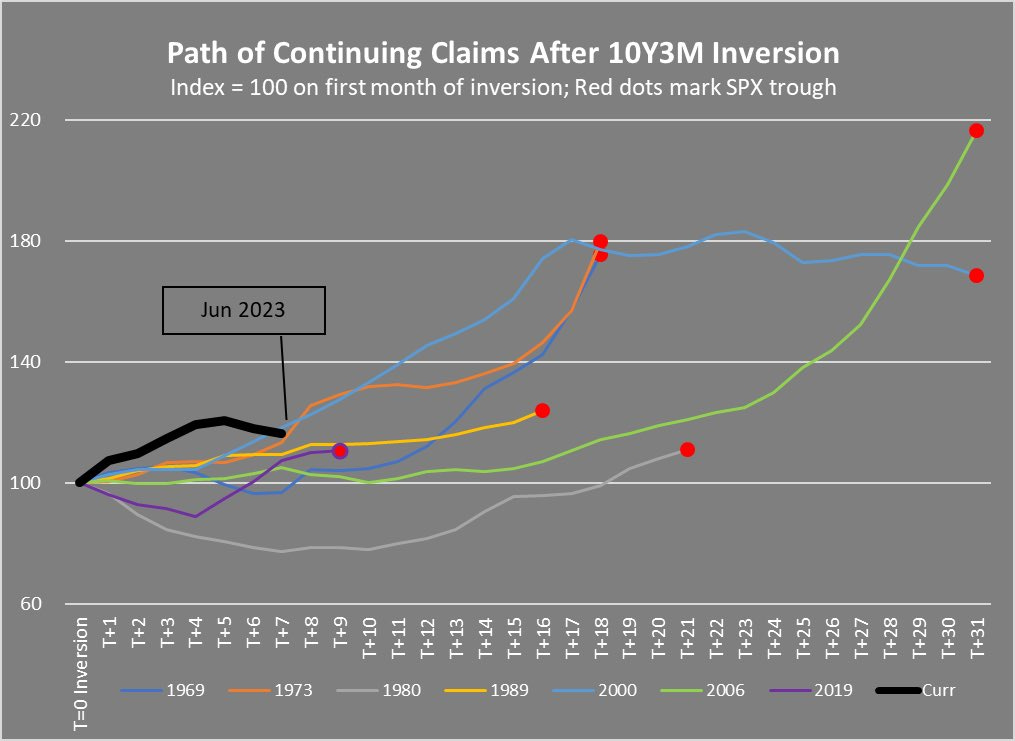
Historically 10 year 3 month inversions precede recessions by ~12mths (ranging from 5-17 months) Gains made by the S&P are common during this time period - usually early to midway through the inversion cycle. Initial claims and continuing claims tend to gradually rise & bounce around at the beginning.
June Jobs Report, not as it seems (@GregCrennan)
The June job report presents a complex picture that deserves
closer analysis. While the headline number for payroll indicates an
increase of 209,000 jobs, it is important to consider the revisions
made by the Bureau of Labor Statistics (BLS), which lowered job
numbers for the entire year by 196,000. This marks five
consecutive months of lower-than-originally-reported job figures.
Diving into the data reveals that the economy is not as
robust as it may appear. The government sector saw the most
significant job growth, with 60,000 jobs added. However, this
means that 30% of the newly reported jobs do not contribute
directly to producing goods or services that we need.
Additionally, part-time jobs experienced a substantial
increase of 452,000. This surge in part-time work highlights the
challenges faced by the average American, who is seeking
additional employment to cope with the rising cost of living. In
June, the number of individuals employed part-time for economic
reasons rose by 452,000 to 4.2 million. This increase partially
reflects the impact of terrible business conditions, including soaring
bankruptcies, resulting in reduced working hours or the inability to
secure full-time employment. These individuals would prefer full-
time jobs but are forced to work part-time due to these circumstances.
Another factor contributing to the confusion surrounding the
jobs report is the existence of two different unemployment rates:
the U-3 and the U-6. While politicians and financial news outlets
often highlight the low unemployment rate using the U-3 number, it
is the U-6 rate that offers a more comprehensive understanding of
the overall economy.
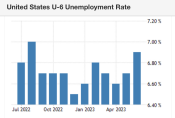
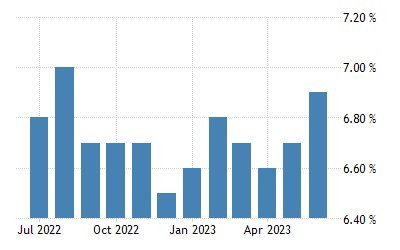
The U-3 rate only accounts for unemployed
Americans actively seeking jobs, excluding those who have
given up the search. In contrast, the U-6 rate considers
unemployed, underemployed, and discouraged workers. In
June, the U-6 rate reached 6.9%, rising over the past three
months (6.4%). Economists generally rely on the U-6 rate as the
more accurate indicator of unemployment in the country.
The number of Americans who desire employment but
are not part of the labor force remained unchanged at 5.4
million in June. These individuals are not classified as
unemployed because they were either not actively seeking work
in the preceding four weeks or were unavailable for
employment. This discrepancy contributes to the U-6 rate being
nearly double the reported U-3 rate.
Furthermore, a significant data point in the jobs report is
the decline of -15,000 jobs in the retail sector, including
building material, furniture, electronics, and appliance retailers.
This decline suggests that American consumers have reduced
their spending on discretionary goods, which has negative
implications for many companies as well as their future
earnings.
Lastly, the report highlights that average hourly earnings
rose by 0.4%, resulting in a 12-month increase of 4.4%. While
an increase in wages is positive news for American workers, it
is essential to consider the impact of Core PCE inflation, which
excludes food and energy prices. With Core PCE inflation
hovering around 5%, it becomes apparent that the rising wages
are not allowing individuals to make significant progress in
their financial situations as the cost of living rises even more.
Given the wealth of data within the jobs report, it is
understandable that people may not have the time or resources
to fully comprehend its implications. That's where the Coastal
Journal comes in. The Coastal Journal aims to go beyond the
surface-level numbers to provide accurate economic analysis
and a deeper understanding of the report's findings as well as
the economy.