
7/30 Weekly Report - Staying Patient, Powell's Housing Remarks, Charts, and More
In this weekly write-up for 7/30 - our contributor team discusses recession forecasting, Powell's housing comments, the housing market, the prolonged bear market bounce warranting patience, and more.

7/30 MacroEdge Weekly Release
@DonMiami3, MacroEdge Chief Economist
@SixFinance, MacroEdge Head of Research
@MrAwsumb, MacroEdge Contributor
@TexasRunnerDFW, MacroEdge Contributor
@GooniStonks, MacroEdge Contributor
Weekly Data Dive and the Week Ahead (@DonMiami3, Chief Economist)
Going to keep my piece short this week with a busy workweek ahead for myself and we’ve got a whole bunch on the MacroEdge backend being developed in the meanwhile. Plans for Ascend access are a bit delayed from the original timeline do to a holdup with our webdev team being on vacation but we are still expecting to have pre-access available for Ascend sometime in the next week or two. You can join this pre-access list for MacroEdge Ascend on the site at MacroEdge.net and simply enter your email at the bottom of the page. A MacroEdge representative will be in touch via email when Ascend pre-acess does come available but we apologize for the delays on that front.
Data continues to fall within the expectation range of the previous month or so worth’s of discussions. The GDP print came in hot - but pretty inline with past last stage cycles. Stocks were mixed on the week following a substantial sell-off day on Thursday followed by Friday’s rally. Major indices continue to be just a tick off of all time highs highlighting relative continuing strength in the equity space. What we have yet to see is any substantial red week during this parabolic move I’ve referred to as ‘Valhalla’ on Twitter. I don’t think it’s unreasonable to see all time highs given relentless buying activity although we do have a major earnings week ahead that may give us a clearer picture of whether or not this will actually be feasible (especially with AAPL reporting this coming week).
I won’t drown everyone in the charts this week since our amazing contributor team provided plenty of useful visuals and data below - but wanted to focus on a few common recession gauges that I will update in a few weeks for everyone.
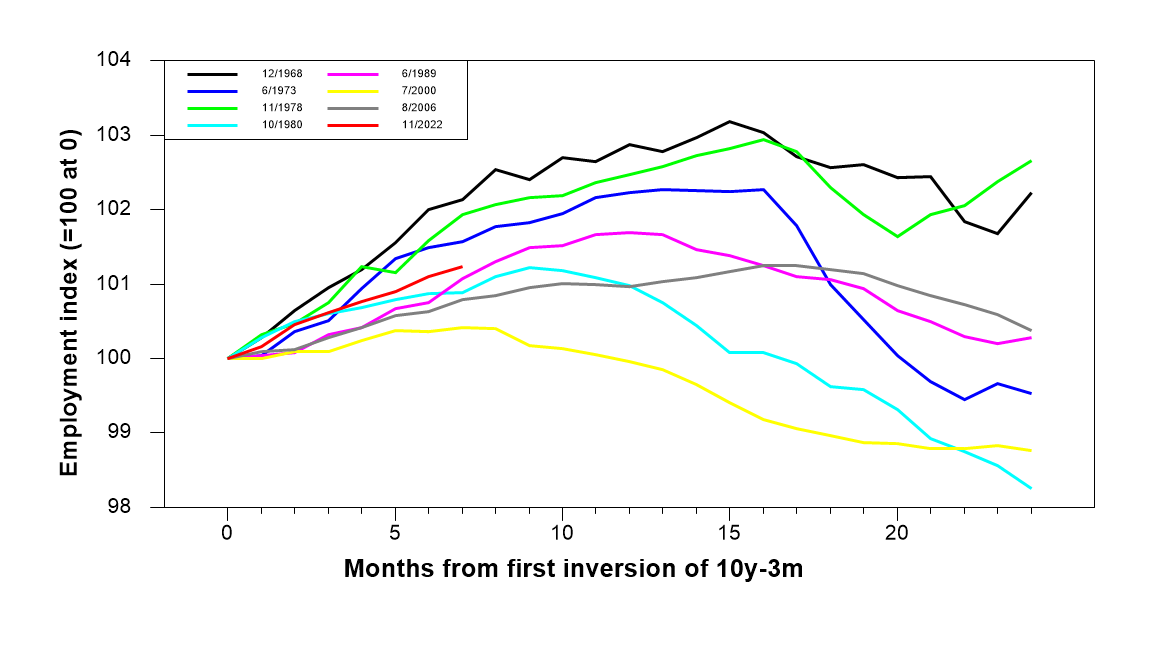
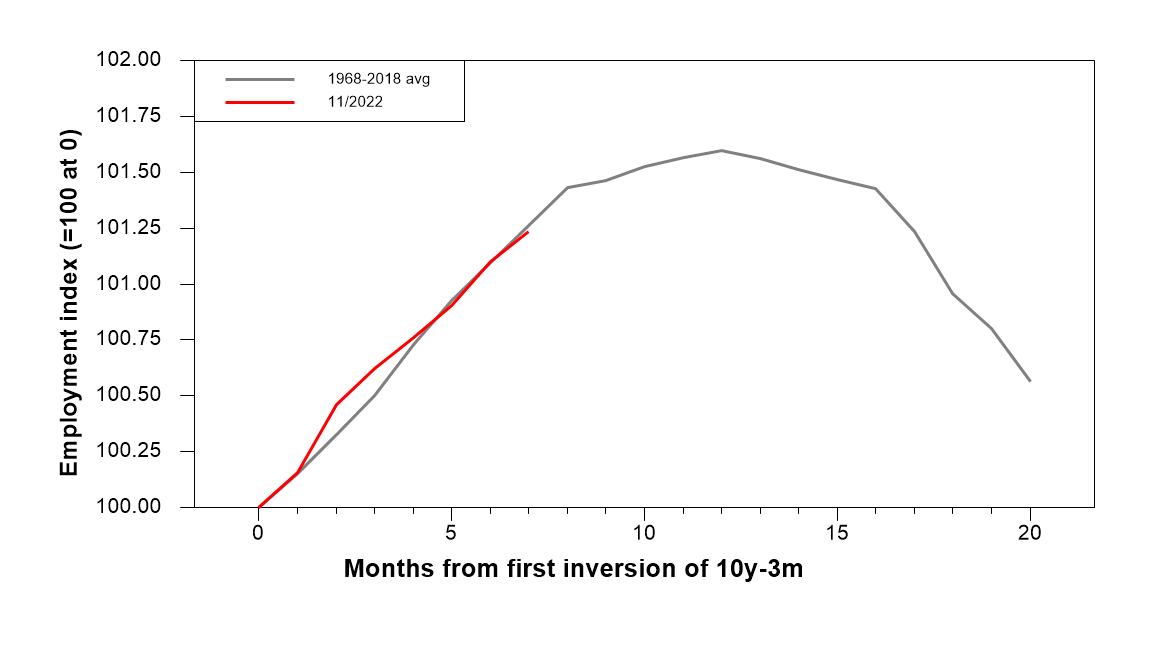
This chart from Arturo Estrella, PhD (FinanceEcon.com) highlights where we are in this cycle with employment relative to past cycles. The employment index is continuing to rise highlighting relative strength in the entrenched labour market - and historically we don’t see this roll over until later in the 10 year 3 month inversion process (which I’ve discussed extensively here and on Twitter). Here’s a visual comparing this cycle to the average of the past 8 recessions Employment Indexes:
Looks pretty dead on to me… (will have an update on these charts towards the end of August as the economic calendar progresses).
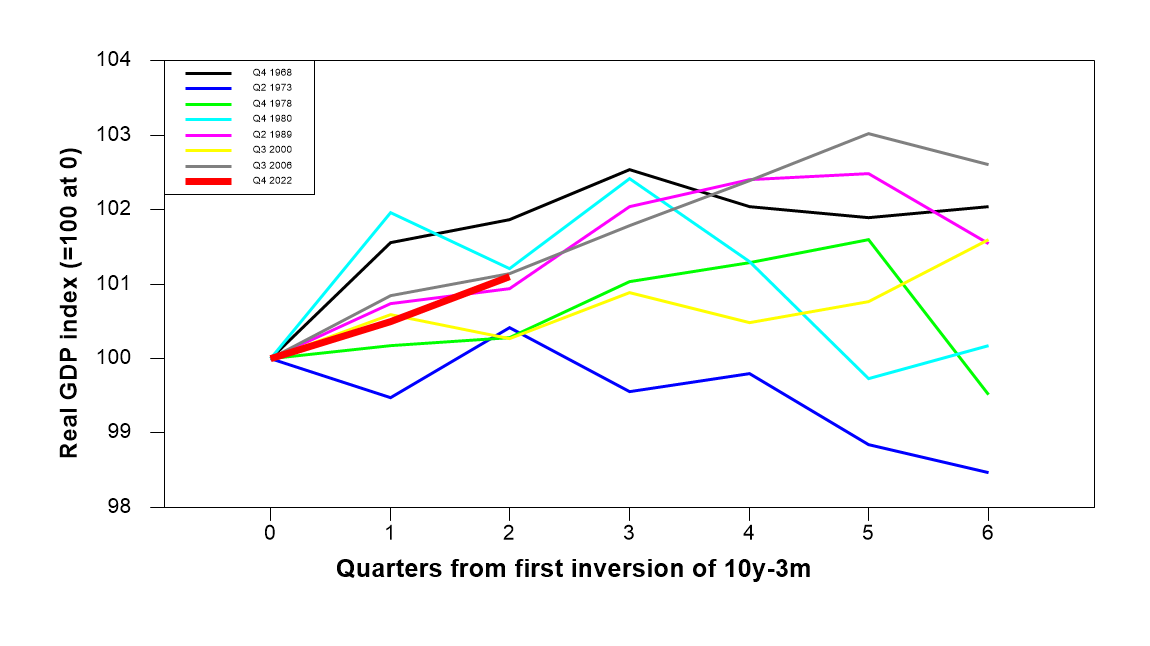
GDP growth is also well in-line past cycles - in fact nearly perfectly tracking the GDP indexes seen in 1989 and in 2007. Given 2 quarters since inversion - the typical cycle range before GDP contraction would put us at another 2-4 quarters before that roll over begins on the GDP front. While we did have a technical recession last year - those negative GDP prints were caused by an inflation shock - rather than an earnings compression, disinflation cycle, credit crunch, and labour market weakening cycle.
These charts demand long-term patience for those wanting to remain pessimistic or cautious of the economy ahead (including us here at MacroEdge and myself) as it highlights the sometimes aggravating nature of the lag effects from Fed action to actually impact the economy.
For the week ahead we have China PMI data (service and non-service), huge earnings in names like Apple, the Chicago and Dallas PMIs, the Loan Officer Survey, S&P and ISM data, Dallas Fed data, and more. It’ll certainly be a week filled with more interesting data and likely some fireworks to be closely watched.
Have a great evening everyone and enjoy the below reads.
The Week in Review (@SixFinance, Head of Research)
Rates moved higher this week as the FOMC statement offered very little change in rhetoric. Forward-looking guidance from the FOMC is continuing to be higher for longer on rates. Powell’s presser revealed that as previously guided, there should be no rate cuts expected until 2024. Powell also revealed that the FOMC staff (notably separate from voting members) are no longer expecting a recession. GDP printed higher than expected at a 2.4% annualized expansion rate.
Mega cap tech largely beat earnings expectations on top and bottom lines and guided higher. Markets responded very favorably with tech exploding higher. Rates moved higher as well with higher for longer being accepted by markets. Core PCE, the Fed's preferred gauge of inflation came in at slightly under expectations at 4.1% YoY, causing equities to move higher on Friday. The 10-year yield pushed higher above 4% briefly, while settling at 395bps to close out the week.
The Bank of Japan shocked markets this week by lifting its rate bank ceiling on yield curve control up to a maximum of 1%. Japan inflation is accelerating, with core CPI rising to 3.3% YoY. This marks 15 straight months of Japanese inflation running above the BOJ target. If Japan is forced to join the global rate hike cycle, this will likely prove a significant shock to markets. Certainly, something to keep a weather eye on.
Markets are by and large anticipating a goldilocks scenario in which inflation is tamed without a significant economic downturn. This remains premature as long and variable lags in rates have historically taken time to fully materialize into the economy, something Powell continues to touch on in his pressers.
SPX is hovering at around 1 standard deviation above the 25-year average for forward earnings, which is certainly elevated with rates being where they are. Price to Cash flow on SPX is now over 1.6 standard deviations above the 25-year average. PE ratio of the top 10 stocks in SPX hovers around 30x.
Excess savings have dwindled down from a 2021 high of $2.1tn down to roughly $400 billion. Small banks remain having excess exposure to commercial real estate, which has quite a few headwinds. Large banks maintain roughly 13% exposure to CRE while small banks have roughly 44% exposure to CRE. Office space is increasingly becoming an item that businesses see as less and less necessary as work from home becomes a prevailing trend following the pandemic.
FOMC predicts a 4.5% unemployment rate in 2024 and Fed Funds rate at 4.6% at the end of 2024. Keeping rates this elevated for this long in an economy that is used to having extremely cheap capital is certain to cause some form of economic downturn. NBER typically declares a recession around 10-17 months following the final fed funds rate hike. Economic pain is coming, the timing is what is up for debate. While the media reports that a soft landing has or will be achieved (which is what the media always says before a hard landing comes), keep an eye on the long and variable lags in monetary policy.
The valuation multiples we are seeing in equities are not currently warranted when taking into account the cost of capital. I remain fundamentally bearish on SPX, while being technically short-term bullish in the short term.
Some Thoughts on Powell’s FOMC Comments(@TexasRunnerDFW, Contributor)
Powell was uncharacteristically quiet during his speech at the July FOMC press conference this week, but he did make a few notable remarks about the housing market.
When asked about whether we are getting closer or further away from balance in the housing market, Powell responded, "With existing homes, there are many people who have low-rate mortgages, whereas they might want to sell in a normal situation, they’re not going to because they have so much value in their mortgage, which means that supply of existing homes is really, really tight, which is keeping prices up. On the other hand, there’s a lot of supply coming online now. I think this will take some time to work through.”
A few things stood out to me in this statement, but the first, and most alarming, is what he said about value.
Where is the value? It’s not in the asset. It’s in the low fixed rate debt.
The massive amount of low fixed rate debt is what is controlling the market— locking up supply and artificially propping up prices.
Why does this matter? Because it tells you this is an alleged free market that is both being controlled and completely out of control. It lost its equilibrium due to an external force (loose monetary policy). Monetary policy is supposed to help stabilize market prices, not control them.
Anyone who has ever tried to control something or someone possessing its own free will has learned this lesson the hard way: you can’t do it. It will resist your attempts at control and the result will be something worse than if you had just left it alone.
And what’s worse, you cannot backtrack and undo the damage by simply reversing course. Whereas you might have gotten it to yield to you in one direction, it puts up a vicious unexpected fight when you pull it in the other. Now it’s wounded and you’ve lost control.
Powell is coming to the realization that the Fed’s tools cannot control markets; it merely distorts them.
When he acknowledges that we need more supply to come online and that it will take more time to work through the imbalance, he is acknowledging the powerlessness of his singular demand-smashing interest rate tool. The market has found a workaround price drops, with existing owners freezing in place, cash buyers impervious to interest rates, and builders controlling supply output and buying down rates.
There are only a few ways forward from here to restore balance to the market:
Wages need to rise to make current prices and rates affordable.
We need asset price deflation.
We need to build more housing supply.
The Fed is actively fighting against option one. Powell said number two is no longer forecasted (deflationary recession). And the third option won’t work if there is enough cash on the sidelines to consume the supply as investment properties, maintaining the market distortion.
So, it looks like Powell is right, this will take some time to work through. Because I’ve not yet heard anyone propose a viable solution. And in the meantime, this Frankenmarket is running around terrorizing everyone. I don’t think we’re going to get a happy ending. But we’ve still got several chapters to go.
Money, It’s Gas (@MrAwsumb, Contributor)
There’s rightfully been a lot of national discussion on the real estate market. With banks getting keys mailed back for office buildings (Jingle Mail – yes I did just cite Paul Krugman, just not his economics) and the more recent claims of capital calls for Tides Equities. But there’s also good reason to believe it won’t just be Tides that’s affected.
Let’s start with some basics. Here’s a chart of Median Sales Prices of homes, courtesy of Federal Reserve Bank of St. Louis FRED:
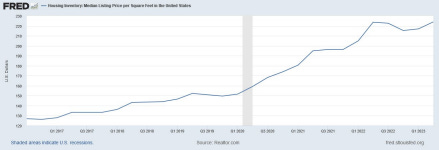
Now I’m using this chart of price per square foot for a reason, and we’ll get there momentarily. $217 per sq ft is the current median list price for single-family homes. In Q3 of 2016 that number was $127 per sq ft. We’ve nearly doubled the price per sq. ft of homes since the data was tracked in 2016.
I’m also including this from the National MultiFamily Housing Council showing the current value of apartment stock at $282 per sq ft:
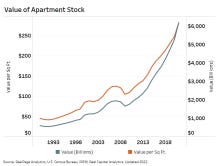
As you can see, we’ve also more than doubled the value per sq. ft of apartment stock, from $100 per sq ft in 2015, to $282 now.
As for the cost to build, according to the National Association of Homebuilders, in 2015, the per sq. ft cost to build a home was $103. At the end of 2022 that cost was $153. Building costs are up 50%. (Construction only costs, no land, no broker, closing fees or financing involved)
Let’s take a look at what the finance portion was beginning in 2015:
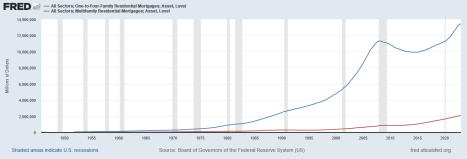
There was $1,033,014,000,000.00 ($1Trillion) in pledged mortgage for Multi Family assets in Q1 of 2015, and $9,909,411,000,000.00 ($9Trillion) for 1-4 Family Residences at the same time. At the end of Q1 of 2023, the Multi Family pledged mortgage value doubled to $2,077,693,000,000.00 while 1-4 Family Residence debt increased to $13,430,409,000,000.00. The debt on Multi Family has doubled, the debt on 1-4 family is 30% higher than it was, and both growing.
Ok, we’ve nearly doubled price per square foot, come close to doubling Multi Family Mortgages, up 50% on construction only costs per ft, and 1-4 Family unit debt is up 30%.
Here’s a look at interest rates over time:
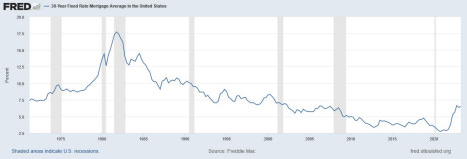
In Q1 of 2015 the average 30-year fixed mortgage rate was 3.72%. As of Q2 2023, that rate is 6.37%. Just shy of doubling. Now that’s just part of the picture. Let’s take a look at what happens after those loans.
In Q1 Mortgage Backed Securities were at $1.7+Trillion amongst all FDIC insured banks, according to the FDIC, and again FRED:
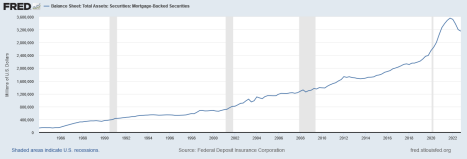
In Q4 of 2021, that had doubled to $3.5 Trillion. You can see it is tapering off. But MBS are just part of the picture. All Collateralized Loan Obligations amongst lenders were at $179 Billion in Q1 2015 vs Q2 2023 at $637 Billion.
Again, we have doubled, this time in Packaged loan securities. Debt.
So, what are we getting out of this? Surely, there’s revenue growth, GDP, right? Let us find out, because with that kind of debt, we should, right?
Let’s look at National Homebuilders over the time period:
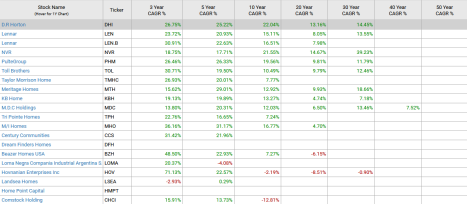
2015 to 2023 is 8 years. What’s the compound growth rate of National Home and Commercial Contractors (publicly traded)? Do you see any doubling? The Median contractor comes in at 12.92% compounded annual growth rate, over the last ten years, Meritage Homes takes that mantle.
Surely REITS in the Multi Family space will show better:
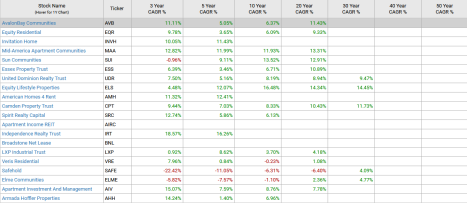
Only it’s worse. 6.71% compounded annual growth rate over the same ten years for the Median REIT, Essex Property Trust. Surely there’s more, the GDP contributed is better.
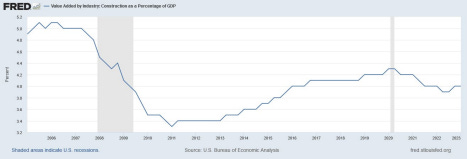
Well, in Q1 2015, Construction as a percentage of GDP by value added was at 3.7%. In Q1 2023 it was….4.0%:
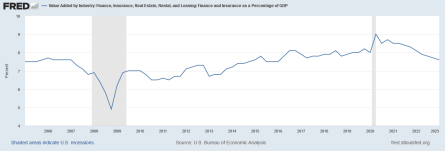
The remaining Finance, Insurance, Rental, and Leasing: Finance and Insurance portion of GDP was 7.6% in Q1 2015, and 7.6% in Q2 2023:
If we’ve doubled debt loads, doubled debt costs, doubled price per ft, doubled overall price, but the most we have to show is 30 basis points in one industry of GDP, and a 6-12% compounded growth rate over 10 years for a handful of companies, maybe cheap money acts like hard money. If you’re feeling depressed after reading this, maybe your emotion is a sign of what’s to come.
Money, it’s a gas.
The Bear Trapping Bear Market (@MrAwsumb, Contributor)
The $SPX has rallied 19.34% YTD and a breathtaking 4.69% over the last month. Bears are in the house of pain since March, with every signal of trend reversal being followed with a massive move higher. Bulls have continued to ride the momentum and positive economic data to 52-week highs, as positioning and flows have remained at bullish levels for most of the year.
The trend has been remarkably similar to the COVID bubble rally, with an unsustainable slope for expected future returns. It would be easy to suggest the rally has gone too far too fast. However, this has been the case countless times in 2023. On Thursday, July 27th, $DJIA turned a green to red bearish engulfing candle while going for a record 14 straight days of gains. As this might have been seen as a turning point, indexes including $DJIA gapped higher on Friday on positive GDP data putting to rest the idea that bears might have gained control.
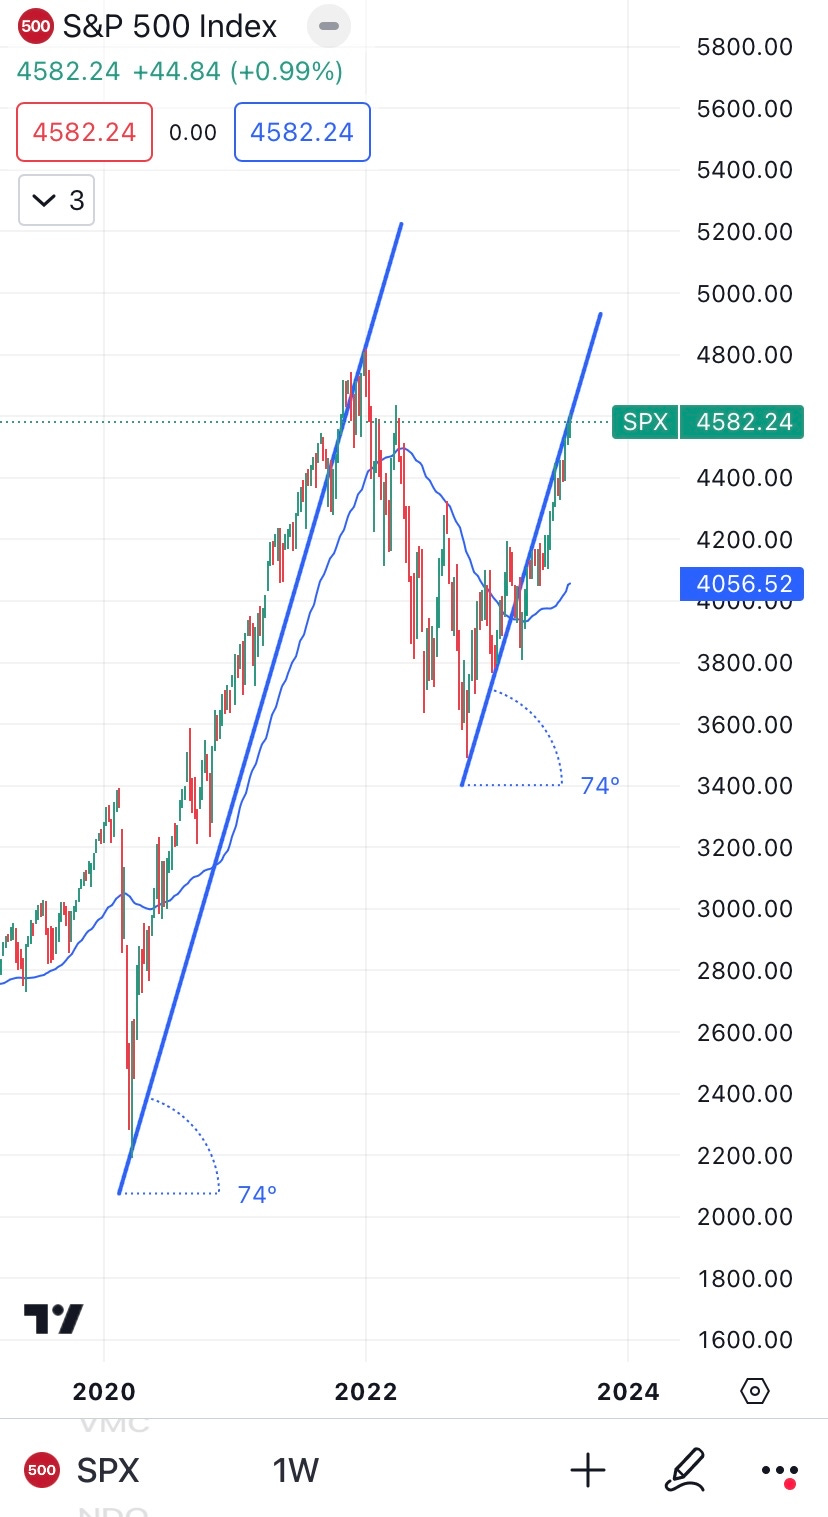
We are moving into a key level of resistance for the SP 0.00%↑ X of 4600-4675. The last two bear gaps remain from January and April, and the market appears to be on a path fill them in short order. Currently, there are 6 gaps immediately lower since the March lows. Will they be filled?
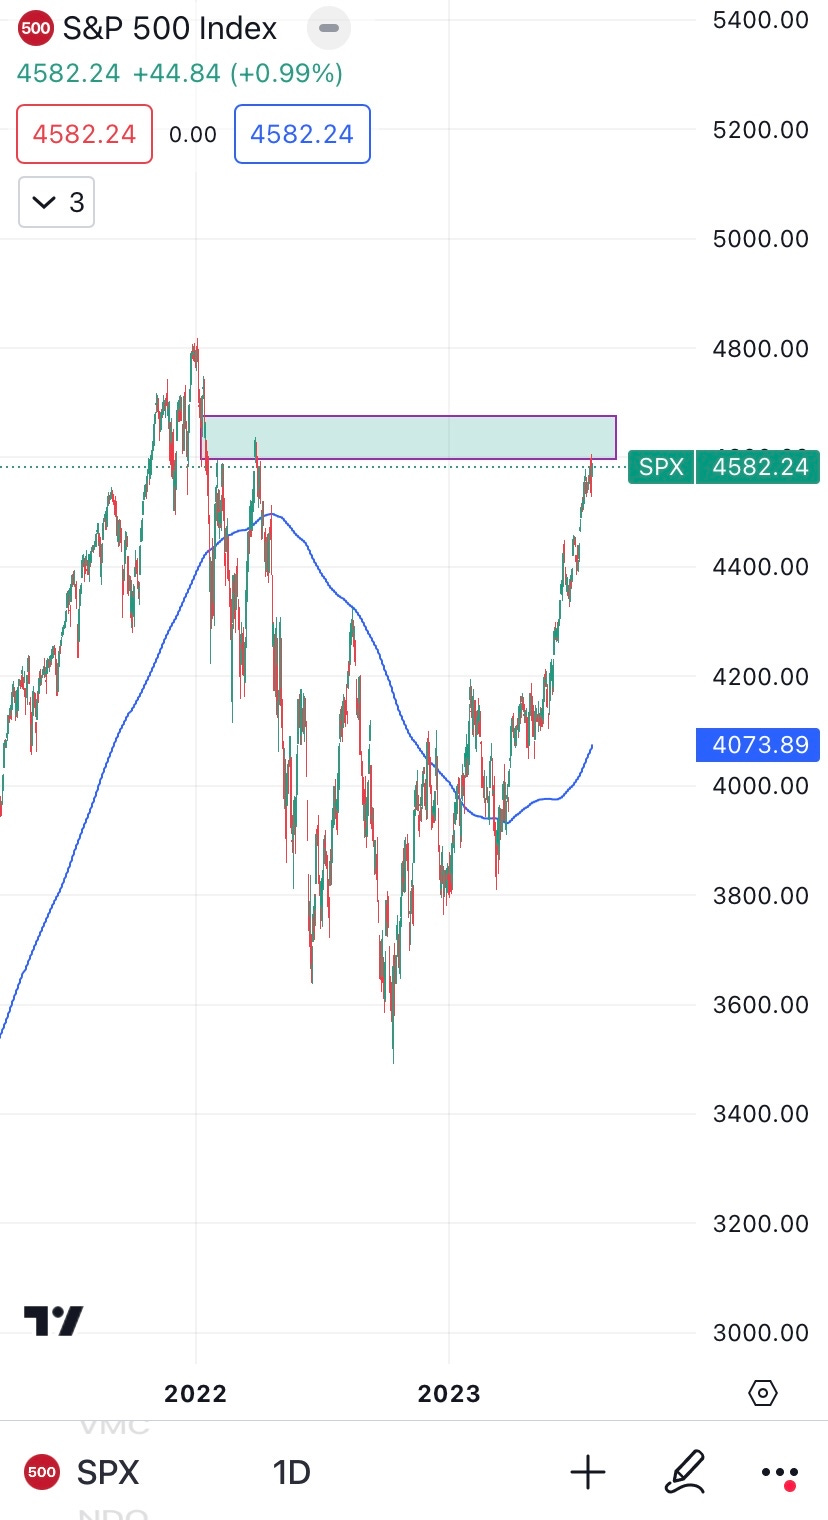
This range should be a headwind in the short term for bulls, as momentum on the weekly chart suggests we might stall here for now.
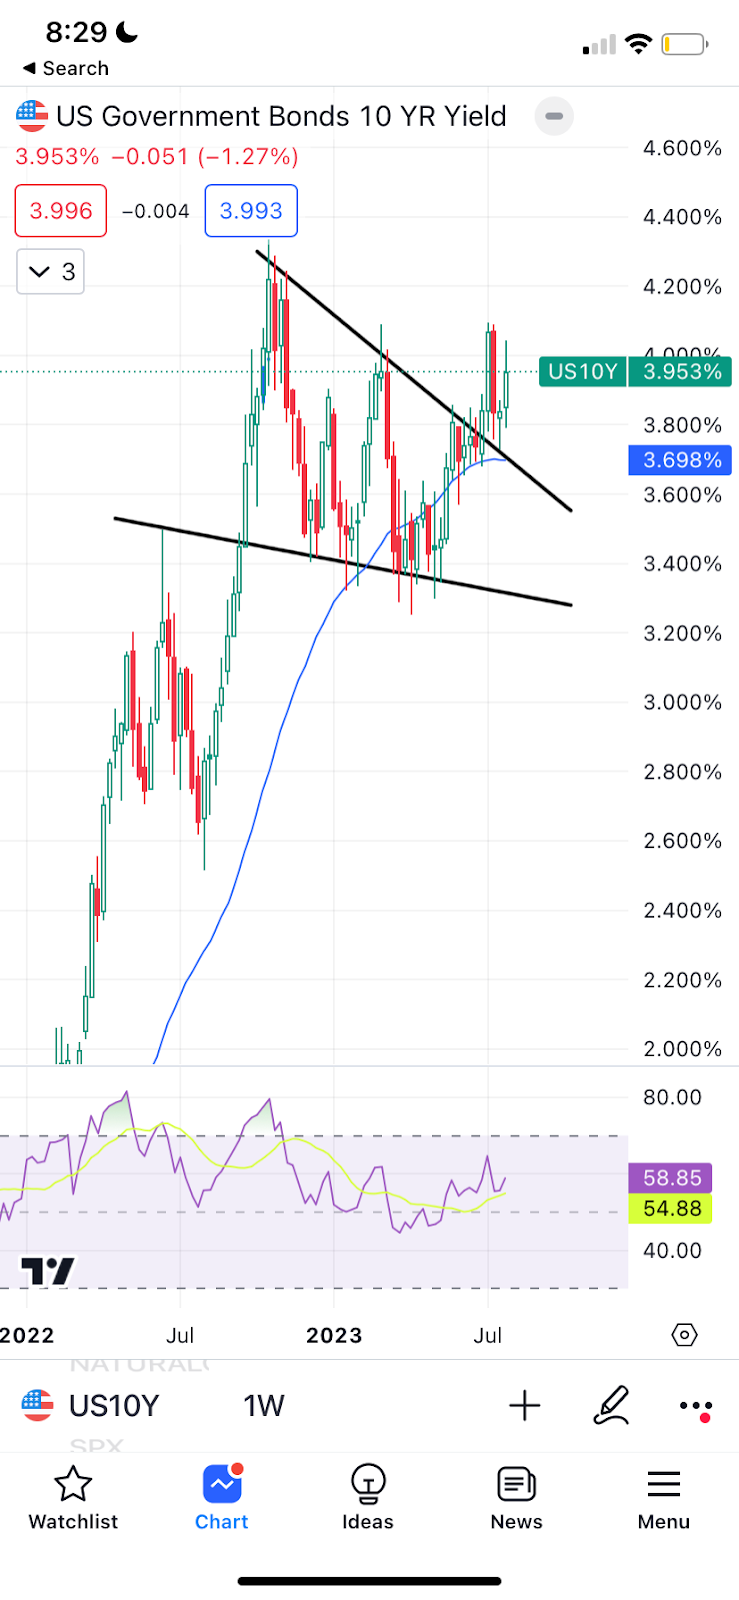
A new hope?
The yield on the 10 year US Treasury has broken out of a down trend over the last several weeks, pushing towards the highs in late 2022. In 2022, this move would have likely sent equity prices lower, but there is one key difference so far in 2023.
The dollar, however, has not followed the move in yields. The dollar is a key driver of multinational EPS, and has been a key driver for higher asset prices in 2023. As the $DXY seems to have found a base around $100, a true break out and validation of the move in yields would give bears a glimpse of hope that lower prices could be ahead.
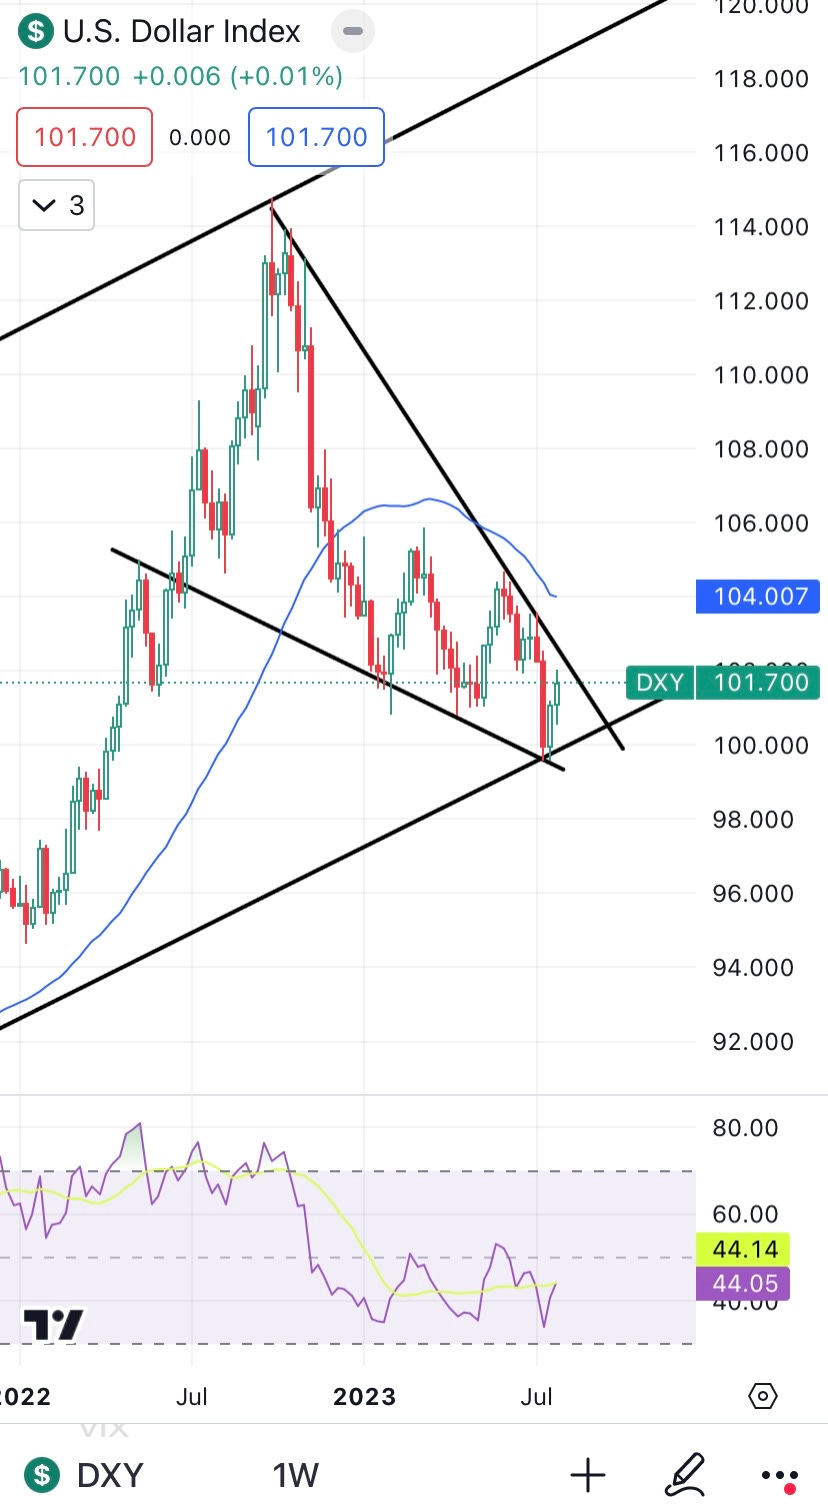
If the bears hope to regain their respect, they might need some help from strengthening in the dollar along with more sustainable weakening in macro data. For now, the bulls have room for more into August before Jackson Hole.
is anyone reading this?
thank you!