
7/26 Special: FOMC Cocktail Hour and the Inflation Boomerang
Enjoy this special FOMC release featuring a short discussion with Don on the FOMC meeting/presser and Spacman's thoughts on inflation. Cheers!

FOMC Cocktail Hour (@DonMiami3, Chief Economist)
Happy humpday everyone - nearly Friday and today we got the FOMC press release + Powell press conference.
Today was a very mellow Powell presser along with in-line expectations of a 25bps hike - bringing the target Federal Funds rate up to the 525-550bps range (highest in 22 years). To visualize where things stand with the Federal Funds Rate (FFR) and the Conference Board Leading Index - here’s a helpful visual:
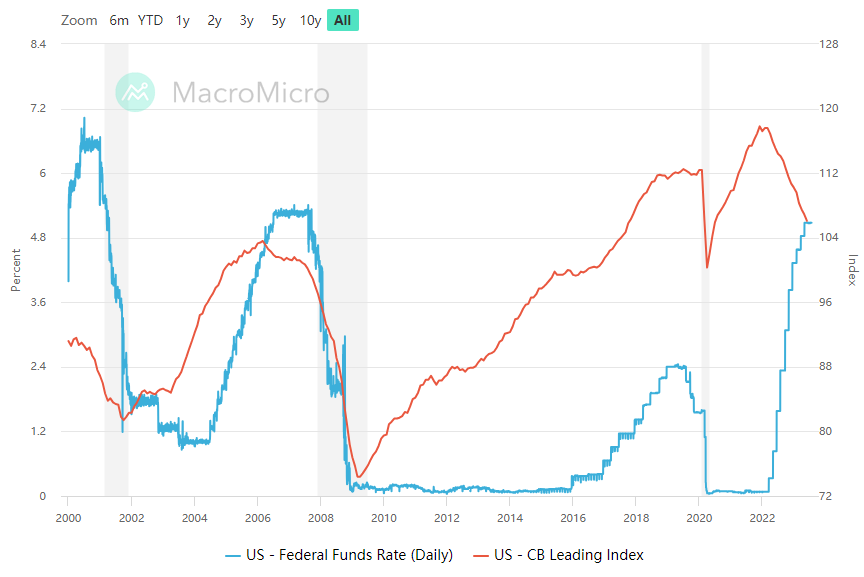
The Fed is continuing to tighten into a deteriorating CB Leading Index for the first time this century - and usually has already paused or is cutting as the Leading Index declines. With the (re)inflation risk now being very real with things like commodities bouncing sharply off their lows (see oil at $80, for example), continued tightening would be unprecedented into weakening leading indicators. Right now - the Conference Board Y/Y index further weakened in June - albeit slightly - but is roughly on par with the decline seen during the Dotcom bust % wise. Important note: the LEI saw now significant y/y decline like we’re seeing during past labeled soft landing years in 2018 and 1994 - the most frequently cited soft landing successes.
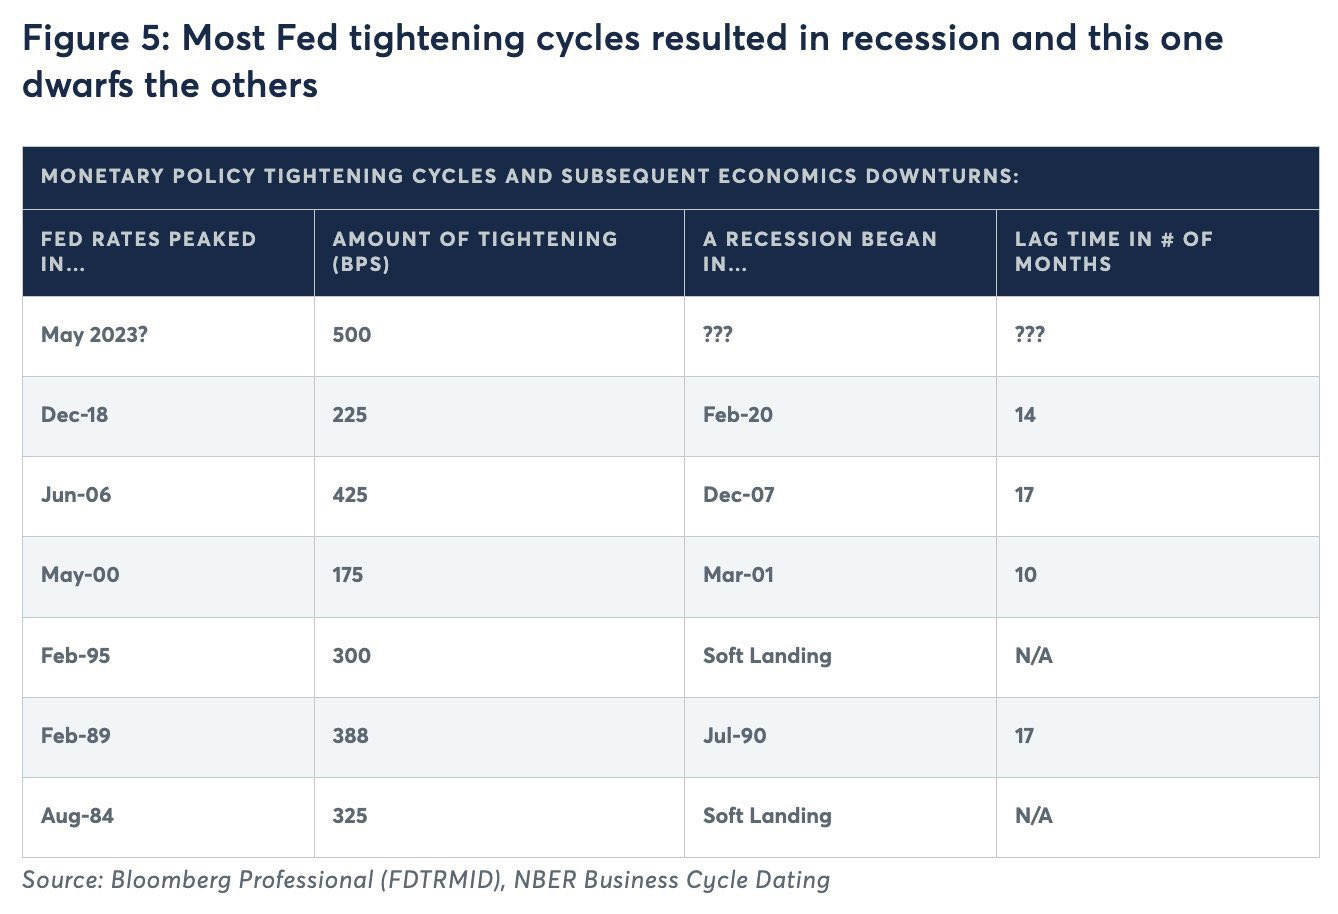
With the Fed and the majority of analysts, retail, and banks now on the side of the soft landing narrative - I stand by the narrative that the odds of achieving a soft landing once this hiking cycle is completed as neigh-on-impossible.
The only way I think we can call this a successful soft landing is if we get this required formula: employment remaining near or at maximum, the yield curves (2s10s, and 3 month 10 year) uninvert and normalize, and the Fed begins to cut rates not in response to economic decline.
Forward yield curves continue to give off mixed signals of another coming Fed hike and the Fed gave themselves a lot of leeway into the next decision. While the (re)inflation risk is very real - Spacman discusses this below) - I think the biggest risks will be realized when we hit the pause period which may be later this year. Powell did signal that there would be no rate cuts this year. QT will also continue as scheduled.
In my opinion - we can’t begin the ‘landing countdown’ until peak rates are achieved - which is likely to be H2 this year - or may be signaled at the Fed meeting. I stand by my base case that I’ve made for months - even as equities continue to price in a perfect buttery smooth landing (they’ve done a whole lot of that) and with the possibility ATHs just a % points away - that we do not see a soft landing from this environment. This time is probably not different.
The Inflation Boomerang (@BullSpacman, MacroEdge Contributor)
Hi Gang! I didn’t think I’d be speaking to y’all so soon again, but Don was kind enough to welcome me back, so let’s dive in and speak about a topic that impacts all of us - Inflation.
Inflation, as most of us know, is measured using a basket of goods & services and tracking the change in their price. Put simply, it is the destruction of the common man’s purchasing power. Today’s piece will try to project inflation scenarios for the remainder of 2023, but I want to highlight two important concepts first - Real Yields and the Base Effect.
Say you get a 5% raise at work. On the surface, that might feel pretty nice (even though you deserve more), but if measured inflation is 8%, did you really win? The answer, of course, is no. Real Yields work in a similar way, but we substitute bond yields for the raise. This is what Jerome Powell and Fed Speakers talk about when they say, “We want Real Yields to be positive,” i.e. holding the Federal Funds Rate (FFR) at a high enough level to outpace inflation. They do this by controlling short-term interest rates via the FFR, and that cascades down the chain, impacting bond yields and the interest rates offered by banks and lending institutions.
Increasing the FFR attacks inflation in a three-pronged fashion. First, it incentivizes saving and investment. After all, hardly anyone would want to buy bonds yielding 2% if inflation is significantly higher, or in a savings account offering a near-0 yield. Additionally, people may seek out riskier investments (spoiler alert: they do) while Real Yields are negative, creating economic instability. Finally, increasing the Federal Funds Rate impacts the interest rate for borrowers. This reduces demand as people can’t freely use leverage to acquire assets and services. Companies are forced to cut costs, whether it be via quality or reducing their labor force, driving unemployment higher. As JPow said, they’re using the blunt tools they have.
As far as the Base Effect goes, think of it like a treadmill. If you start a workout at 6 mph and increase the speed to 8 mph, you’re moving 33% faster. The next day, you start your workout at 4 mph and the same increase to 8 mph results in a 100% change. This is how the Base Effect works - a higher starting point makes it easier for inflation to “fall” and vice versa. Why does this matter? Well, not only did Powell admit that it could take until 2025 to get inflation back down to 2% (yikes), he also subtly prepared the market for the Base Effect in today’s FOMC press conference. Figure 1 below shows historical data and the potential impact on the CPI print on August 10th, which will have month-over-month (MoM) price increases from July used to calculate year-over-year (YoY) inflation.
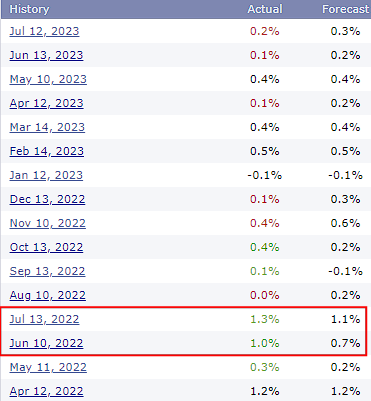
Fig. 1: MoM and YoY CPI readings [source: BLS.gov via ForexFactory]
Notice the sizable jumps during spring/summer 2022, and those “hot prints” rolling off in the calculation are the primary reason measured inflation is down (disinflation). In the reading ~2 weeks from now, we should not be surprised to see inflation move back up, aka “Reflation.” Let’s apply historical data to model future inflation, shown in Figure 2 below.

Fig. 2: Historic inflation and modeled paths
Note: everything is modeled in a linear fashion, as I can’t possibly predict the change for every month going forward. The models are:
Scenario 1 - Goldilocks: 0% MoM (highly unlikely). Result: 2.5% by year-end
Scenario 2 - Same Old Story: 0.3% MoM. Result: 4% by year-end
Scenario 3 - The Great Reopening: 0.5% MoM. Result: 5% by year-end
Scenario 4 - Peak Inflation: 0.7% MoM. Result: 6% by year-end
As we can see, there is no path to 2% inflation without deflation, which we last saw during the early days of Covid in spring 2020, and isn’t as rosy as the “Goldilocks” headlines would have you believe. Additionally, none of the above include inflation Black Swans, such as geopolitical tensions rising, China unleashing similar stimulus as the US did from summer 2020 onward, or oil going vertical for any number of reasons, some of which are self-inflicted. Scenario 4 would be the closest approximation for the aforementioned developments and results in inflation doubling by year-end, so clearly the Base Effect cuts both ways. At the end of the day, whatever headlines you choose to believe, it appears the Federal Reserve is not going to cut rates until their hand is forced, which isn’t good for any of us. Until next time, be excellent to each other.
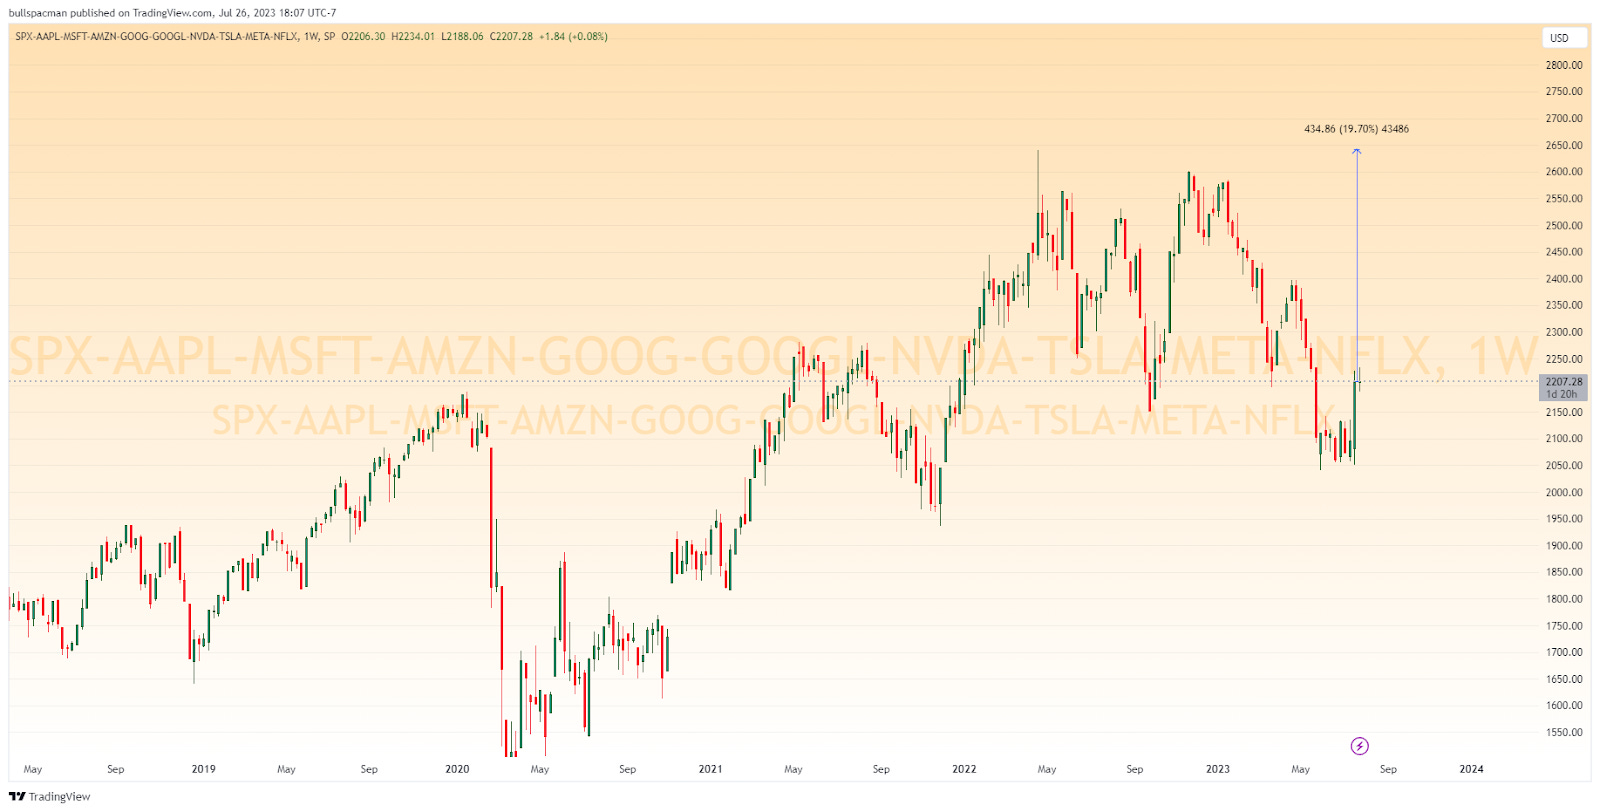
PS: Note this wild chart showing the S&P without the Big7 tech names and NFLX………. Then chart it without. Either the biggest catch-up rally we ever might see in our lifetimes or one of the most concentrated bubbles in history, en contraire.
thank you, great coverage!