7/23 Weekly Report - Market Madness, Don's Data, an Everything Rally, and a Brick in the Wall!
This weekend's report is a killer compilation from MacroEdge contributors. Focusing on everything from the housing market, to student loan repayments, M2, and breadth data - you won't miss a beat!


Contributors for this week:
@DonMiami3, Chief Economist (Weekly Macro Market Update)
@SixFinance, Head of Research (Six’s Market Weather Vane)
@BullSpacman, Contributor (What if Everything Else Rallies?)
@MrAwsumb, Contributor (Just Another Brick in the Wall)
Weekly Macro Market Update
(@DonMiami3, Chief Economist)
Hope you all had a great weekend and are having a great evening thus far - from 45,000 feet. I’m sure a busy workweek ahead for many of us as things hit the back to school overdrive season before the holiday slowdown times (not too far away!). Today will be more of a discussion with some charts, we have a lot of great contributor pieces as well from Six, Awsumb - a new contributor with almost 30 years in the RE & RE analysis space, and BullSpacman - who’s here to talk about a variety of different topics.
If you haven’t followed us on some of our social media pages - you can now join us on LinkedIn at https://www.linkedin.com/company/macroedgeres
The rest can be found on our website at MacroEdge.net - where you can also sign-up for pre-access to our soon-to-be-released industry-changing solution, MacroEdge Ascend.
I’ve been talking a lot about the real estate market on Twitter today - mainly in regards to the current dynamic that are leading to many think the real estate hard landing is over or the real estate market will remain like this forever. I am adopting the view that “oh just rent it out” crowd are people that actually want to sell the house but can’t do to the current rate environment in the home market. We went from essentially free money in the housing market when the Fed cut to zero (a lot of people re-fi’d or bought at sub 4%) and now cannot afford to move to something with a 6.9% rate at a cost-basis that is 50% higher than their current situation. I am expecting that the dynamics of supply may be inverse for this cycle. Lower rates will lead to more supply and put further pressure on prices with actual price discovery. Right now - people don’t even know what to price their houses at because activity is so low. My main takeaway on the current RE market dynamics are never say forever.
Now onto some important datapoints from the last week (a reader favourite!)
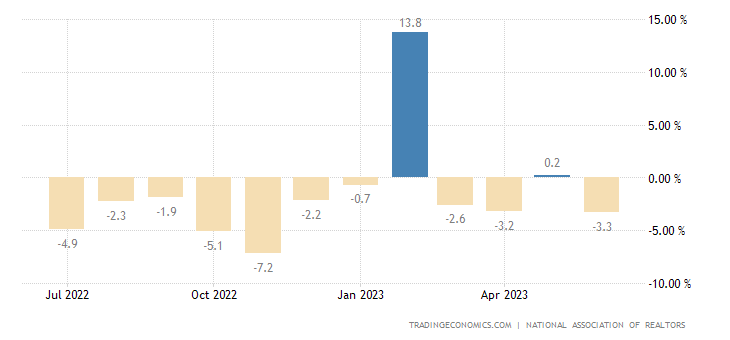
Starting off on the housing market (above) Existing home sales continue to fall at the fastest pace since 2008 - the market is hanging on by a tiny thread (new home sales by a select few builders). Rate locks are keeping inventory low - what will happen when job losses increase & Fed cuts rates?
Judo Australian Service PMI in contraction territory again, small MFG sector there saw a bounce but still contracting Composite PMI actual 48.3, previous 50.1 Lowest since December 2022
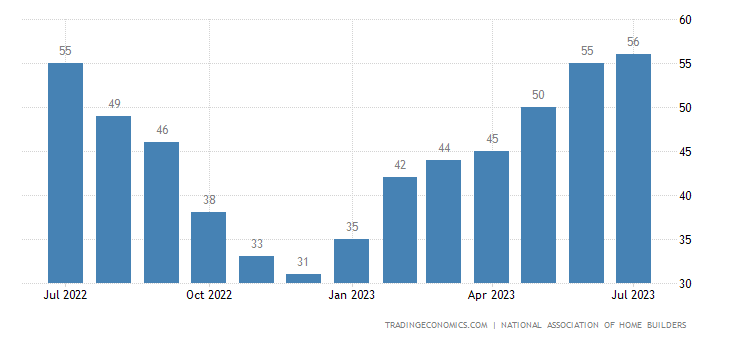
The bounce in the housing market that permabulls have been raving about appears to be slowing down NAHB index actual 56, previous 55
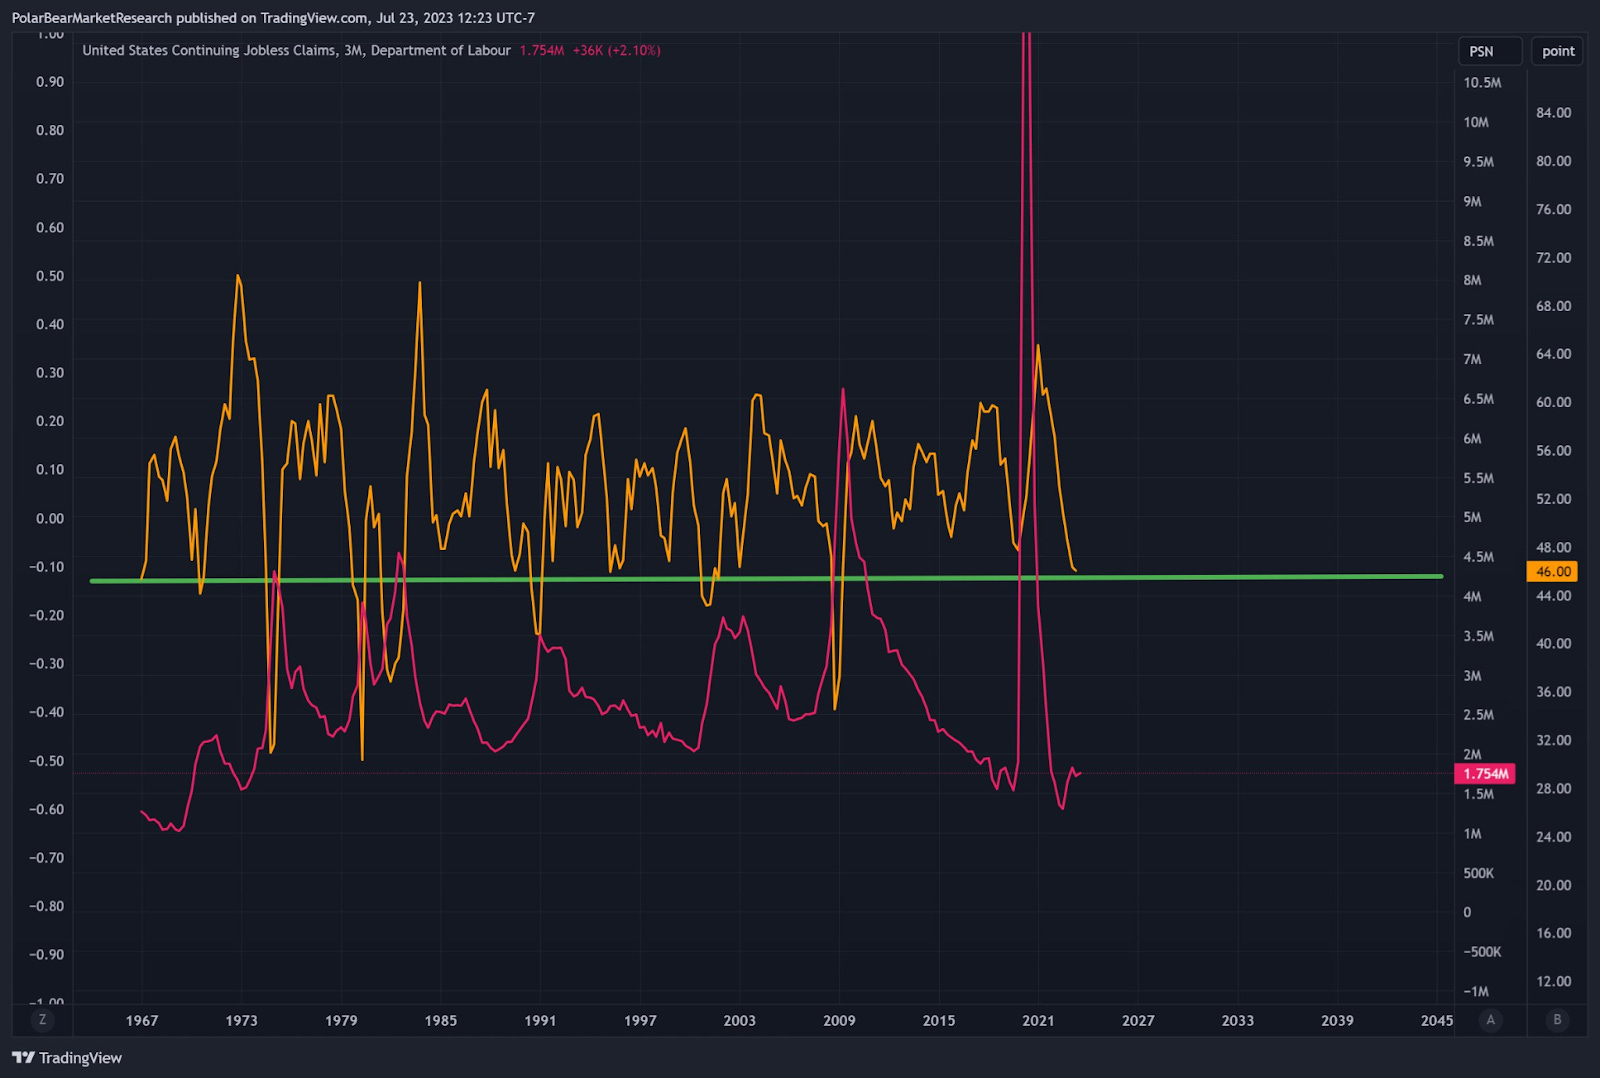
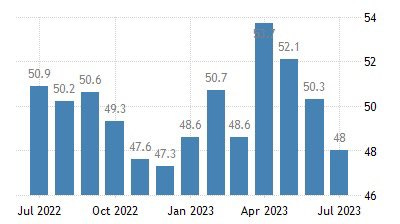
When the manufacturing PMI declines below the 45 level on the index - continuing claims tend to rise very sharply after that point. It's currently sitting at 46.
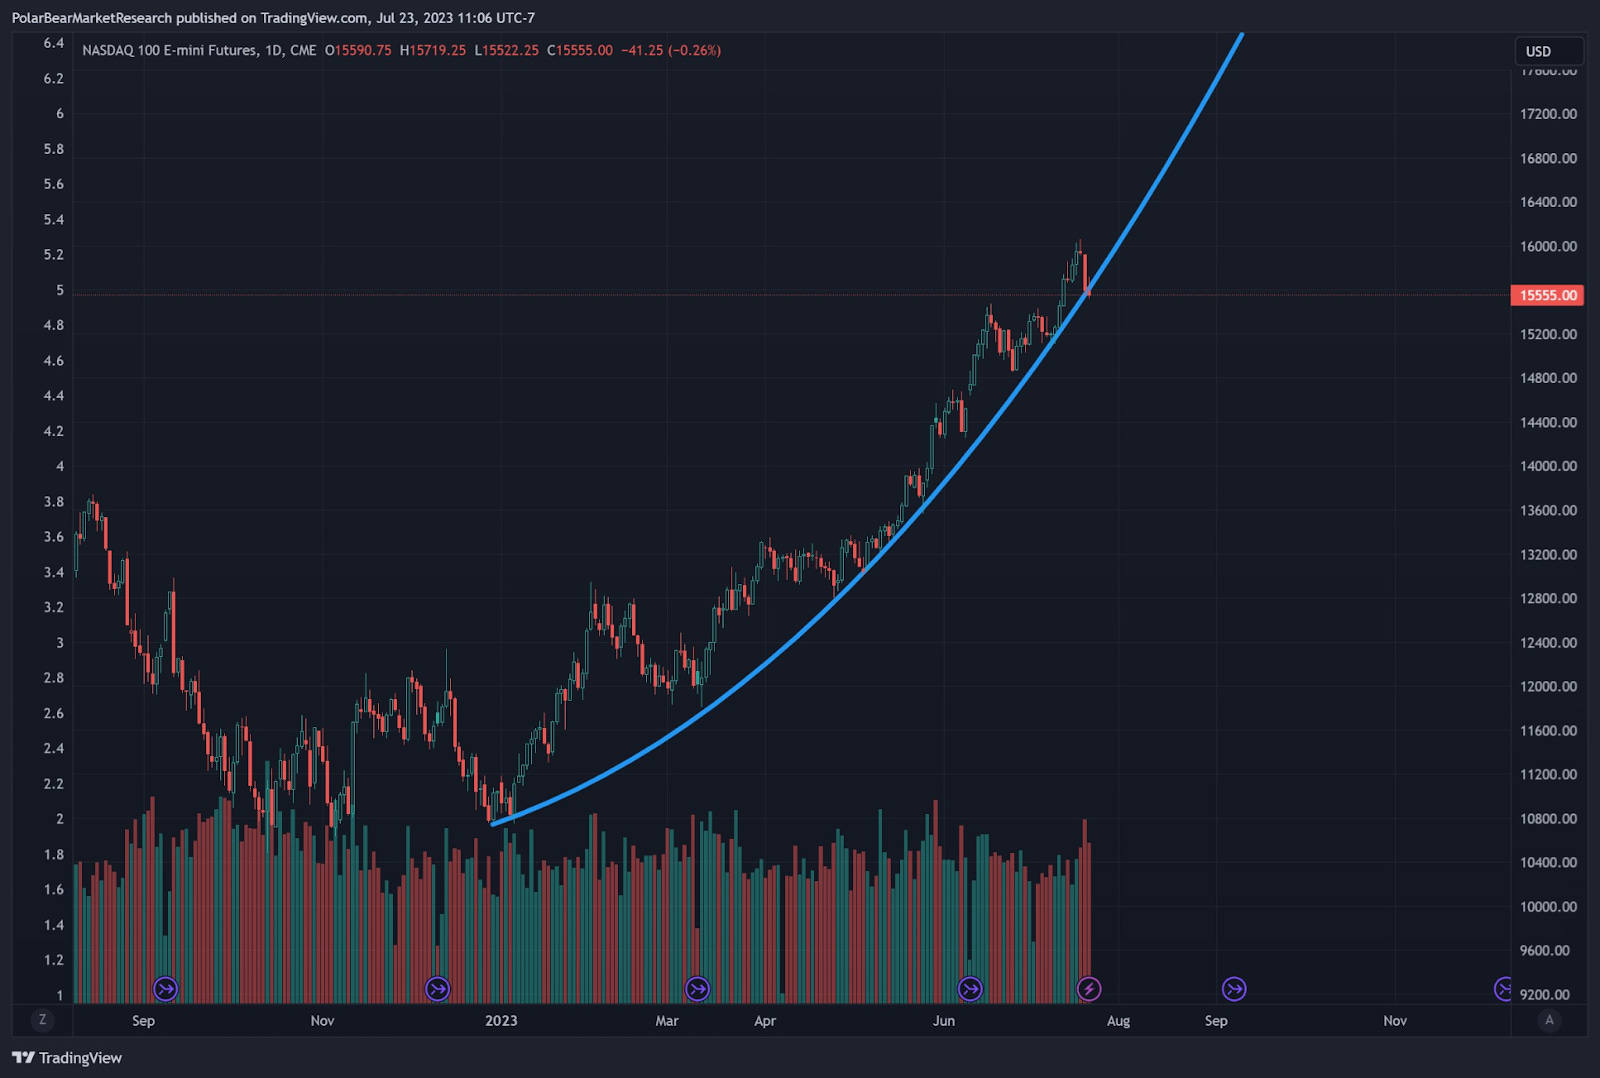
Nasdaq struggled to hold Valhalla through the close last Friday. Futures will be interesting.
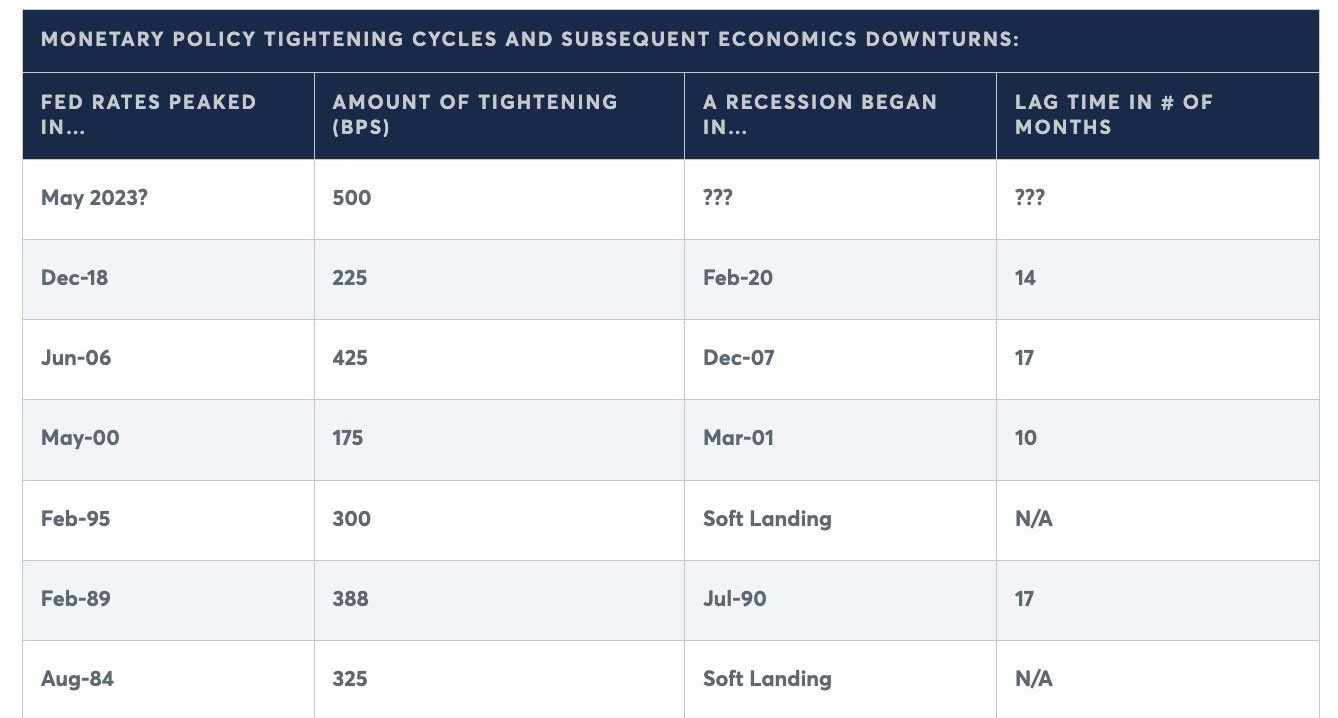
Following up on a point from last week about the time from yield curves bottoming and the start of recession - here’s another important one:
What do I mean by “respect the lag” - a phrase I use often in my write up for this evening? Your recession countdown doesn’t really began until rates have peaked & the yield curves begin pricing in cuts…
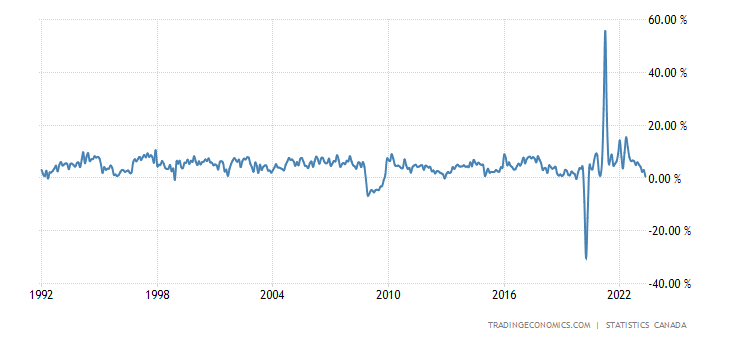
Canadian Retail Sales YoY index at its lowest level since the pre-stimulus madness in 2021.
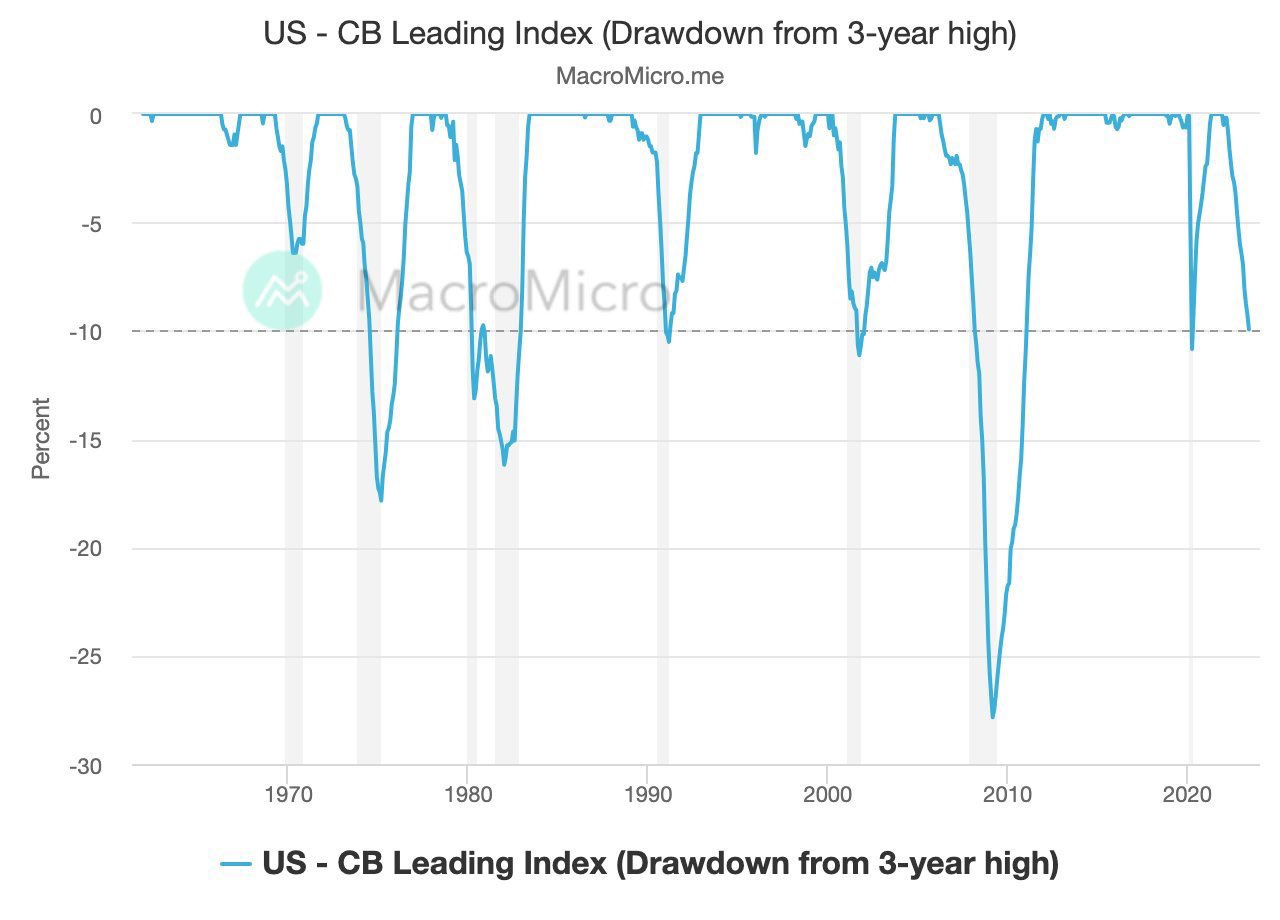
The Conference Board Leading Index is at a level that has occurred before/during the last 8 recessions in the United States. Now seeing economists come up with models to debunk this (yield curve doesn’t matter, new orders who cares, stocks go up!) Expecting further drawdown from here.
Following up on the above -
The Conference Board Leading Economic Index rolled over last month after a small bounce - pointing to further weakening in the economy ahead. Gloomy consumer expectations, weaker new orders, rising unemployment claims, and reduced housing construction spell trouble. The longest streak of declines since the Great Recession.
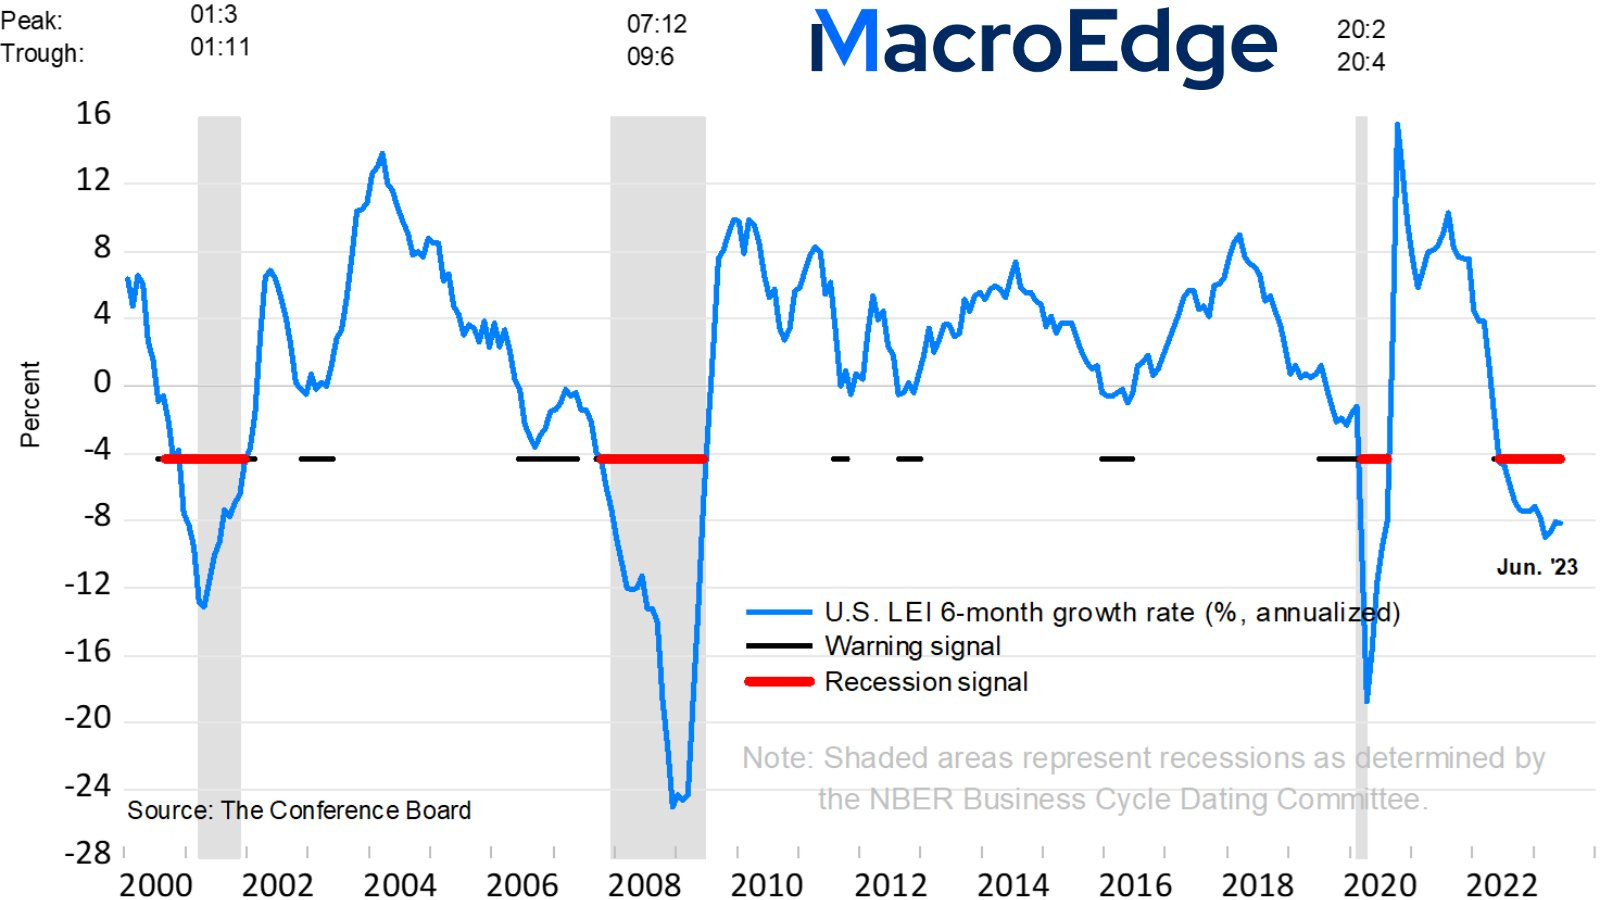
Do you buy into the mirage?
14th negative reading in a row for new orders suggests that we are not on track for a soft landing. Employment - which the Fed is trying to break - is the only thing keeping this train on the tracks. Disinflation will hurt earnings further.Philadelphia Fed Manufacturing Index signals ongoing contraction (-13.5), worse than expected. New orders and shipments decline, and employment remains steady. Prices paid below average, prices received rise. Challenges persist in manufacturing.
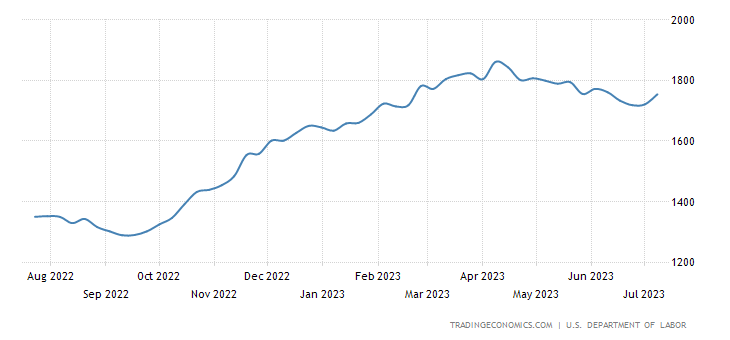
The rise in continuing claims by 33,000 suggests increasing challenges for job seekers as job openings continue to drop. Trend continues to follow your typical rise in continuing claims after the 10 year / 3 month inverts.
The initial jobless claim remains within the typical trend that occurs after a 10year/3month inversion. Claims decreased by 9,000 to 228,000, reaching the lowest level in two months and beating market expectations.
That’s a whole lot of charts and a whole lot of data to digest, I’ll let the others take it from here!
Six’s Market Weather Vane
(@SixFinance, MacroEdge Head of Research)
MacroEdge… it has been a pleasure to converse with all of you thus far, and I am excited for the things we have in store for our subscribers.
Last week we saw Microsoft gain more than the entire market capitalization of Disney or Wells Fargo on the mere mention of an AI based subscription service, catapulting Microsoft past all time highs, before retracing the entire move over the rest of the week. Apple had a similar occurrence in which the AI stock pump retraced nearly immediately. This, coupled with NVDAs poor performance this week, tells me the AI craze has met some serious resistance.
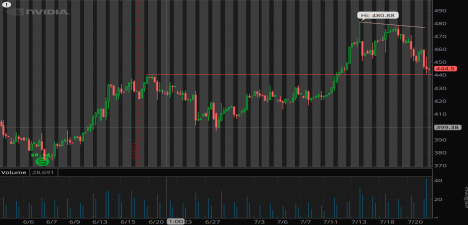
Nvidia is in a very interesting spot technically. A top has appeared near the 480 level which is shaping up to have held on retests. Price action has broken out to the downside with a minor bounce off of its next major demand zone, previous supply zone. If this support for the stock goes, well, if you’ve been reading our publication you know my feelings on NVDAs effect on the Nasdaq currently. To add fuel to fire, Taiwan Semiconductors (largest chipmaker by market share on the planet), guided lower for Q3 this week, which gives insight into the legs that the AI mania really has in my opinion. Shaky, at best. Certainly not deserving of the valuation multiples that large firms are getting, regardless of what the sheep want to run price action at, but that's another conversation.
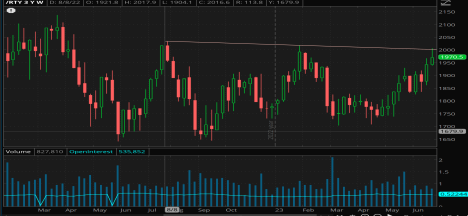
Market Indices posted downside retracements throughout the week, with Nasdaq coming off the most, led by TSLA’s margin compression and Netflix revenue miss. Both stocks posted large losses following earnings, as both were priced for perfection coming in, and fell short of the massive expectations that had been priced in. SPX declined modestly. DJIA has been strong, following large gains in bank shares. Nearly all of the large banks posted strong gains, with Schwab and Morgan Stanley leading the way, on better than expected results following the collapse of 3 regional banks in March. Russell 2k rejected its’ upper trendline showing a potential halt in risk appetite from speculators.
Record breaking heat waves thus far this summer puts pressure on commodities prices, something to keep an eye on for commodities to breakout to the upside. June was the hottest on record. Also, Russia pulling out of the Grain Deal puts immense upside pressure on wheat prices, at a time when wheat is already feeling pressure from global heat waves. It would not take a whole lot to see commodities generally start cycling higher from here in my opinion.
The screen actors guild strike over AI likeness and pay related issues continues to hold, putting more pressure on content related equities.
This week we have a jam packed schedule and you can likely expect some volatility, especially in the Nasdaq. Microsoft, Google, report on Tuesday after market close. Wednesday, Meta after the close. Wednesday morning we have new home sales, forecasted at 717k, down from May 763k print. We also Wednesday have FOMC policy rate decision, followed by Powell presser. Forward guidance on rates from Powell will be center stage, as market is pricing in this rate hike being the last of the cycle. Bank of Americas’ fund managers survey is reporting over 68% of managers predicting a soft landing, which is quite early to forecast with the known lag on policy rate on the greatest rate hike velocity in quite some time and M2 money supply decreasing YoY as we have touched on previously.
To close out the week ahead, we have initial jobless claims on Thursday, which is sure to be closely watched. On friday, we have the PCE and Core PCE (FEDs preferred gauge of inflation).
While market breadth has widened over the past few weeks, it is important to note that AI craze is still leading the market higher. Keep a close eye on AI related equities. We could however, be seeing a rotation out of tech and into value for the next market leg higher, should there be continued upside. Trend following has been the big winner so far this year. I would advise extreme caution jumping into unprofitable “meme stocks” *cough cough Carvana*.
Following Wednesdays’ policy rate decision, we must pay close attention to the forward rate guidance, while also being aware that Federal Funds Rate cuts have been historically extremely bearish. The FEDs higher for longer rhetoric will likely remain until the economy begins to deteriorate substantially. Powell has made it clear he wants to avoid the 70s mistakes of repeatedly hiking and then lowering policy rate and letting inflation reaccelerate. The FED is aware of the inflationary effects of raising money supply so quickly and is sure to attempt to avoid letting inflation reaccelerate.
What if Everything Else Rallies?
(@BullSpacman, MacroEdge Contributor)
The start to H2 of this year has been interesting, to say the least. It kicked off with investors tripping over themselves to stay long growth as they took the bait of “Soft Landing” headlines hook, line, and sinker. However, the Cinderella Story came to a screeching halt this week as Tesla and Netflix tumbled 14.5% and 12.7%, respectively, from peak to trough using the pre-ER highs and end-of-week lows. Nothing to see here; just typical bull market stuff when tickers exceed street estimates 😉. Will the pattern continue with other high-profile technology names reporting during FOMC week and beyond, or will some names buck the trend? While it’s not for me to answer that, we can observe other clues in the market to look at potential trades that allow investors to capture upside while reducing volatility, aka Sector Rotation.
Fig. 1: Weekly performance for healthcare (XLV) and consumer staples (XLP)
The above graphic shows the weekly chart for healthcare and staples as indicated by their sector ETFs XLV and XLP, respectively. Some basic technical analysis is included to show the consolidation patterns both are breaking out of, as well as past all-time highs. This price action was very much on display in individual names, with UnitedHealth Group (UNH) going for a 15% jaunt in 4 trading days after reporting and Johnson & Johnson going 7.6% after earnings to close out the week. In the Consumer Staples segment, statements from various CEOs about the health of the consumer initially put a damper on names that beat estimates, but they have started to move up now as well. You might be saying to yourself, “That’s great Bull, but what can I do if I missed out on the run?” Enter stage left: Utilities. Yes, that boring sector we tend to forget about, but would be completely powerless without, pardon the pun. There are a few ways to enjoy this trade, with exposure to the XLU ETF being the most straightforward one (Fig. 2 below).
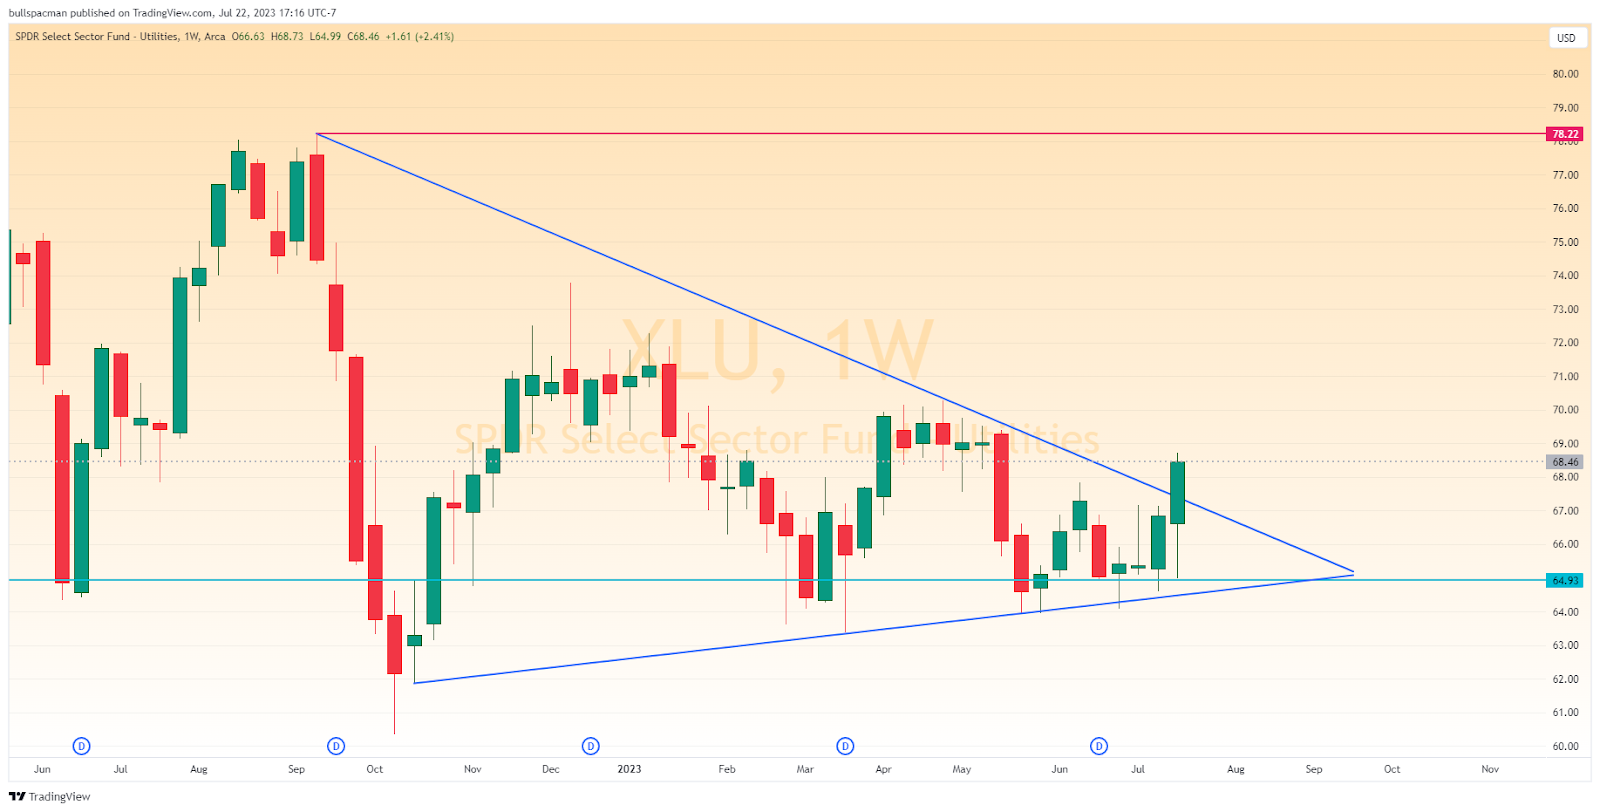
Fig. 2: Weekly chart for the utilities sector using the XLU ETF
To be very honest, the breakout shown above is very reminiscent of Costco (COST), which spent a year consolidating and is now rallying back towards ATH. Is that what’s in store for XLU? The earnings season should provide some hints. While companies loaded with debt service charges will generally have an unpleasant time the longer we stay in a high-rate environment, there will be opportunities aplenty for those willing to look beneath the surface for unloved gems, starting with NextEra Energy (NEE), set to report on 7/24 this week. Additionally, utilities are now beginning to outperform the S&P 500 as indicated by the chart below.
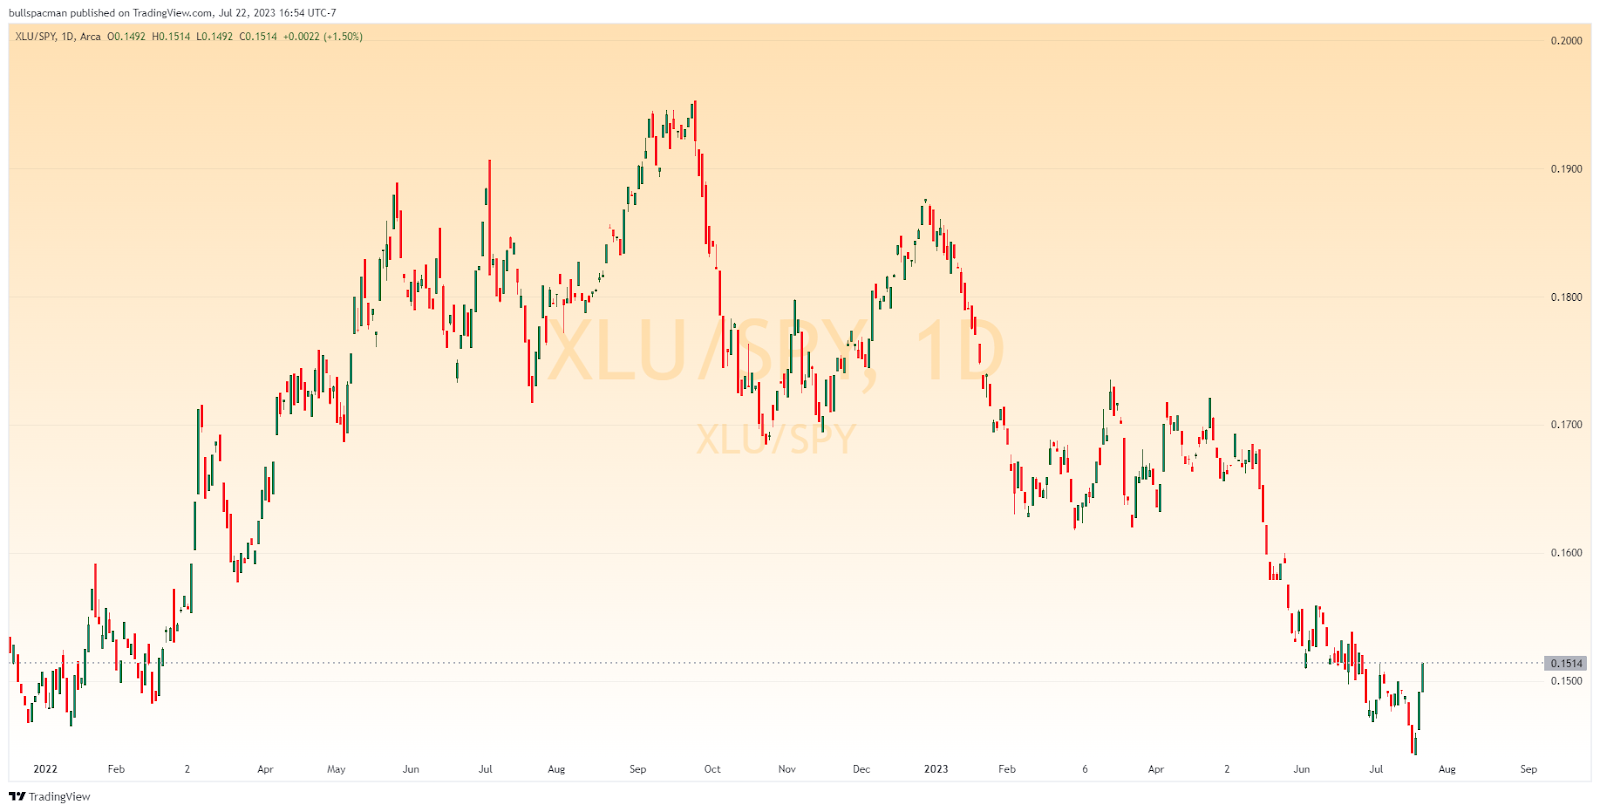
Fig. 3: Utilities vs the S&P 500, as shown by the XLU/SPY ratio
While nothing contained in this post is financial advice, I would suggest being patient with the rotation trade. The chart above showing XLU outperformance is a very small sample size of just three trading days, but it’s something I’m watching keenly for signs of continuation. Whether you choose to add exposure to healthcare, staples, utilities, or a blend of the above, consider the financial health of the company before adding exposure on individual names, or stick to sector ETFs to mitigate risk. The S&P 500 has been ripping higher for the last 4 months seemingly without a pause. During the recent stretch of the rally, sentiment on social media has generally been along the lines of “What if everything else rallies?” Well, it looks like those lost in bullish euphoria are about to get their wish. It just might not feel as nice as they envisioned from a P&L perspective if they’re still 100% long tech.
Just Another Brick in the Wall
(@MrAwsumb, MacroEdge Contributor)
A little background about myself: I've spent the last 26 years in various roles of property management, construction management and real estate development, have held contractor and brokers licenses, and am a certified analyst. My career has spanned working the spectrum from small companies (under $15M) to the 10th largest publicly traded homebuilder in the US. I study macro and micro economic conditions daily.
By now I'm sure you're aware that Student loan repayments will begin on October 1st. 1 The Median student monthly debt payment is $2222 . That will be less buying power for the US consumer and may make it tougher to pay for housing. Not news. But here are some different increases in home costs that will be kicking in in Q3 of 2023.
When new home sales slowed dramatically last year, many builders opted to buy down mortgage rates. Why is this important? According to a John Burns Real Estate Consulting3 survey (these folks do great work) only 32% of builders bought down full 30 year term rates. While 43% bought down shorter terms like the 2-1 Buy Down. In essence, buying the 1st year of the mortgage rate down 2%, 2nd year 1% and after that, those payments go back up to the rate of the time. So an ARM, but guaranteed to go up on years 2 and 3.
For reference, the average Conventional 30 year mortgage rate October 1st 2022 was 7.09%4. The median Sales price of new homes was $493,0005. So those buyers who purchased in October of 2022, come October 1st 2023 will go from a then bought down 5.09% rate, to payments based on a 6.09% rate. Using a conventional mortgage, at 5% down, that payment will go from $2,540.32 per month to $2,835.45 starting Oct 1st 2023. An Increase of $295 per month for principal and interest only. Or an 11% increase of homeownership costs Y.O.Y. without ever adding increased real estate taxes or insurance rate increases. As for volumes transacted; 2022 Q3 New Home Sales6 were at 139,000, Q4 at 131,000 units, Q1 2023 at 183,000, Q2 125,000 as of June7. Further, 10 of the 15 largest builders offered or are offering temp rate buydowns. Those 10 account for 50% of all market share. Those 5 not offering temp buydown make up 12% of market share.
Also for those looking to buy, starting August 1st, Freddie Mac is retiring allowing Unplanned Buydowns. To Quote: “Unplanned buydowns arise from an increase in Mortgage market interest rates between the date of the sales contract and the Note Date”. From section 5501.5 d)8
From the surface of a couple bricks in the wall. How’s the mortar look from there?