6/4 Weekly Macro Report - Copper, Debt, ISM Data, Tech, QE, and More
This weeks update features a comprehensive market update from our expert contributors focusing on various aspects and elements of the economy and financial markets.
Another week of mixed economic data flew across the terminal - with a blowout jobs report and surprise JOLTS update to the upside - while we saw more muted and negative numbers in things like the Chicago PMI report. For starters - this labor market remains resilient (as has been said for months) - and rates will likely stay elevated until this breaks. When the labor market breaks we will get confirmation of a recession but continuing claims have yet to break 2 million and the unemployment rate still is at 3.7% (a slight uptick in last weeks update).
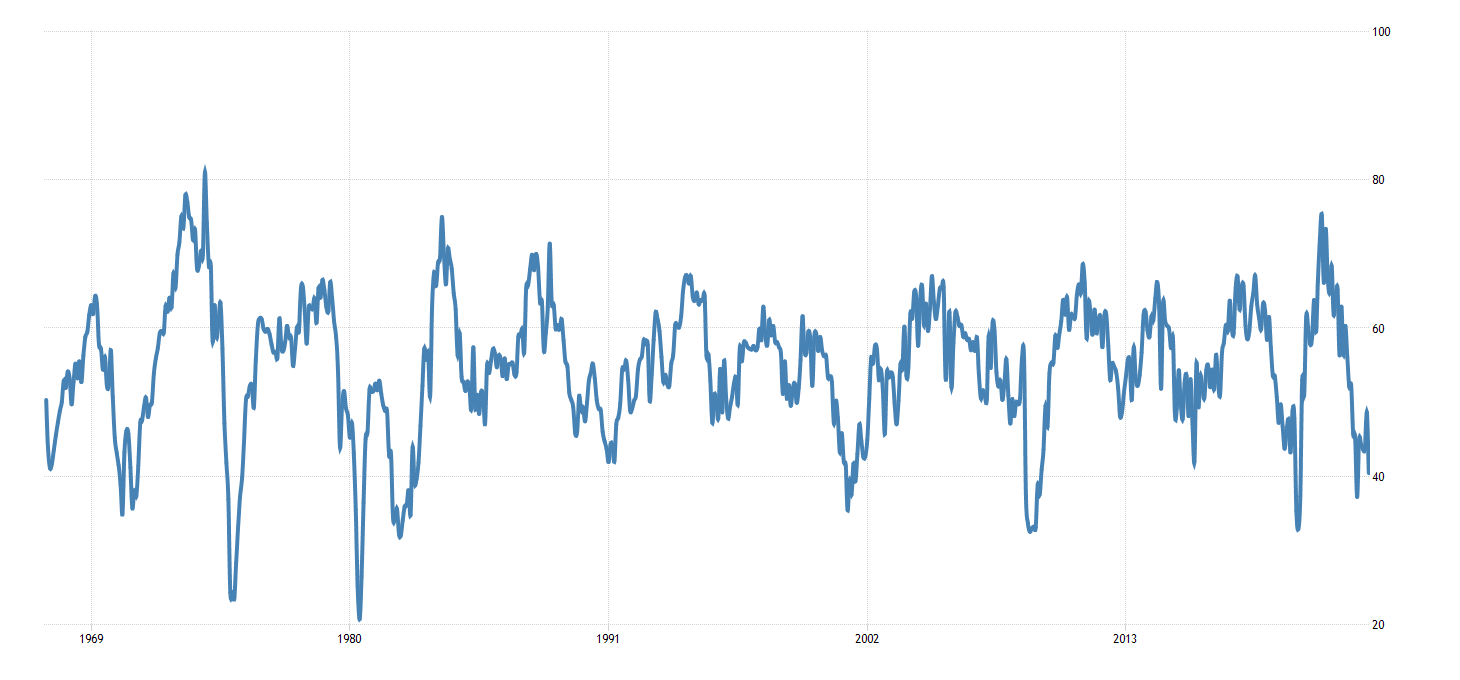
Looking at the Chicago PMI - activity is looking close to recessionary levels. A reading below 40 historically since the early 2000s has indicated a recession - although the early 90s is an exception even though there was a relatively mild economic contraction (the base case for most banks, the Fed, and analysts right now).
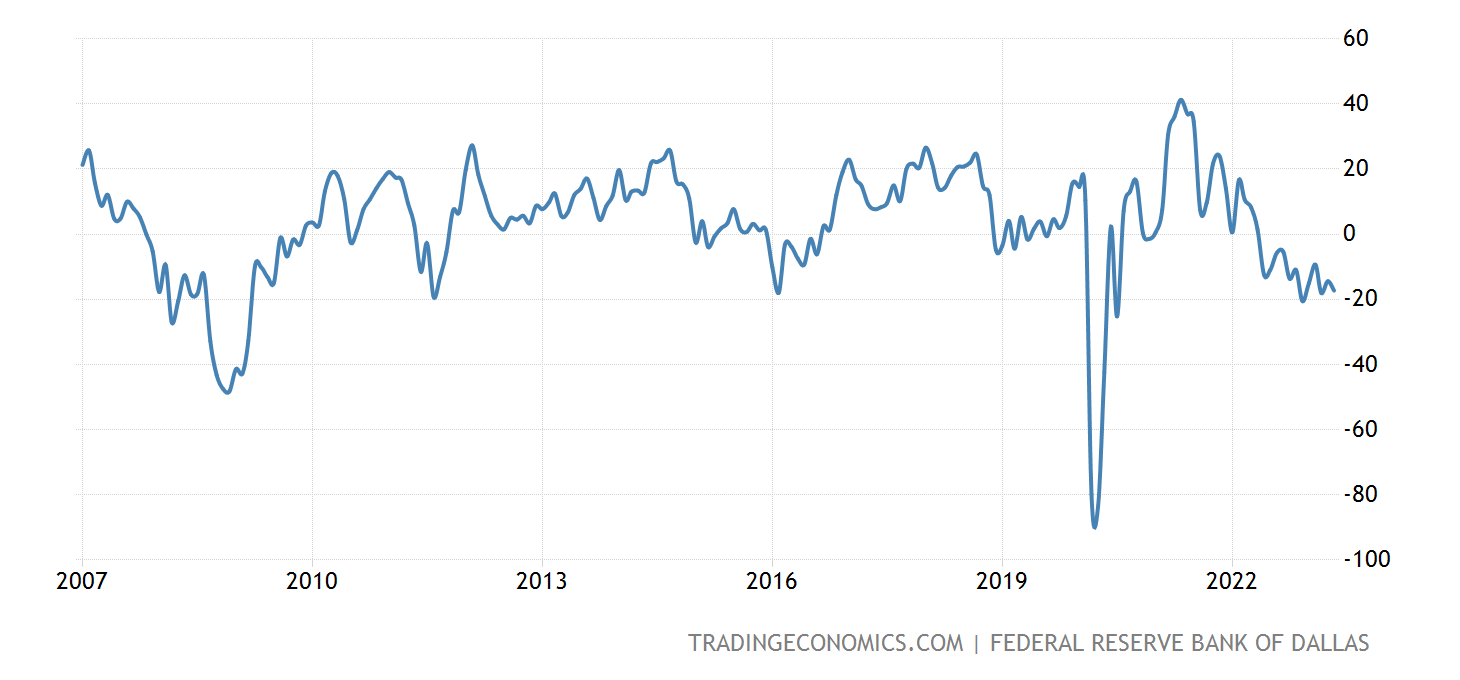
The Dallas Fed Services index showed resumed service sector weakness for the Southern Fed region - declining month over month from -14.4 to -17.3:
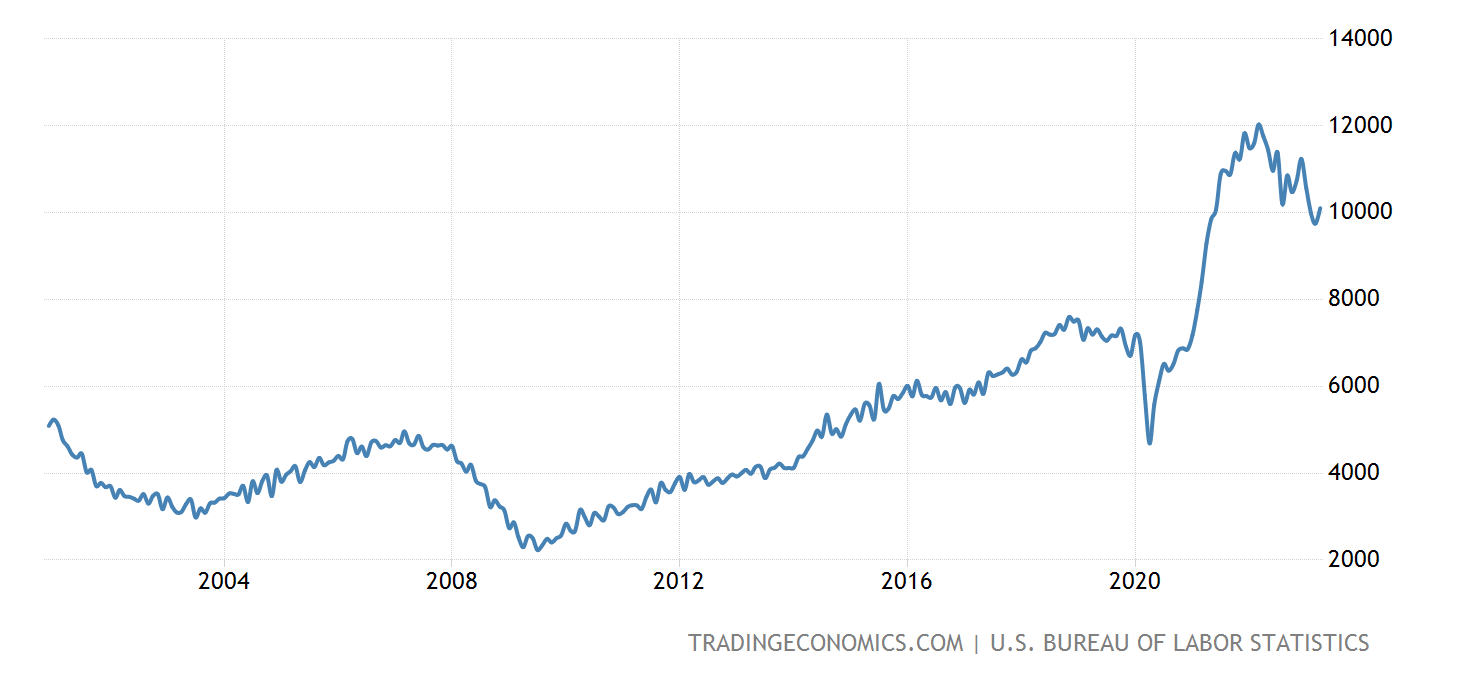
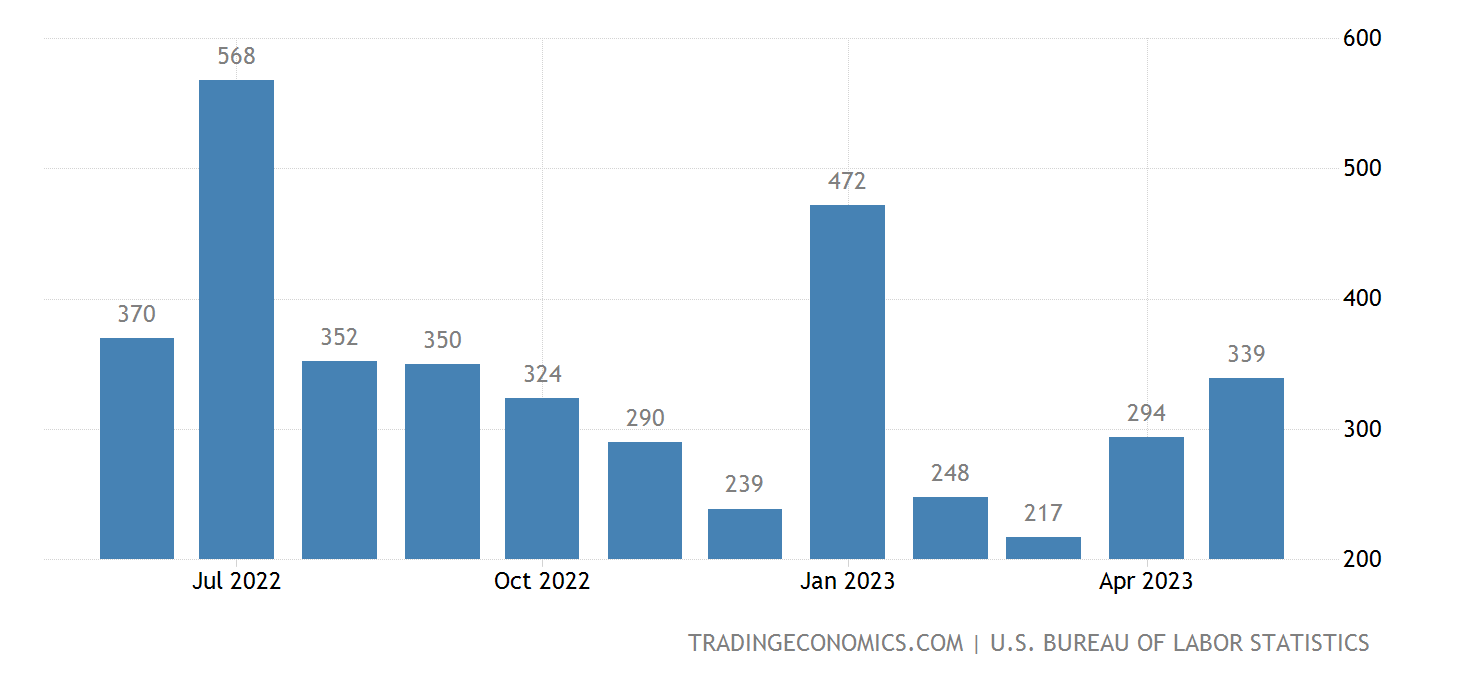
Job openings and unemployment remain the ‘hottest’ indicator against a recession right now - with job openings adding over 300,000 month over month and the economy adding 339,000 jobs in the last month. While JOLTS remains elevated - it’s my opinion that we continue to see a downward trend in job openings even with a worsening demographic picture - and I expect that number to dip below 8 million job openings in a recession. A lot of these openings are either soft openings, positions nobody wants, or intra-company listings from what we’ve seen.
Below is the blowout jobs number that got the market really cranking this week - with risk on going bananas (literally) - even though the unemployment rate ticked up to that 3.7% figure.
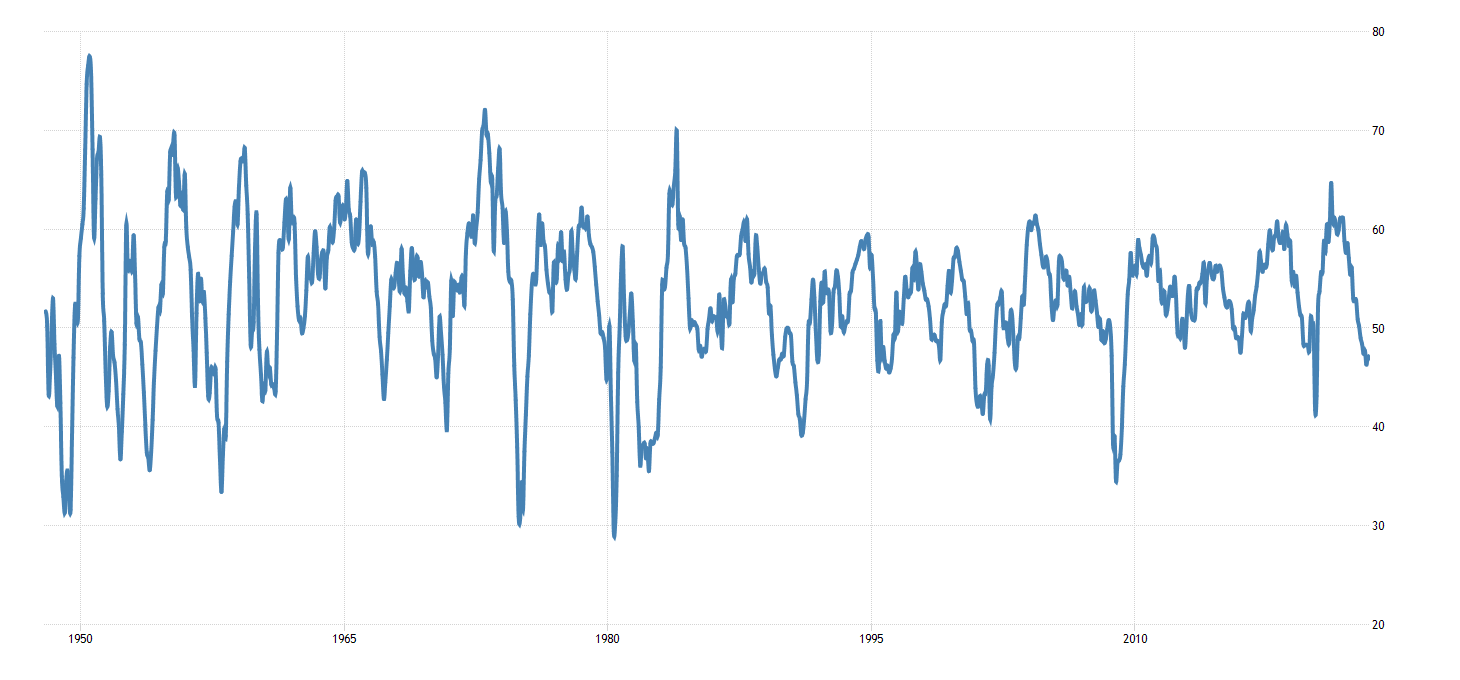
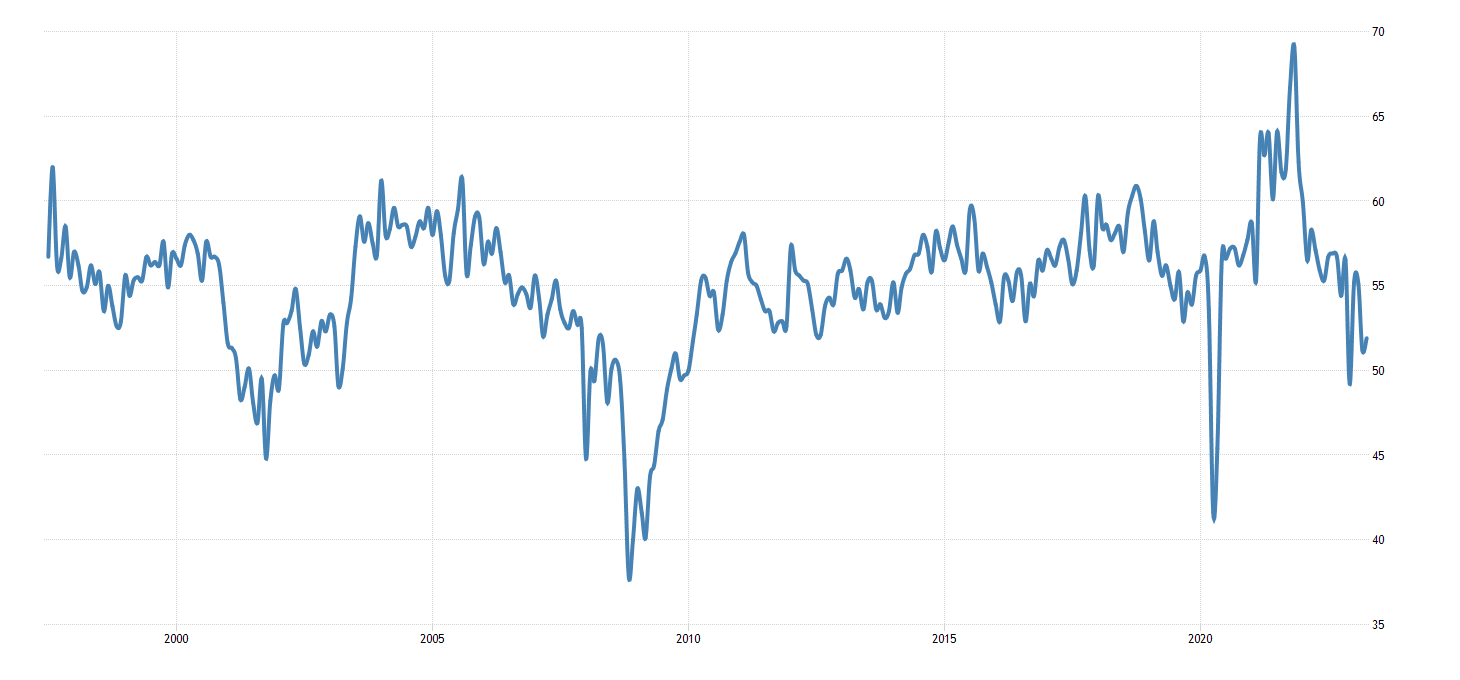
The ISM manufacturing index saw a resumed decline last month, while the services PMI did not - highlighting weakness across in the manufacturing sector in May, and not as much weakening in services from last week's report. One thing that remained strong was manufacturing employment, on top of construction spending, and new heavy truck orders. I would argue we’re near a top for both construction spending and heavy truck orders given the cost of money right now. Top to bottom: ISM manufacturing index and the ISM services PMI. The global service PMI highlighted a decline - pointing to some of the weakness seen in Europe.
Keeping it short this weekend as it’s a busy week for myself and all of us ahead. The MacroEdge team has a lot of work to do as we continue to build ourselves out and expand into the business market and we thank you all for taking the time to read these short weekly reports. Stay tuned for more updates on what’s to come!
Sector Update: Copper (@MarketMonkPicks)
Copper has long been viewed as a leading indicator of economic health because of its broad use in homes, factories, electronics and power generation. Traders and investors are wise to stay on top of its health, and a number of copper stocks have provided opportunities for traders, outperforming many other sectors to close 2022 before seeing a recent sustained drop YTD. In this writeup, I’ll summarize some of the factors behind this recent decline and outline what I see as some opportunities ahead.
In a recent article in the Financial Times, Harry Dempsey, points out “the price of copper has widened to the biggest discount against its futures equivalent in almost two decades.” Some potential reasons for this include weakening demand during China’s stalled economic rebound, interest rate hikes in the US, and fears of a global recession. Natalie Scott-Gray argues that real world weak demand rather than perception of economic factors have taken the wheel and are driving copper prices (cited in Dempsey, 2023). Support for this argument can be found in rising stockpiles of the metal in London Metal Exchange (LME) warehouses (Dempsey, 2023).
The bullish scenario for copper to this point hinged upon a China rebound, which has not thus far materialized at the pace most experts expected. Goldman Sachs points to China and a manufacturing slowdown in the West as their rationale for lowering their forecast on copper from $9750 per tonne to $8698 per tonne.
So what bull case is left? The debt limit deal fueled some relief in copper stocks in recent days, such as Freeport-McMoRan ($FCX) and (Southern Copper Corporation) $SCCO, which each rallied close to 10% to close the week. Beyond avoiding a disastrous default, as the debt limit deal works its way through committees, there are some potential benefits for copper in renewable energy, electric cars and infrastructure spending. Bank of America is the most optimistic in their forecast of $10,000 per tonne based on these factors and a more optimistic outlook on China.
As a trader, $FCX and $SCCO have some appeal to potentially retrace to April highs even on a modest sector rotation out of tech. A more sustained move to the upside seemingly would require economic conditions to improve, most likely through a surge in infrastructure spending in the US and an acceleration in China’s economic recovery.
References
Dempsey, H. (2023, May 23). Copper price slides as global demand drops sharply. Subscribe to read | Financial Times. https://www.ft.com/content/479c524f-c5ea-45a2-8bc3-c66eaf4f83a5
Debt and The Most Tragic Generation (@TexasRunnerDFW)
Behind her beautiful veneer of economic prosperity, America has a debt problem. And behind America’s debt problem lies a generation that has become the sacrificial lamb on an altar of accommodative monetary policy: Millennials.
Our financial lasciviousness never ceases to be fodder for the ivory tower establishment—we lust after forbidden fruits like avocado toast and imbibe the steamy froth of overpriced lattes. We were last to be invited to a bacchanal of debt; we were first to embrace the most obscure permutations of it. Six figure student loans? Buy Now, Pay Later? Margin on Robinhood? Like
Eve in the Garden of American Hegemony, we bit into shiny new debt instruments without questioning where they might lead us. Now our eyes have been opened: we can’t afford this, and the system isn’t sustainable.
American Millennials confront a pecuniary Faustian Bargain: do we continue to sell our souls to debt in order to remain the consumers our economy and Boomer parent’s inflated retirement assets need us to be?
The alternative is nearly unthinkable: if we collectively embrace the very austerity that Boomers laud as the crucible of their success, our consumer economy collapses. It’s the equivalent of an entire generation boldly marching into the attic of the Eccles building to rip the curtain off a portrait of a balance sheet that reflects the grotesque disfigurement of our indebted economy. Like Dorian, we know our country can’t bear to face it.
Given these two undesirable choices, we’re a bifurcated generation. Some of us willing lie on an altar of insolvency, begging for merciful accommodative monetary policy from the powers that be. We make our offering in exchange for political policy to bandage the inevitable wounds that occur in an overly indebted system where the top 10% rely on the blood sacrifice of the bottom (mostly younger) 90%. We’ll do this for you if you cancel our student loans, raise our wages, give us remote work, or hand out stimulus to stem the bleeding.
Others of us refuse to lie down at all, believing we can escape the slaughter, or at the very least, go out on our own terms. Those who refuse to participate have done the math. Political theater aside, the US simply doesn’t have the GDP and tax income to service over 30 trillion of national debt. Period. So, the austere cohort of millennials quietly eschew debt, choose the trades over advanced schooling, and accrue savings, waiting for the next entry point to secure real assets such as precious metals, real estate, or Bitcoin. We know where this is going.
We keep a wary eye on the Fed’s ever-expanding balance sheet, for the soul of our reserve currency is at stake. Our generation entered adulthood watching in horror as enemy planes crashed into the twin towers. The World Trade Center, the heart of our financial hub, exploded
in flames. In the decades since, we’ve witnessed our currency being attacked from within by blunt force potent monetary policy instruments that were never meant to be permanent. A global pandemic, the pinnacle Trojan horse, ushered in trillions of dollars to a balance sheet that was already sinking under the weight of its existing debt burdens. Our country owes so much money, and everything has gotten so terribly expensive.
Now Jerome Powell rides in on a white steed named QT, carrying the sword of pioneering comrade, Paul Volcker. Is Powell the long-awaited savior we have been waiting for? He may temporarily slay the inflation dragon, but can this private equity-bred anti-hero really rescue us from the burden of our unsustainable debt? It’s not mathematically possible. We’re asking too much of him, and we know it.
Thus, most of us Millennials have quietly taken our place at the altar. Buy a home, go to grad school, take out loans. We’re simply doing what they told us to do. But wearing a thorny crown of debt, our mental health suffers under the weight of upholding a facade of material success.
While we do so, they’ll call us selfish and weak.
Our hands and feet nailed to corporate jobs and ever-increasing side hustles to service the ever-increasing cost of living, we’ll cry out for raises and social safety nets so we can do basic things like afford rent in a safe community and pay the interest on our student loans, the principal remaining ever out of reach.
While we do so, they’ll say we’re entitled.
But are we?
Most of us are too late to profit from it, yet collectively, we’re doing what’s required of us to keep an indebted economy afloat. Because the generation in which everyone was handed a participation trophy knows, above all else, how to participate. Even if that means participating in a consumer debt spiral that ultimately leaves us as a Shakespearean generation in history books.
Thanks for reading MacroEdge Research! Subscribe for free to receive new posts and support our work.
General Equity Risk Update (@SixFinance)
My thoughts on equities: Tech flows have come in over the past week as largest inflows in history as Don has touched on during this past week. Artificial intelligence hype has driven tech into bubble territory, the level of which is up for debate. The S&P 500 is up over 10% YTD while the S&P 493 abcent of mega cap tech is up less than 3% YTD. The rally in equities, perpetuated by a presumed “FED Pause” in the amount of a skipped rate hike, along with AI hype has set the stage for a broad participation equities rally. Nvidia’s ambitious forward earnings projections, despite suffering declining YoY sales numbers, have caused a significant mispricing of artificial intelligence firms. “AI” seems to be the new buzzword in earnings call transcripts. Nvidia itself has been a frequent enjoyer of software trends, recently hitching their wagon to the cryptocurrency trend, followed by the metaverse trend. Although the AI trend has a much bigger leg to stand on, at current stages it does not seem to warrant such excessive valuation. This AI trend is currently pricing in massive growth projections, completely disregarding FED policy tightening.
Student loans are set to come back online this summer, with an average payment of around $400 USD per month, as a result of the debt ceiling deal. This will end the COVID era deferment on student loan payments. The extent to which this will drag discretionary spending has yet to be seen, but is something to keep a watchful eye on in the coming months. To compound liquidity concerns, the treasury is expected to issue over a trillion dollars of treasuries to replenish the TGA.
Despite the recent market activity (congrats to the bulls), risk appears skewed to the downside based on fundamentals, and in some tech names, technicals as well.
AAPL remains my main watched security for the upcoming week with tomorrow’s presentation. Apple stands nearly exactly 1% from all time high, with declining revenue numbers. Obviously AAPL is a golden boy on wall street and main street, but that does not temper the fact that its’ chart presents an interesting opportunity with the current rates environment.
Mechanics and Mythbusting of Pandemic QE (@VanClvg)
Hey everyone! I am beyond excited to be writing my first contributor piece for MacroEdge Research, and I hope I don’t disappoint. I am writing this on the back end of the publishing of a Fed paper titled “Understanding Bank Deposit Growth during the COVID-19 Pandemic,” back in June of last year. I am a bit late to this party, but I highly doubt there is a significant number of people who know this analysis on behalf of the US Federal Reserve even exists, so here I am, trying to make that number significant.
Before we use this Fed paper to obliterate the common misconception that pandemic QE is not inflationary, and that bank reserves don’t cause equity prices to soar by leaking out of the banking system, we must establish the existence of the split-circuit monetary system, as described by Joseph Huber in his book, Sovereign Money. Doing so is vital when it comes to understanding the mechanics of QE and QT. But before we do that, we need to verify the necessity for reserves in the currently constructed debt based, digital, split-circuit monetary system. Yes, even though the reserve requirement was reduced to zero during the pandemic, reserves are still crucial to facilitate transactions amongst banks. Suppose Magilla Gorilla wants to buy a used car, and he finds his perfect daily driver for sale by Yogi Bear on OfferUp (Yogi is a private seller, not a dealership.). Magilla doesn't have cash on hand, but he does have cash in the form of electronic money on deposit at his bank, ApeBank. Magilla’s money in his account is an asset for him, but a liability for his bank. Magilla sends a wire transfer to Yogi’s account at Bear Bank to pay for the vehicle, $3,000. On the balance sheet of the commercial bank that is Bear Bank, this $3,000 increase in liabilities in the form of Yogi’s bank account, needs to be balanced out on their assets. Enter: the function of bank reserves. The Federal reserve issues its own liabilities that it is able to create out of nothing as assets for other banks in the form of reserves. Reserves are an electronic asset that helps balance these interbank transactions, a counterbalance to bank money (more on bank money later). To balance everything out, when Magilla pays $3,000 to Yogi for the car, ApeBank will send the $3,000 to Bear Bank, which then gets added to Yogi’s checking account, (a liability for the bank) AND $3,000 of bank reserves!
So, now we know what bank reserves are and the function they have in the banking system: an electronic asset token that is issued by the Central Bank (the Fed in our case) to settle interbank transactions. Next up is the explanation of the split circuit monetary system, which is really divided into two separate parts with two separate kinds of money: the retail circuit which deals with bank money, and the wholesale circuit which deals with bank reserves. The retail circuit is essentially the money circuit in which non-bank-entities(NBEs) like Magilla and Yogi have their money on deposit at commercial banks, like ApeBank and Bear Bank as detailed above. Retail money, or
bank money, is solely transacted and used between commercial banks and NBEs, but NBEs aren't confined only to regular people like you and me, and Yogi and Magilla. Other NBEs include credit unions, insurance companies, thrifts, and investment banks. Bank money is just the money that is used in retail purchases, including those in the equity markets, specifically, the STOCK MARKET. This, and NBEs including investment banks will become important later.
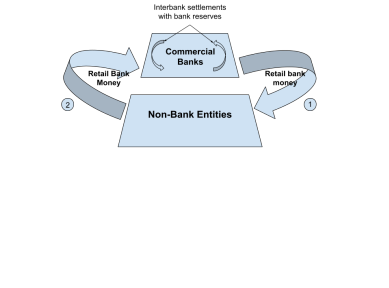
Keeping this image in mind, let’s return to the example of Magilla and Yogi, and we can see on display the mechanics which we described take place. Notice the absence of reserves being circulated between Commercial Banks and Non-Bank Entities. Mr. Huber describes this absence as such: “Reserves are for bank use and interbank circulation only and cannot be converted into bank money in public circulation,” and we can see this above. The only reserves being circulated in this circuit are between the commercial banks themselves, as settlement tokens to transfers of retail money between NBEs and Commercial Banks. As denoted by the number 1, retail bank money can also be created out of thin air via loans and extension of credit, something that was proven in Richard Werner’s 2014 paper: Can banks individually create money out of nothing? — The theories and the empirical evidence. Number 2 is the repayment (and destruction) of the loan by the NBE back to the commercial bank. You can find that article here:
That is the Retail circuit of the Split-Circuit Monetary system, let’s establish the other part of the Split: The Wholesale Circuit. In this write-up we will use the Federal Reserve as the public/government entity that is both the creator and issuer of bank reserves (bank notes too, but that isn't an important distinction in our purposes here), although keep in mind that this is the same structure across almost all debt-based monetary systems we see around the world. This entity could be the Bank of Japan, Royal Bank of Canada, Bank of England, etc. In this circuit of money, the commercial banks are the users of reserves, keeping these on deposit in reserve accounts at the Federal Reserve. This relation is similar to the way that NBEs are the users of bank money that keep this kind of money on deposit at the commercial banks. Here is the Wholesale circuit:
The numbers here are used to denote the “asset swap” that occurs when The Fed buys assets from commercial banks. This is exactly what happened in the GFC when the Fed bailed out the banks by buying the worthless assets like mortgage-backed securities! 1 is the issuance of the electronic asset created out of literally nothing that is the bank reserve, going to the commercial banks, and 2 is the securitized asset (that is priced in reserve money, not bank money) going to the Fed from the commercial banks. This also shows the limited, and frankly nonexistent (until 2019, we will get there, I promise), control The Fed has over the retail bank money circuit, as it is completely disconnected, except through the intermediary role commercial banks fulfill. This disconnection proved very difficult to overcome for the totalitarian, power and control hungry people that run our banking system. Unfortunately, that is in the past tense, and I will explain and visually show this later in the write-up.
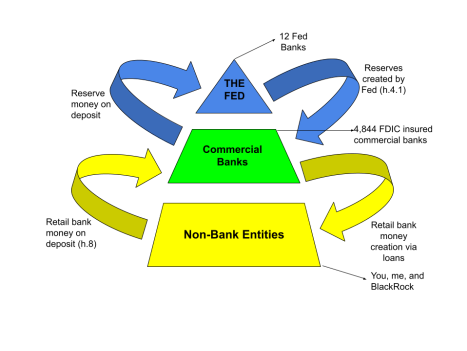
First, allow us to take a step back and put both circuits together. Here is the Split-Circuit Monetary system in all its glory (albeit a very simplistic model):
Since this is our complete model, I added some more information, as you can see. First, pretty colors! Retail bank money and its non-bank entity users (like you, me, and the investment bank BlackRock) are in yellow, bank reserve money and its user/issuer The Fed is in blue, and commercial banks are green, since they were the only entities that
could transact in both reserve money and bank money (again, this is past tense for a reason). The Fed issues new bank reserves to commercial banks via the 12 Fed banks, (such as FRBNY(this one has the trading desk), FRBKC, FRBSF, etc.). There are ~4,844 FDIC insured commercial banks in the US in which NBEs like you, me, and Blackrock hold our bank money on deposit at. The supply, or total amount, of bank reserves in the US banking system can be found in the Fed’s h.4.1 report, and we can find the amount of commercial bank deposits in the h.8 report. It is a vital distinction that cash is completely absent from this electronic, debt based money model, as it is in its own (third) circuit. It is common knowledge, however, that the total supply of money is recorded in everyone’s favorite “money printing” indicator of M2. You can think of M2 as commercial bank deposits plus cash in the US. It is this inclusion of cash that leads everyone to believe that the printers at the Mint are running full steam ahead, but we will soon find out that it is not the printing of physical cash in the form of Federal Reserve notes that leads to the growth of the supply of money in the United States, it’s growth of commercial bank deposits.
Nothing contained in this report is financial advice, it is merely the opinion of various MacroEdge Research contributors. Consult a professional financial advisor before making any financial decisions.