6/27 Special Tuesday Release - Six
Equities market is not as strong as it seems. Fed's tightening cycle is still in effect and real economy is behaving differently from stock market. A special contributor release from @SixFinance

Author: @SixFinance (MacroEdge Contributor)
The Fed has not paused tightening and is still on track to raise rates by 5.6% this year.
The real economy is showing signs of weakness, with housing permits down 12% year-over-year and corporate after-tax profits down 10%.
The yield curve has inverted, which is a sign of a recession.
The AI mania is leading the equities market higher, but this is likely to reverse as market breadth declines.
Crypto is hot, but the existing whales are being smoked out of the market to make way for institutionalized management.
Inflation is still a problem, and the Fed is unlikely to cut rates anytime soon.
Corporate profits are likely to slow in the future, as the boost from declining interest rates and corporate tax rates wears off.
This week I find it prescient to examine the conditions of equities markets and compare what is actually going on vs what is now popular opinion. Equities markets, led by mega-cap tech, have been melting up for the last few months. The “fed pause” narrative has given way to the end of the tightening cycle, and in the eyes of many market participants, the inflation battle is all but won. This is incredibly misguided for many reasons.
While all eyes seem to be on the CPI, many forget that the core PCE is what the FED uses as their primary gauge of inflation. That metric has yet to show meaningful decline. At the June FOMC, federal reserve chose not to hike rates. Markets responded favorably, albeit without taking the full picture into account. The fed dot plot has been updated to show a higher terminal rate of 5.60% Fed Funds Rate and the new FED consensus shows no rate cuts in 2023. Fed funds futures have now priced in no cuts in 2023. In his speech, FED chair Powell said “we are talking about a couple years out for rate cuts”. While financial markets would be correct to question the FEDs forward path because of obvious blunders the last few years (transitory, etc), so far in this tightening cycle the FED has been very transparent about their actions and have stuck to their word as conditions adapt on policy. WHAT DOES THIS ALL MEAN? It means the FED at this point in time has stuck to their guidance regarding higher for longer. Higher for longer equates to dampened at best, negative at worst economic growth.
The real economy is behaving much differently from the stock market. While we see equity indexes ballooning in valuation, it is important to remember that this is led primarily by mega cap tech. The S&P equal weight index is up by a little over 5% year to date, while market cap weighted S&P is up by over 16% YTD. This is important because breadth is one of the main factors that should be examined when looking at giving credibility to an equities rally in considering a bear market rally or new bull market label.
Let’s take a look at some important economic indicators. Housing permits are down over 12% on a year over year basis despite the recent beat. Corporate after tax profits are down over 10% YoY. Transportation freight services index is down YoY although not yet substantially. M2 money supply is contracting on a YoY basis at nearly 5% (M2 has not decreased YoY since the great depression). The 10y-2y yield curve currently sits at -94 basis points. The yield curve is a very important recession predictor, and here is a refresher: “In most normal circumstances, interest rates increase with longer maturities. For example, a 5-year TSY bond that has a 3.0% yield, and a 30-year TSY bond with a 4% yield, have a 100 basis point spread as a norm. Should new reports indicate more positive business with potential inflation as a result, short-term rates may go down and longer-term rates would increase. In our example, the 5-year bond may get stronger, with yield lowering to 2.85%, while long-term bonds may soften, and rates may increase, to 3.10%. The new spread would be anticipated as 125 basis points.” When curve inversion is present, it tells investors that a decrease in longer term interest rates is expected, which is typically associated with recessions. May’s ISM manufacturing index, an important leading indicator, has been in contraction territory since its high of 64.7 in March of 2021 to its most recent low of 46.9 in May 2023. ISM readings under 50 are indicative of economic contraction. Important indicators to watch for the Equities cycle are construction employment, houses under construction, and of course unemployment rate, which is historically low but beginning to climb (3.7%).
New home sales came in red hot this morning, correctly confirming the recent melt up in construction and homebuilder stocks. April Case-Shiller home price index today printed a -1.7% which beat projections of -2.4% but was still a continued contraction from the previous reading of -1.1%. New home sales were reported to have risen 20% in May from a year earlier on a seasonally adjusted basis. But unadjusted home sales on a YTD basis (307k) are still running 5% below the year ago period (323k)- Nick Timiraos. Consumer confidence also beat projections of 104 with an actual print of 109.7 this morning. This is not surprising given the soft landing narrative that is widely in effect.
The artificial intelligence mania currently leads the Equities market higher. This is, in my view, the most important thing to watch pertaining to equities at the moment. AI is being priced for perfection currently and is creating FOMO buying to the extreme, at a moment when equities are overextended to the upside. Big name shorts are beginning to capitulate and as of 6/21/2023 mean reversion to the downside on the Nasdaq is starting to occur, the degree of which remains to be seen. Watch A.I. stocks to either lead equities markets higher, or lead them to the downside. Also watch market breadth to either increase (which gives the rally more credibility), or to remain low in which case a much more cautiously bullish or bearish stance is likely worth taking.
Crypto has been hot lately, as Blackrock and now Fidelity file for spot bitcoin ETFs. While they are far from the first to attempt to apply for a spot ETF, their capitalizations indicate a much higher chance for granted approval. After FTX’s debacle and now Binance being sued by the SEC and facing global backlash, it appears the existing whales are being smoked out of the market to make way for institutionalized management of crypto. Ironic that now the fiat kings progress towards conquering DEFI.
Also, UK inflation surprised to the upside at 8.7% CPI. This is hot on the heels of the BOJ meeting minutes. Some notable points there include “SOME MEMBERS BELIEVE THAT WHILE FIRMS’ PRICING POLICIES WERE SHIFTING, JAPAN’S CPI INFLATION WAS UNLIKELY TO REMAIN HIGH”, “BOJ’S ADACHI: INFLATION HAS ACCELERATED FASTER THAN I ANTICIPATED.”, “BOJ MEETING MINUTES: MEMBERS BELIEVE THAT MONETARY EASING SHOULD BE MAINTAINED.” Japan is clearly calling their inflation transitory and continuing to engage in QE. Reckless. These two examples are important to indicate that the global battle on inflation is far from won, and that more pain is to come to bring the reckless increases in global money supply alongside heavy QE seen around the globe, the largest of which has occurred in the USA.
Lastly and importantly: Last night there was a FED paper released that I find extremely important to touch on. The paper, titled “End of an era: The coming Long-Run slowdown in Corporate Profit Growth and Stock Returns”, showed an abstract as follows:
I show that the decline in interest rates and corporate tax rates over the past three decades accounts for the majority of the period’s exceptional stock market performance. Lower interest expenses and corporate tax rates mechanically explain over 40 percent of the real growth in corporate profits from 1989 to 2019. In addition, the decline in risk-free rates alone accounts for all of the expansion in price-to-earnings multiples. I argue, however, that the boost to profits and valuations from ever-declining interest and corporate tax rates is unlikely to continue, indicating significantly lower profit growth and stock returns in the future.
One other FED paper published last night with two main findings on distressed firms.
Firm investment and employment respond strongly to contractionary monetary policy when firms are in distress.
The distressed-firm share is historically elevated at around 37%.
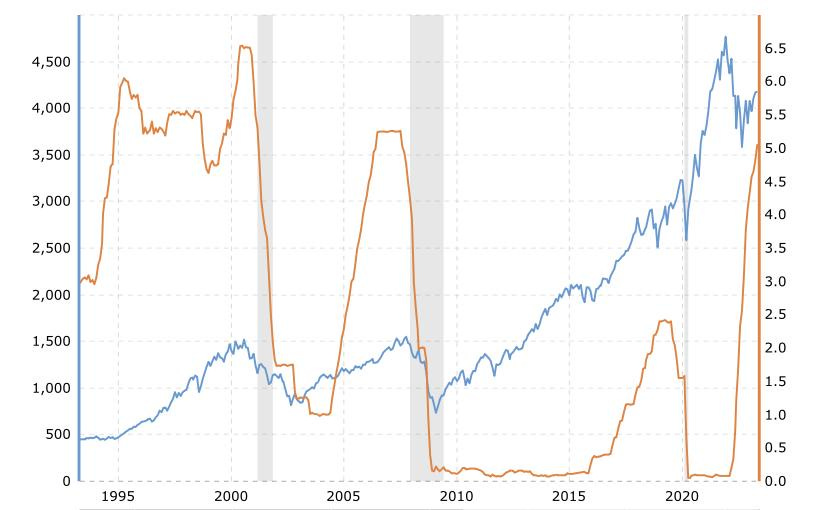
Monetary tightening of policy is still in effect and let us not forget the most important chart of all. Fed funds rate vs SPX: