
5/28 Memorial Day MHR Report - Weekly Macro, AI Overlords, The Tin Market, Housing, a German Recession, and More
The MHR contributor team hopes that you have all had a fantastic Memorial Day Weekend thus far. We honor all of those that have made the ultimate sacrifice and let's not forget why we have Monday off.

Article Contributors:
@DonMiami3 (Don - Partner, Chief Economist)
@Macro_Dose (Dose - Macro Contributor)
@Ssun5555 (Sun - Partner, Real Estate Expert)
@GhostFroman (Froman - Resident Tin Expert)
Where are things actually headed?
@DonMiami3
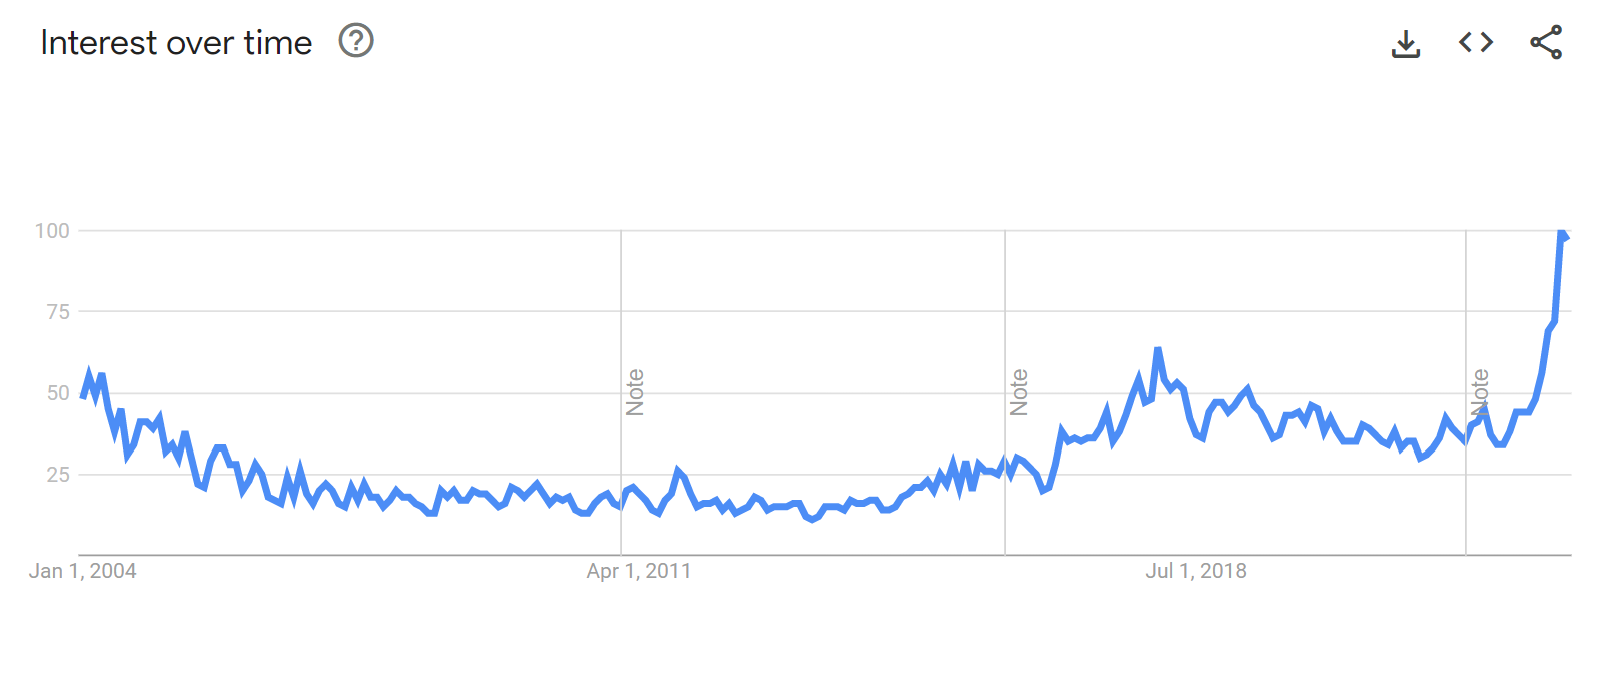
Another week of insanity in the markets - especially with Nvidia smashing earnings estimates and guiding revenue higher at a neck-breaking pace. The buzzword AI seems to be the magic key for absolutely huge prints in tech and growth names - and we’re now seeing that trend spread to other sectors like banking with players like JP Morgan catching the AI bandwagon as well with automated financial advisors and Bloomberg introducing a large language model for their famous Bloomberg terminal. The whole AI thing is here to stay but exist in a co-pilot phase for now as it’s developed and built out - I certainly think there will be a corrective phase from this very Dotcom-like hype behind some simple technologies that are being repacked - we just haven’t seen that occur yet. Take a look at the Google Search interest for “Artificial Intelligence” going all the way back to 2004.
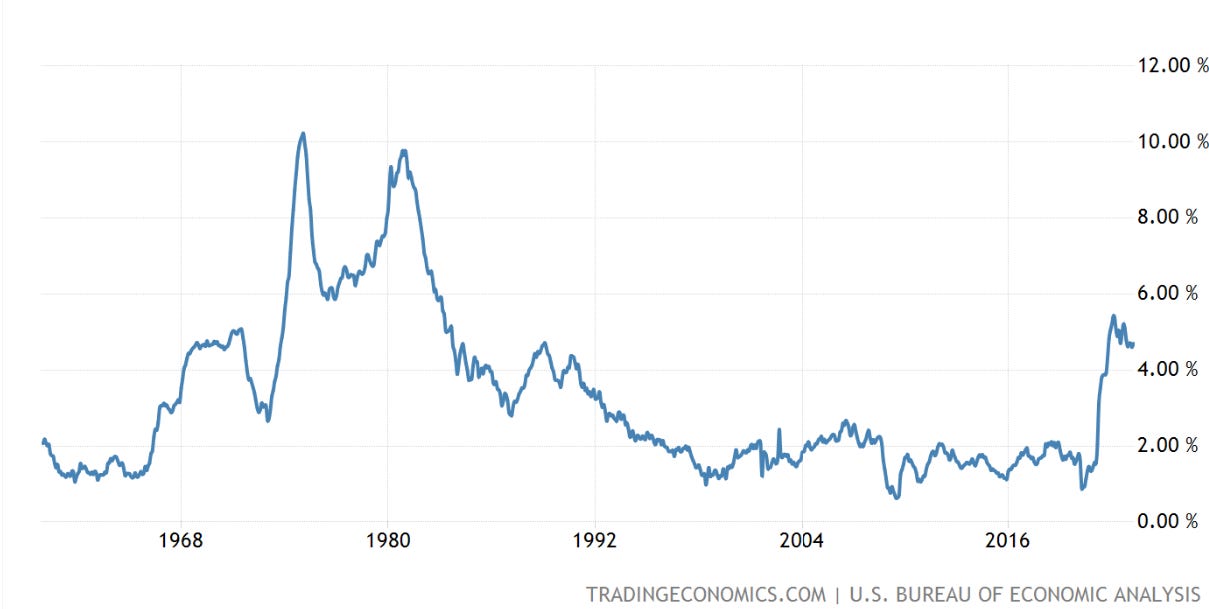
Turning to the weekly macro update - take a look at the Core PCE print - running hotter than expected and again showing a slight month/month increase. Previous was 4.6% for the core basket in March, and rose to 4.7% in April highlighting a somewhat embedded nature of current inflation that the Fed will need to bring down in order to achieve their 2% target (might become easier with the student loan payment pause being lifted).
This increase in PCE (the Federal Reserve’s preferred inflation-measuring metric) - has resulted in rate hike odds rising substantially over the past week. Odds of a rate hike at the next Fed meeting in June have increased to 61.2% - up all the way from 17% just a few weeks ago when it looked more likely that the Fed would pause. Given that the Fed is taking a more data-dependent approach to the June meeting - more data could mean a pause, although it’s unlikely in my opinion. There’s been a lot of beat-around-the-bush politico chatter from Fed Govs on the next move as well…
The composite PMI index rose to 54.5 - lifted by a white hot Service PMI reading - even though we saw a marginal decrease in goods orders in the Manufacturing PMI.
S&P Composite PMI
Service PMI is cranking - with a read of 55.1 from 53.6 - pretty in-line with movements in some of the risk/equity markets that we’ve seen - interestingly enough.
Manufacturing PMI saw some renewed contraction - at 48.5, from 50.2 - highlighting “weak demand and a reduced need to hold inputs following improved delivery times and lower new order inflows”.
We’ve seen an interesting divergence across the board on economic readings highlighting the service sector’s resilience in the face of rate hikes to a slowing manufacturing sector as consumers are ordering less but continuing to spend on things like travel/eating out/etc. Bank of America credit card data saw travel expenses decline and I refer to travel as a past expense - current experience - so we have all these anecdotal tweets and posts about everywhere being packed to the brim - but in most cases this was already money spent month(s) ago by the traveller(s).
Both the Richmond Fed’s readings backed this divergence between manufacturing and the service sector with an improved services index reading of -10, versus -23 previous and the manufacturing index reading of -15, versus -10 previously. The Kansas City Fed’s composite index and manufacturing index’s saw improvement - in contrast to Richmond - highlighting some relative strength in that Fed district.
Yields are holding at elevated levels and we saw the highest 30 year mortgage rate levels of the year (above 7%) - so a higher for longer regime might result in the 10 year yield pushing higher and elevating those mortgage rates even further. With a very slow mortgage market above 6.75% per Logan M., above 7% could slow things down even further even as new home activity has been keeping some of the market alive. All of the MBA Mortgage Indices were negative for the week so not providing a positive outlook for the mortgage sector.
Lastly - consumer sentiment worsened again (usually a leading indicator for future weakness) - so I continue to expect a recession in the months ahead - although there is considerable uncertainty around that timeline as the economy and consumer remain resilient.
Here’s the latest Conference Board LEI update highlighting a small bounce in April:
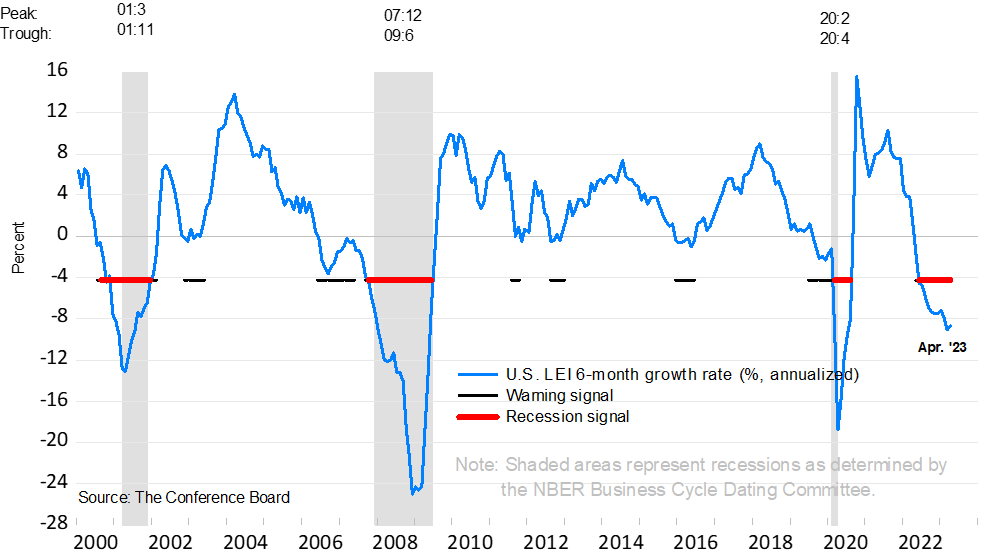
Right now - the LEI is pointing to a pretty mild recession based on historical data - although we need to see what yield curves/yields/and the economy at large do over the next few months and watch how the LEI changes to give us a better outlook.
Have a wonderful Sunday evening and Monday - enjoy it if you have the day off (or if you don’t - that’s okay too).
Let’s Welcome our AI Overlords + Tin Market Update
@GhostFroman
The original idea of this piece was a long-form rant about Commodity ‘Investoors’ and their tendency to act like Manic-Depressive Wine Moms at times. The ability to flip from, ‘Wen Super-cycle?’ Memes to Utter Despair in a single session is unparalleled, anywhere on the Bird App. Every time AI was spoken on the $NVDA call, we died a little more inside, every tick, as the stock hit escape velocity. Personally, I’m blown away by how quickly Crypto got dropped by the cool kids. Fortunately, is very easy to change your handle from .ETH to .AI, and *POOF*…just like that you are now into the new club. If there’s one bright side to all of this talk of AI and Robots taking over, it’s going to be in a Niche Metal that no one seems to care about; TIN(Sn). Tin is going to be essential, for any type of ‘AI revolution’, its main uses are in Solder, around 50%. The other 50% is an array of products, from chemicals that UV stabilize PVC pipes all the way to EUV Lithography process that $ASML uses for their newest semiconductors https://www.asml.com/en/products/euv-lithographysystems. This is interesting because the use cases for Tin are growing by the day, while the Supply is NOT. The Global Tin market is TINY in comparison to other base metals. In 2022, there was 385,000MT used by Industry, but only 310,000MT was mined. 2023, is setting up to be even worse off on the Supply side. Worse because of things that have already happened like the Indigenous Blockade of Minsurs San Rafael mine in Peru at the beginning of the year. San Rafael is ~12% of the WORLDS production. According to their Q1 report, production was down -54% in Q1’23 compared to Q1’22, down 3,187MT. That in and of itself, wouldn’t be the end of the world, but things can get wild in Q3/Q4 because of another curveball thrown, named Myanmar. Myanmar is a place most couldn’t find on a map, the Wa region specifically mined ~28,000MT of concentrate in 2022, all going to smelters in China. The military government has ordered that all Mining ceases in August. Myanmar has historically been surface mined, Artisanal Mining at Scale would be a good way of thinking of it. They’ve really torn the place up, China-style, and have depleted much of Surface Ore. What’s left underground can’t be accessed as cheaply/easily. The Junta might be running in the Red at the current Tin price of ~$25,000MT, keeping what’s left in the ground for future higher prices. It’s going to be very difficult to understand their true motivations, so we can only speculate at this point. As we can see though, these lost Tons are starting to Add Up in a World that’s going to see incremental demand growth, one way or another. The next wildcard is the 2nd Largest Producer of Tin Concentrate in the World, behind China: Indonesia. The main player there is SOE, PT Timah, which mostly does Alluvial Mining in the Ocean and tolling of Artisanal Mining of Locals. The Indonesia Government is planning on Export Bans, including Tin. Their reasoning is to getting Smelting Capacity built in the country, so they can keep more of the value added inhouse, instead of it going to China for Smelting. Bold Strategy, because the last time I checked you can’t just throw up Smelters, overnight. The other issue is the Tin Price over the last year, compared to the price of Diesel has made many alluvial operations break even or worse. The Indonesian government tends to flip-flop on these things, and the recent announcement was one without much of a plan attached. So we are going to have to wait and see, but at the current pricing, you won’t be getting a supply response. The only new Supply in 2023 is coming on from one Place: DRC The Democratic Republic of Congo (DRC) has something going for it: the Mpama North Mine near Bisie, North Kivu, owned by Alphamin Resources($AFM.V). It’s the highest grade Tin Mine in the World(4.5% Head Grade @ ~12,000Mt/yr) and they are currently building the Mpama South 2nd Mine, located directly next to the first one. Planned Commissioning in December should add around 8000Mt/yr going forward at a lower grade of ~3%. This isn’t going to put a dent in the supply situation if Myanmar is shut, and Indonesia doesn’t flip-flop. Could be a spicy 2024, before any of the AI dreams of our future AI Robot Overlords come to fruition. So to wrap this whole thing up, we find ourselves in an odd time around the world. There are almost new ideas, daily on new ‘stuff’ to make and build, but the ‘stuff to make stuff’ is taken for granted almost like children. Dreaming up an AI-controlled, Electric Flying Car with Solar Panels on the Wings is a lot sexier than a new Hole in the Ground in the Middle of Nowhere. Can’t have one without the other though, unfortunately. I have focused more on the supply situation in the near/medium term. Long-Term, at a high enough Tin Price, for long enough you will see some of the marginal, low-grade (under 1%) projects that have been shelved for years start to come back into the story. Trying to build out a Low-Grade, Greenfield Project at the current prices, isn’t happening. The Global Tin Market was estimated to have a 4.5% CAGR from 22’-2030, from 338,500Mt/yr to 481,900Mt/ yr by 2030. Where is all that Tin going to come from? Your guess is as good as Mine…maybe our future AI Overlords have the answer. (Full Disclosure: Long Alphamin $AFM.V and very Bullish Tin).
*Froman’s recommendation is not a recommendation of Mile High Research and or it’s other staff and contributors. Froman may have a position in the mentioned company.
The Spring Selling Bust!
@Ssun5555
The U.S. housing market is in the midst of its “busiest” time…, the spring selling season. From the overall look of the market, we did have a small bump in sales and prices edged higher over the last few months in many markets. This looks to be fading at an accelerated rate, especially with the 30 yr. mortgage rate sitting at 7.14% today. Some of the hotter markets such as Chicago, Boston and the NE area in general are seeing many of the covid hot spot buyers moving back. Anecdotally, I have been seeing many deals fall through, either because of financing, or buyers getting cold feet in the covid hot spots like SWFL. In my opinion, the bump is over, and we are set for the next leg down. Demand remains muted in much of the country, except a few hot spots. If you look at mortgage applications, they are down 29% from this time last year and 40%+ from 2019. Even though demand remains low, inventory is also extremely low. This phenomenon is helping to buoy the housing market. One of two things needs to happen for the real estate market to break lower. The first would be for job losses, wage cuts, and reduced hours to start happening. There is some evidence that this is starting to take place when examining the JOLTS data. Job openings continued to decline for the last three months and vacancies dropped to 9.6 million. These are usually leading indicators that the unemployment level is about to break higher. Anecdotally, on a business level, we have seen very few contracts being signed this season. The last time I saw this kind of decline in contracts being signed was during the GFC! Also, speaking with many friends who own businesses around the country, they are also experiencing a severe slowdown. Some are saying they will start layoffs as early as next month, and some as far out as six to eight months depending on the business sector. I personally believe we will start seeing a major spike in unemployment between Q3-Q1 ’24. The construction sector is looking extremely weak as well. Permits are down 9.7% for five units and under, this is the lowest level since December 2020. Job openings for construction dropped to the second lowest level since 2021. That was a 17% YOY drop from March 2022. A reminder…housing usually leads us into a recession and also out of a recession. From the looks of it, we are just gearing up to enter a recession later this year. The second thing that could cause housing to decrease would be some sort of catalyst such as a significant drop in the stock market or a sustained credit crisis (i.e., multiple banks collapsing simultaneously). While no one can predict the future of the stock market, I tend to think we have more headwinds ahead of us. (I refer you to some of my other colleagues @DonMiami3, @SixFinance, or @MarkeyMonkPicks for more stock market news), I will stick to real estate for this article. However, I certainly would not write off more credit events happening as the FFR still sits above 5% and continues to erode many businesses and banks’ finances. Keep in mind that this is the fastest hiking cycle in history, and no one really knows what the ramifications will be. The FED is already hinting that they might go higher with rates and are fully intent on keeping rates elevated through the rest of this year and possibly into 2024. To sum everything up, I do not believe we need to see a huge move in inventory for further price declines. Housing is priced at the margin, so forced sellers from job losses or an incoming recession could take the housing market down another leg. A combination of these two factors could lead to a perfect storm. If fear enters the housing market, it could change the psychology quickly. Fear and FOMO are two powerful market movers (look no further than Bitcoin for evidence of this). Many variables are at play especially in the covid hot spots and zoom towns. Next article, we will dive into a few specific locations that got over heated during the pandemic with STR and over levered investors. Florida is going to be sunny-side over!
A German Recession…
@Macro_Dose
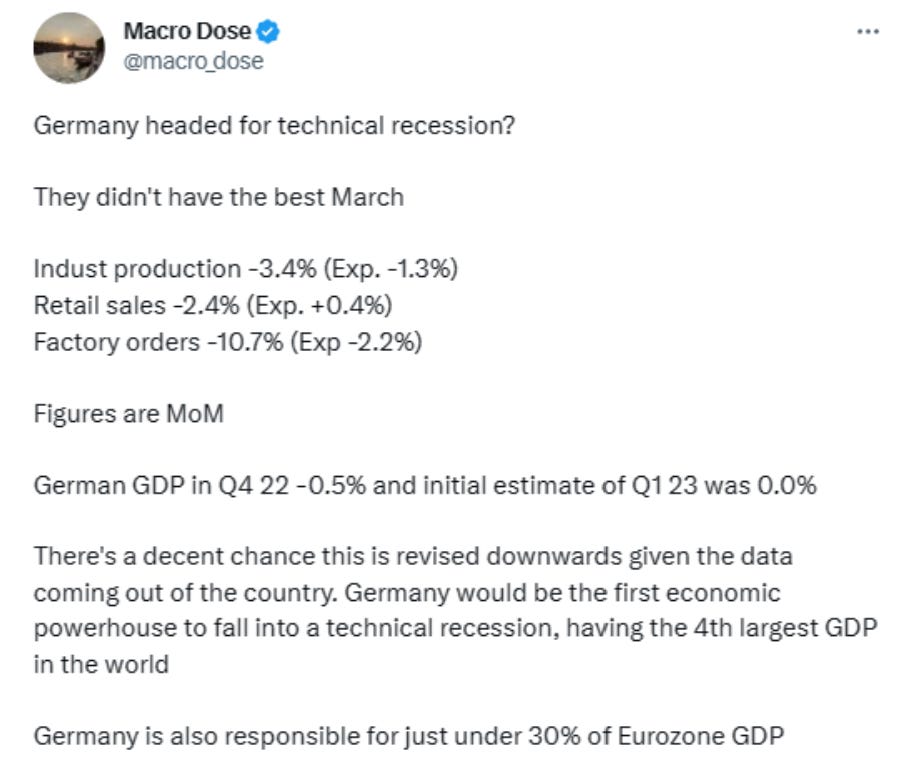
This week Germany entered a technical recession after reporting a 0.3% QoQ decline in GDP and a 0.5% decline in Q4 22. Despite Germany having the 4th largest economy on the planet, no one seemed to care. The DAX, not far from all time highs, fell 1.54% on the week but rebounded strongly into the close on Friday. The recession doesn’t come as much of a surprise as macro data coming out of the country in the past few months has been pretty dreadful:
The main driver of Germany’s let down was falling household consumption, despite an unemployment rate of only 5.6%. Household consumption expenditure fell 1.2% in Q1 of 2023 – with spending falling on food and drink, clothing, furniture, and cars. Imports of goods also fell. Real (inflation adjusted) retail sales for Germany were down 8.6% in March year-over-year. However, foreign exports remained strong as well as gross fixed capital formation in machinery (how much businesses are investing in means of production). Does it actually matter that Germany has entered a technical recession? Well, we know the country accounts for just under 1/3rd of Eurozone GDP.
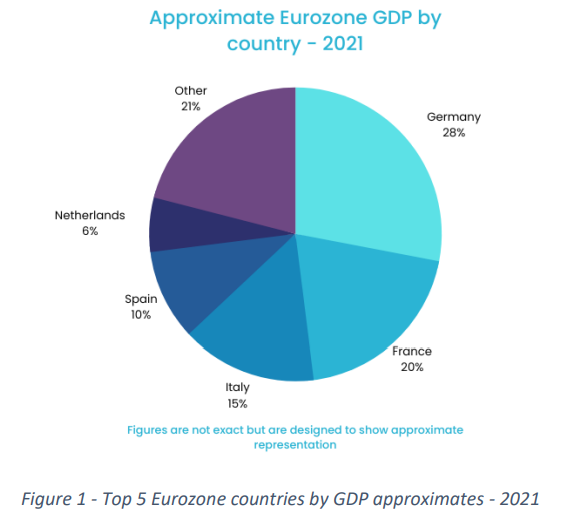
Figure 1 - Top 5 Eurozone countries by GDP approximates - 2021
Wherever the German economy goes, the Eurozone tends to also. This is not surprising as the country constitutes such a large fraction of the overall GDP. Of these top 5 Eurozone economies, Germany was not the only one to have a disappointing first quarter – Netherlands posted a substantial -0.7% contraction. However, the other top 5 showed solid growth - France +0.2%, Italy +0.5% and Spain +0.5%.
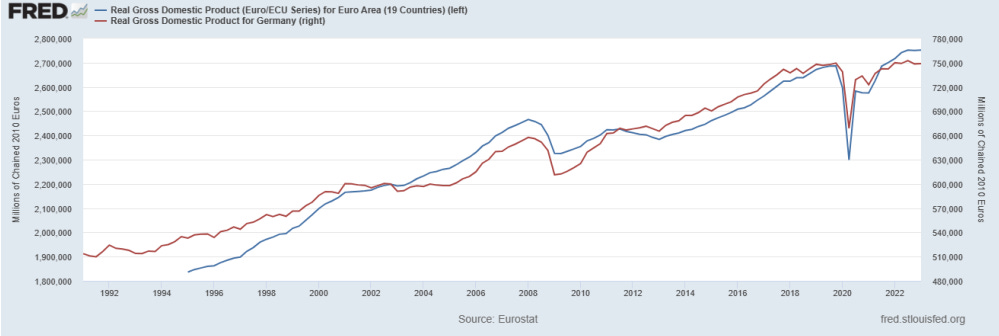
Figure 2 – Eurozone and German Real GDP overtime, displaying the close relationship between the two over time
Since the Eurozone’s inception, Germany has seen three technical recessions and the Eurozone has seen two. The Eurozone escaped a technical recession during the dotcom crash, experiencing only one -ve quarter of GDP growth. Meanwhile, the German economy experienced -ve GDP between Q1 2003 - Q2 2003. It is hardly a plethora of data to go by but I think general consensus can confidently say Eurozone GDP won’t be proceeding at a blistering pace in the near term future. Q1 23 only saw a 0.1% growth in GDP which was preceded by stagnation in Q4 22. The opinion of economists has been deteriorating since February, as seen in the ZEW Economic Sentiment Index. However, despite the doom and gloom, consumer sentiment in the country has been improving since October (albeit still pessimistic) while services are still going strong. Services PMIs have been completely diverging from manufacturing. The question now is whether manufacturing rebounds or whether services now start to pull back. Germany is expected to be the worst performing economy of all G7 countries in 2023.
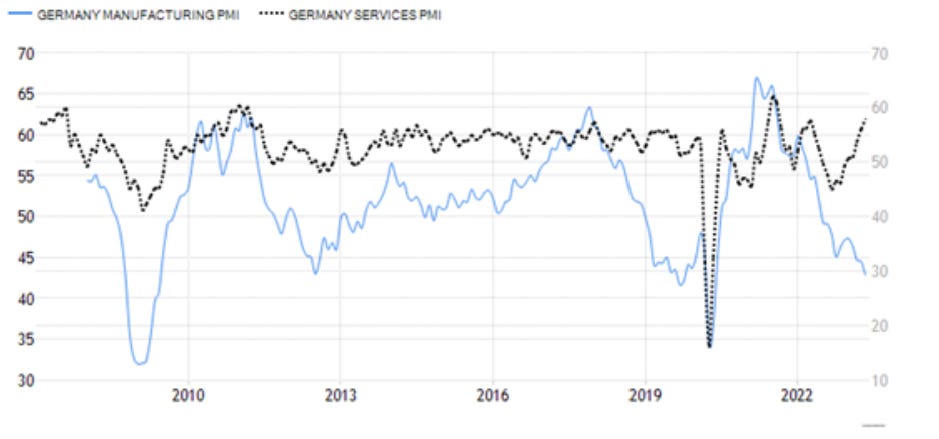
Figure 3 – German manufacturing PMI vs Services PMI. A complete disconnect has formed between the sectors.
To rub salt in the wounds the European Central Bank are fully expected to continue to raise interest rates, despite the largest constituent of the economic area already falling victim to recession. Inflation is still significantly higher than the ECB 2% inflation target. Eurozone headline inflation rose to 7% in April after making meaningful declines in the preceding months and core fell from 5.7% to 5.6% YoY, the first fall since June 22. The ECB have been known to make controversial rate hike decisions, raising rates into an intensifying Great Financial Crisis in July 2008 and in July 2011 during the Sovereign Debt Crisis in 2011-12. It’ll be interesting to see how high rates will go before the inevitable cutting cycle, unlike the Fed, the ECB have a single mandate – price stability.
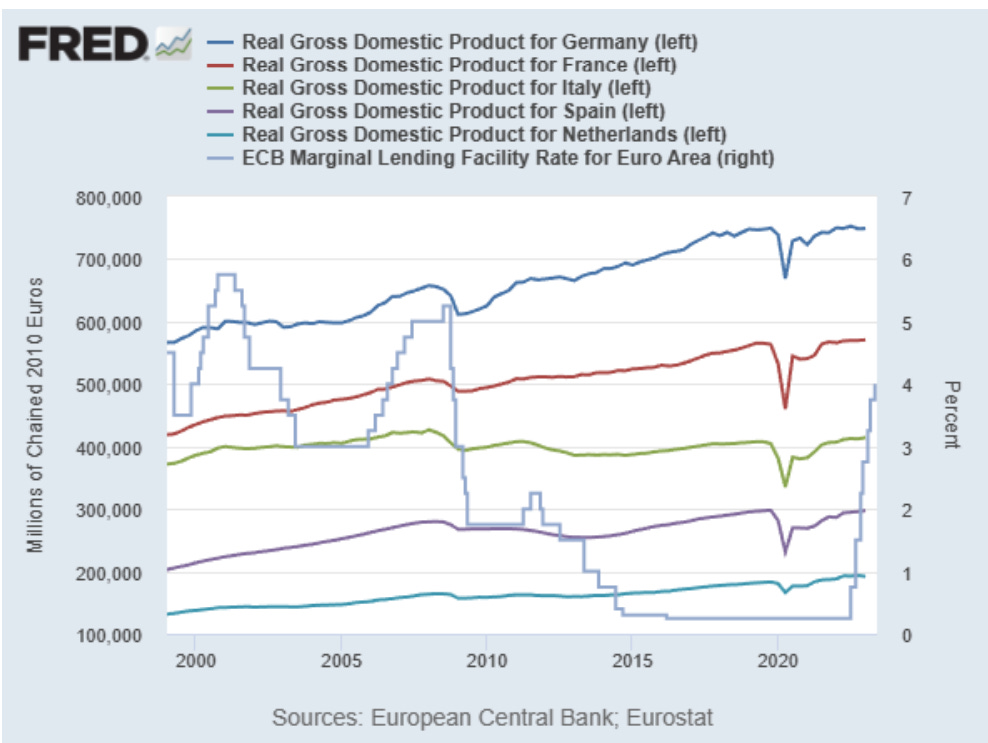
Figure 4 – Eurozone top economies GDP over time vs ECB Marginal Lending Facility Rate. Refinancing rate on Fed website does not include data over dotcom so was not able to be visually displayed
*Mile High Research macroeconomic articles and market updates made by contributors are opinion pieces - highlighting the opinion of the author. No decisions should be made based on the opinions of contributors - consult a financial professional when making important financial decisions. All data published above owned by respective listed owners.