
3/30 Weekly Macro Note: Team Combines Forces for an Evening Run in Kyoto Pt. 2, Return of the SPDR Senses, Home Sales Data, Vision Report, Sentiment Data, and Much More
In this hybrid Vision + Ozone + RESights Report - our team delivers the latest insights real estate stock trends, sentiment data, Japan trends, technical warnings, Vision and much more.

Intro (@DonMiami3 - Chief Economist, MacroEdge)
Evening Run in Kyoto Pt. 2 (@DonMiami3, MacroEdge Chief Economist)
Good Sunday evening MacroEdge Readers & Community,
This evening I will keep my note shorter as we have the entire team stepping up to the plate this evening delivering both a Vision Investment Research Note + RESights Report for the month of March. Lots of exciting things we continue to build out and work on, and it’s going to be a busy second quarter, this year seems to keep flying on by – even faster than last.
Evening Run in Kyoto Pt. 2
This evening futures gapped down again on Trump tariff comments and woes out of Japan - which saw the Nikkei off almost 4% and the KOSPI down almost 3% - we’re likely to see some of that move retrace overnight and there remains a gap above the Nasdaq – and on the CFD - those usually get filled relatively quickly. Short-term fear can result in short-term bounces in sentiment, even though a major breakdown of the 2-year bull trend has already occurred. In a follow-up to our last ‘Evening Run in Kyoto’ - we’re going to look at the macro data outlook, discuss technical frost, valuations, internals, ‘Sensei Symmetry’, employment data this week, and leave it up to the rest of the team for Trident. Powell speaks on Friday after a week of data and news, including the April 2nd tariff announcement from Trump - which Trump seemed to reaffirm this evening - with talks of increasing retaliatory tariffs up to 20% on every country worldwide. I am curious to hear Powell’s Friday comments and whether he plans to deliver a Friday afternoon put for equities. Let’s dive in and go for an evening run in Kyoto… I’ll have much more after Ulysses covers the critical housing data in his ‘Return of the SPDR Senses’…
Trident
Learn more about our private global macro fund in development - focused on capitalizing on substantial inflection points in both major asset classes and individual securities - by submitting a contact form through the link below. We’re delivering on a high-concentration investment philosophy focused on critical market inflection points and left-tail events. Much more available in a full post next week…
Available to accredited investors only. SEC 506(c) Reg D
Access MacroEdge Ozone for two weeks below:
Return of the SPDR Senses (@MrAwsumb, Head of Research - MacroEdge RESights)
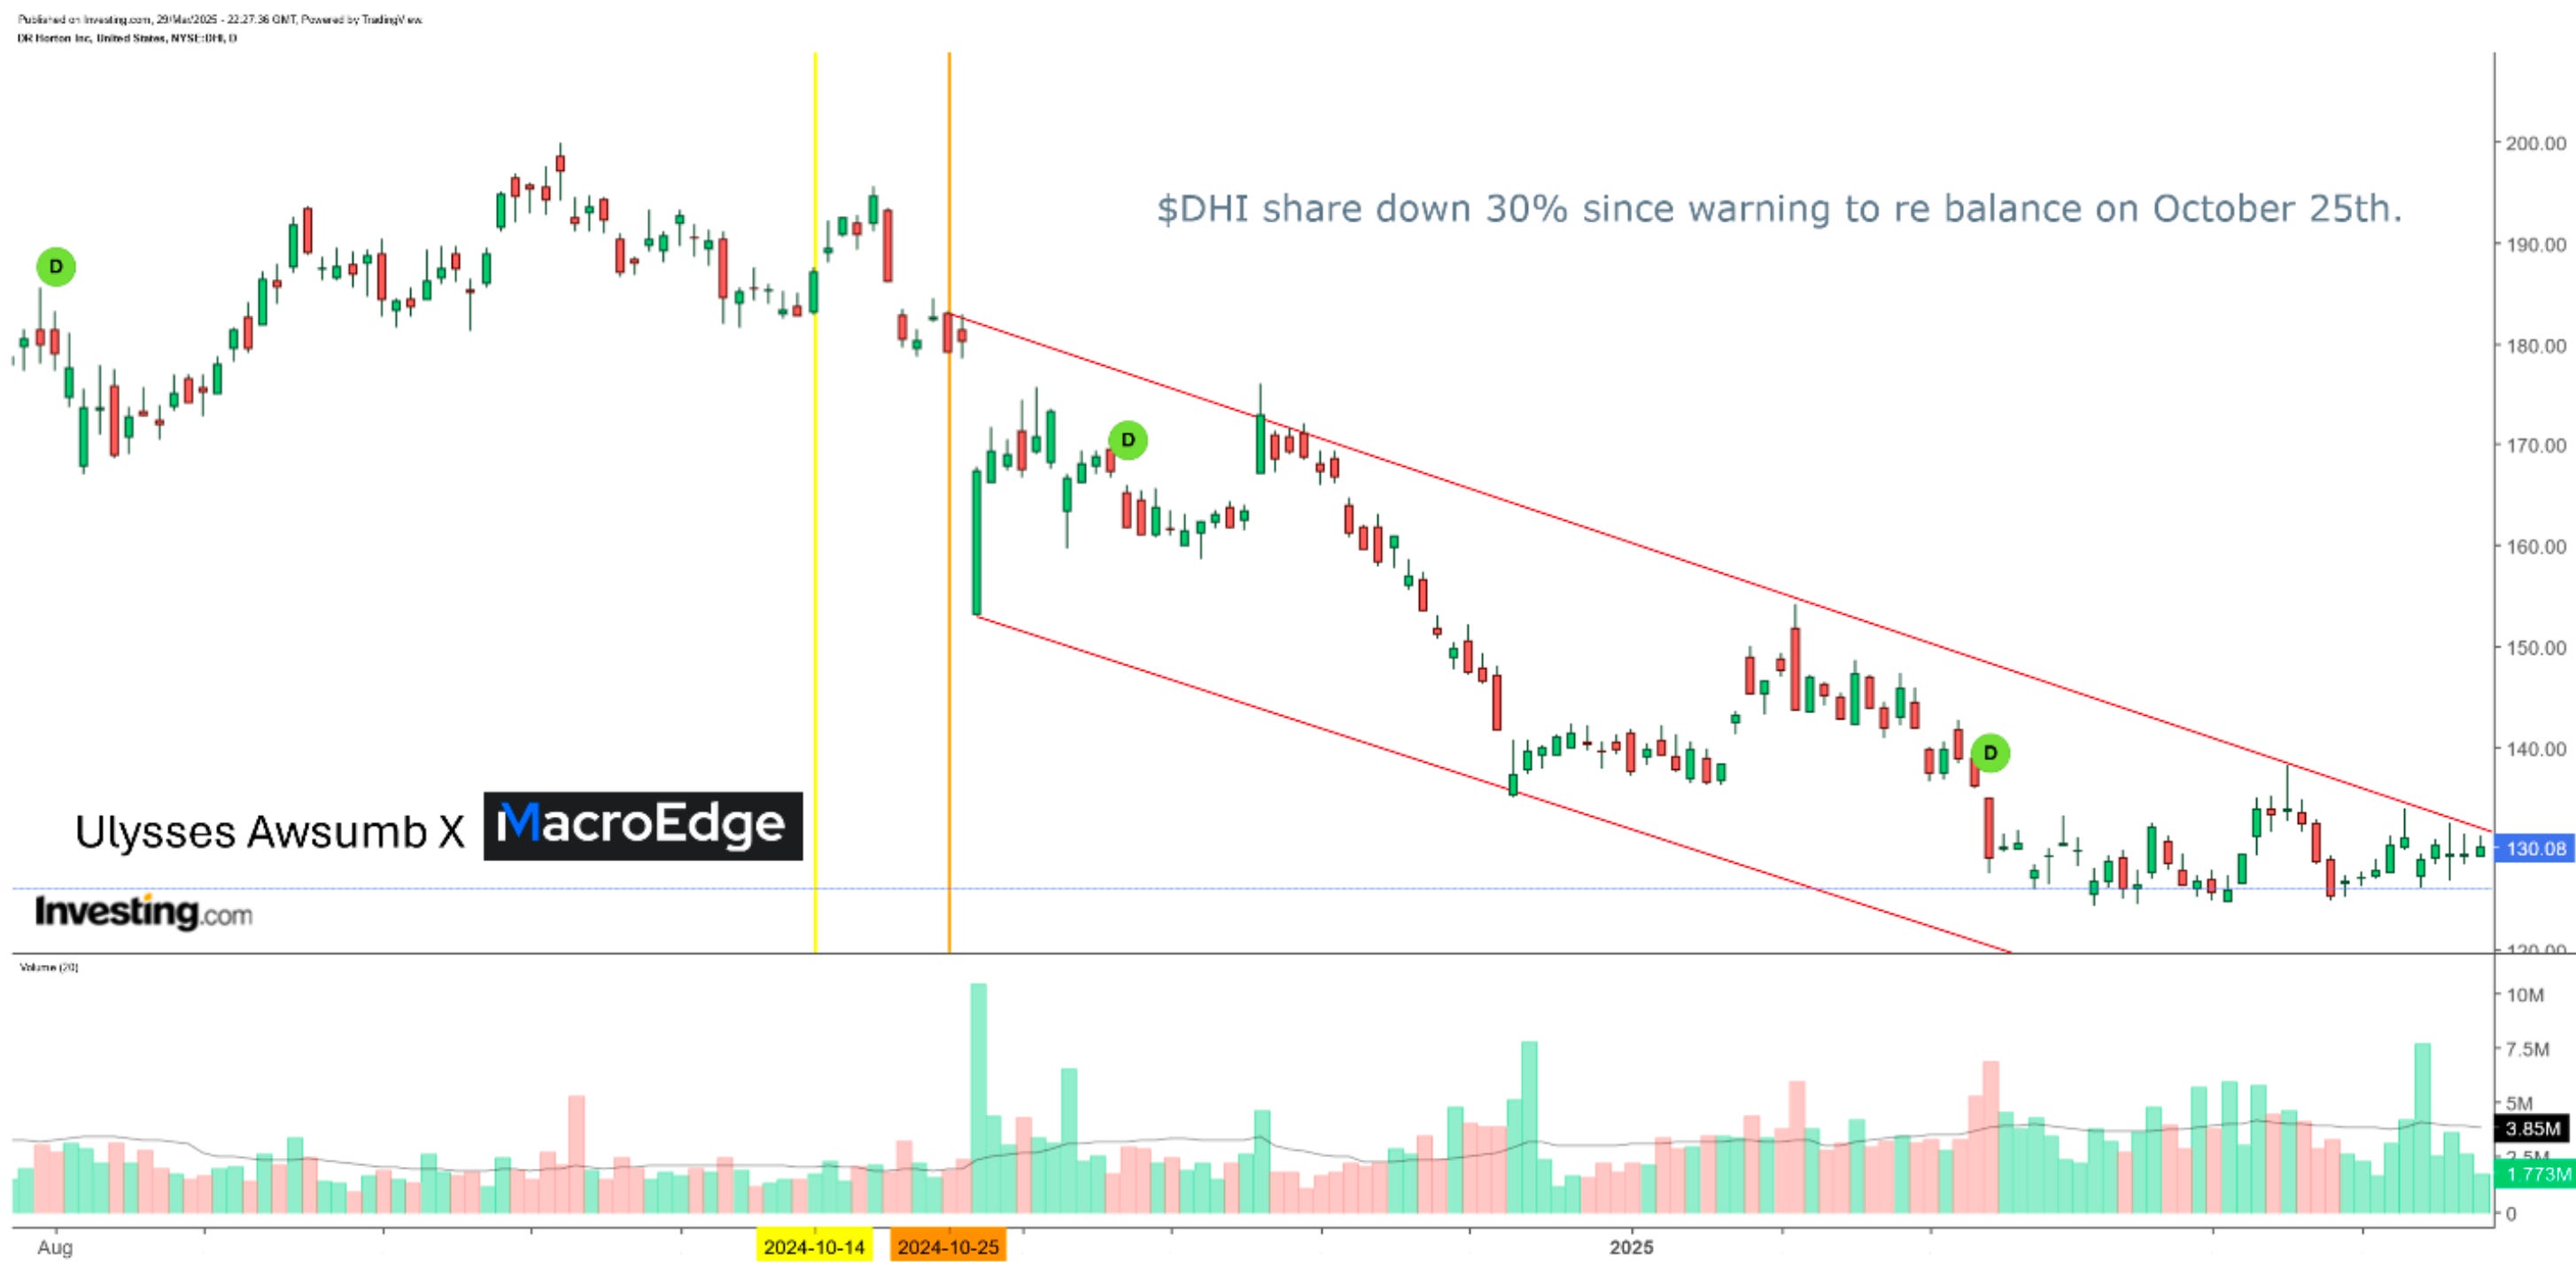
Our first RESights, October 25th 2024, (the orange vertical line below) I highlighted the continuing weakness in New Home Sales, combined with the rapid rise in mortgage rates. I also noted the components of XHB had been reshuffled to exclude builders from the top ten positions in its holdings and that it warranted rearranging portfolios. (the yellow line represents the date of research for publication)
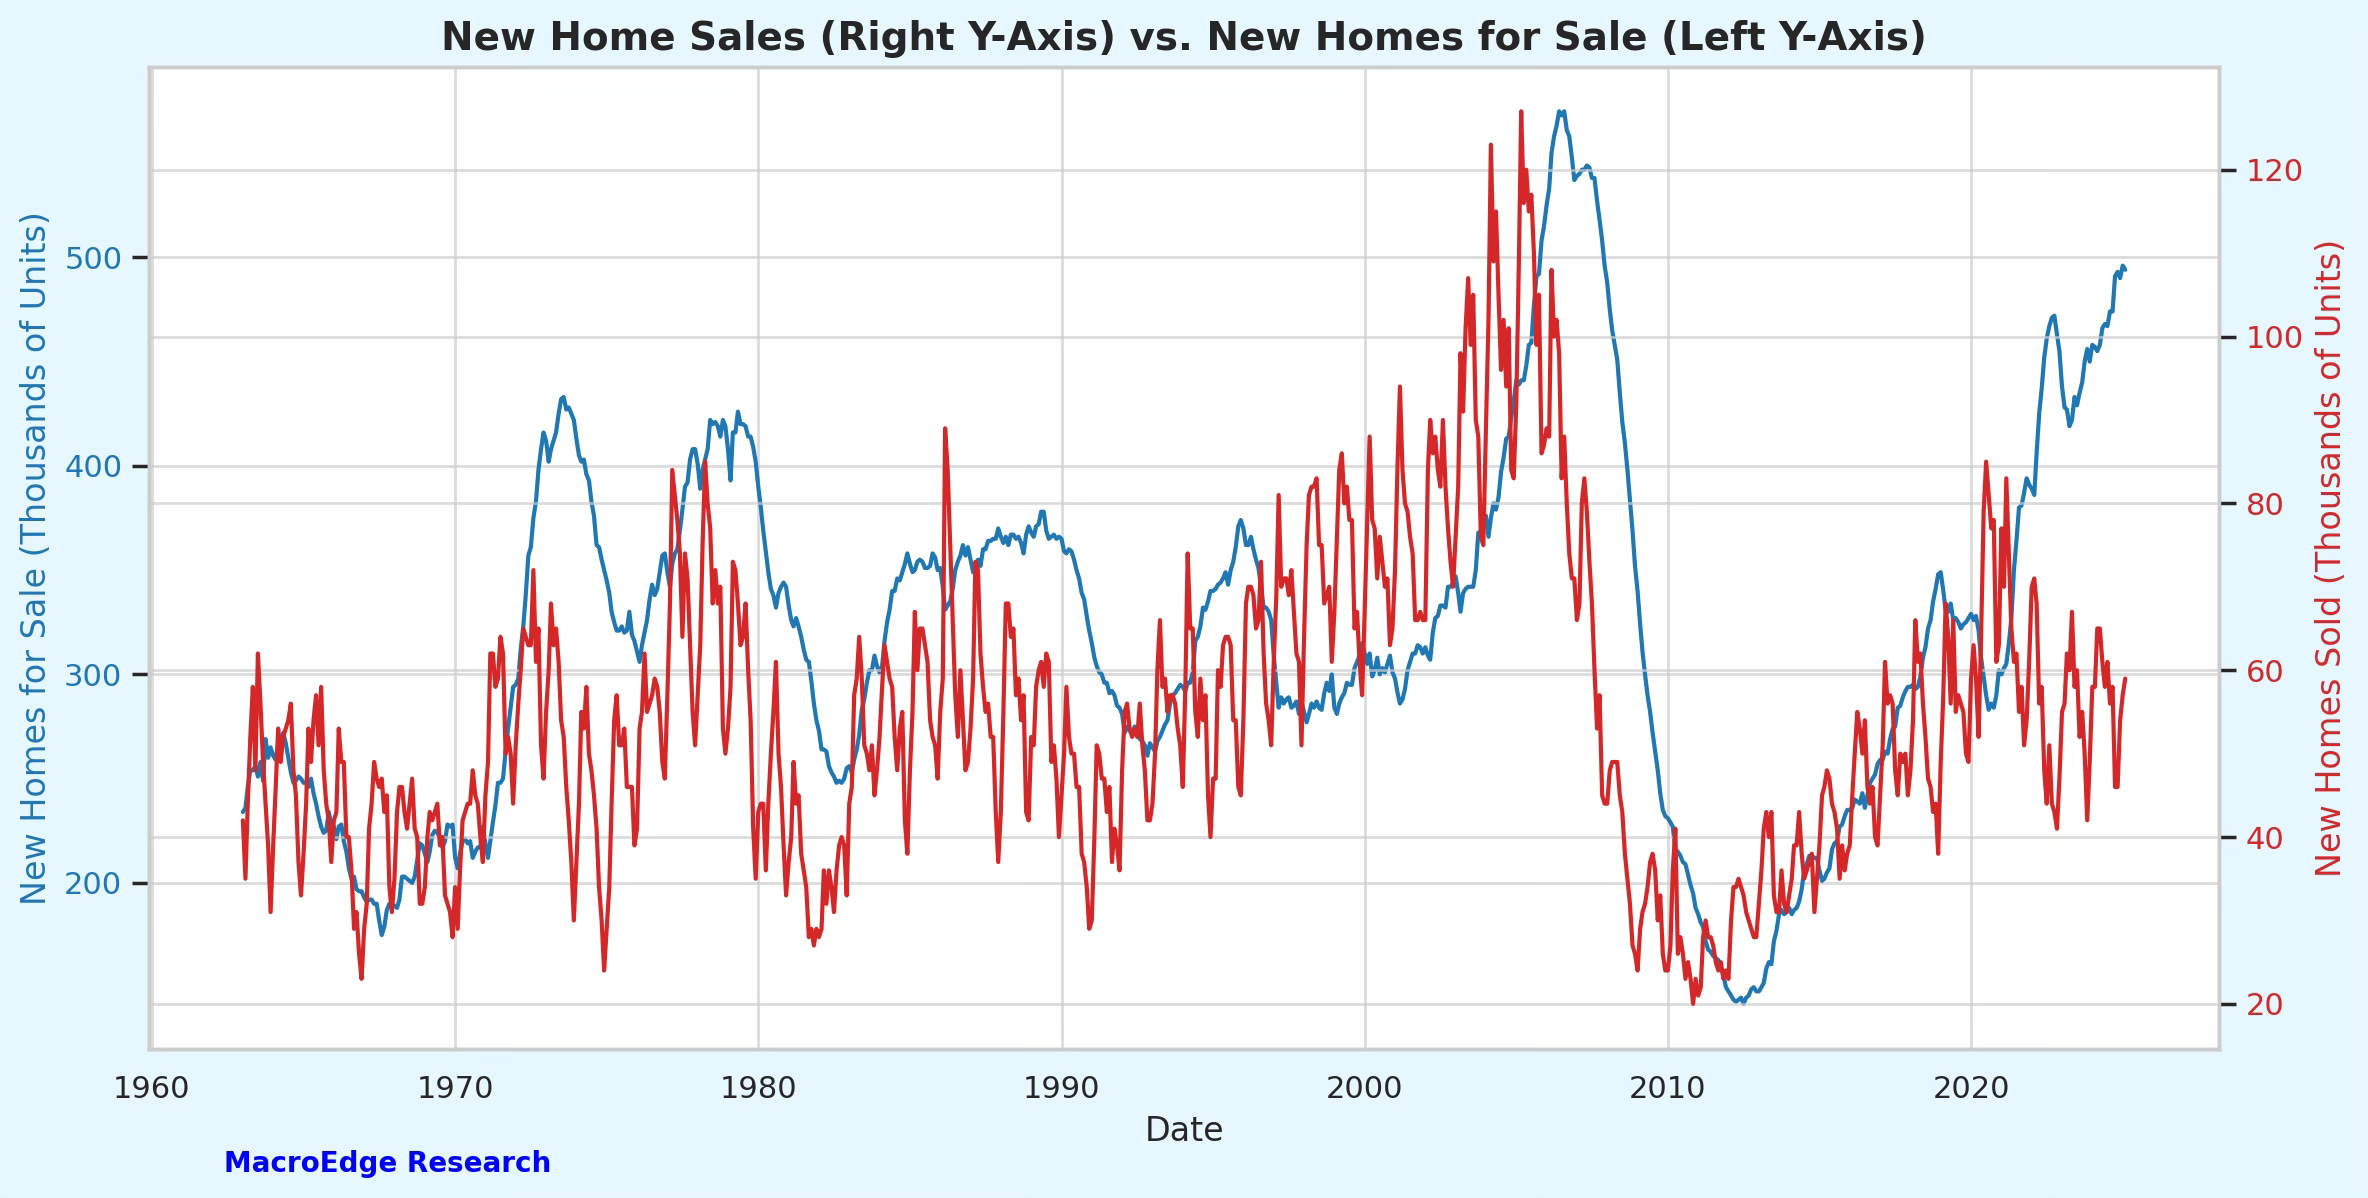
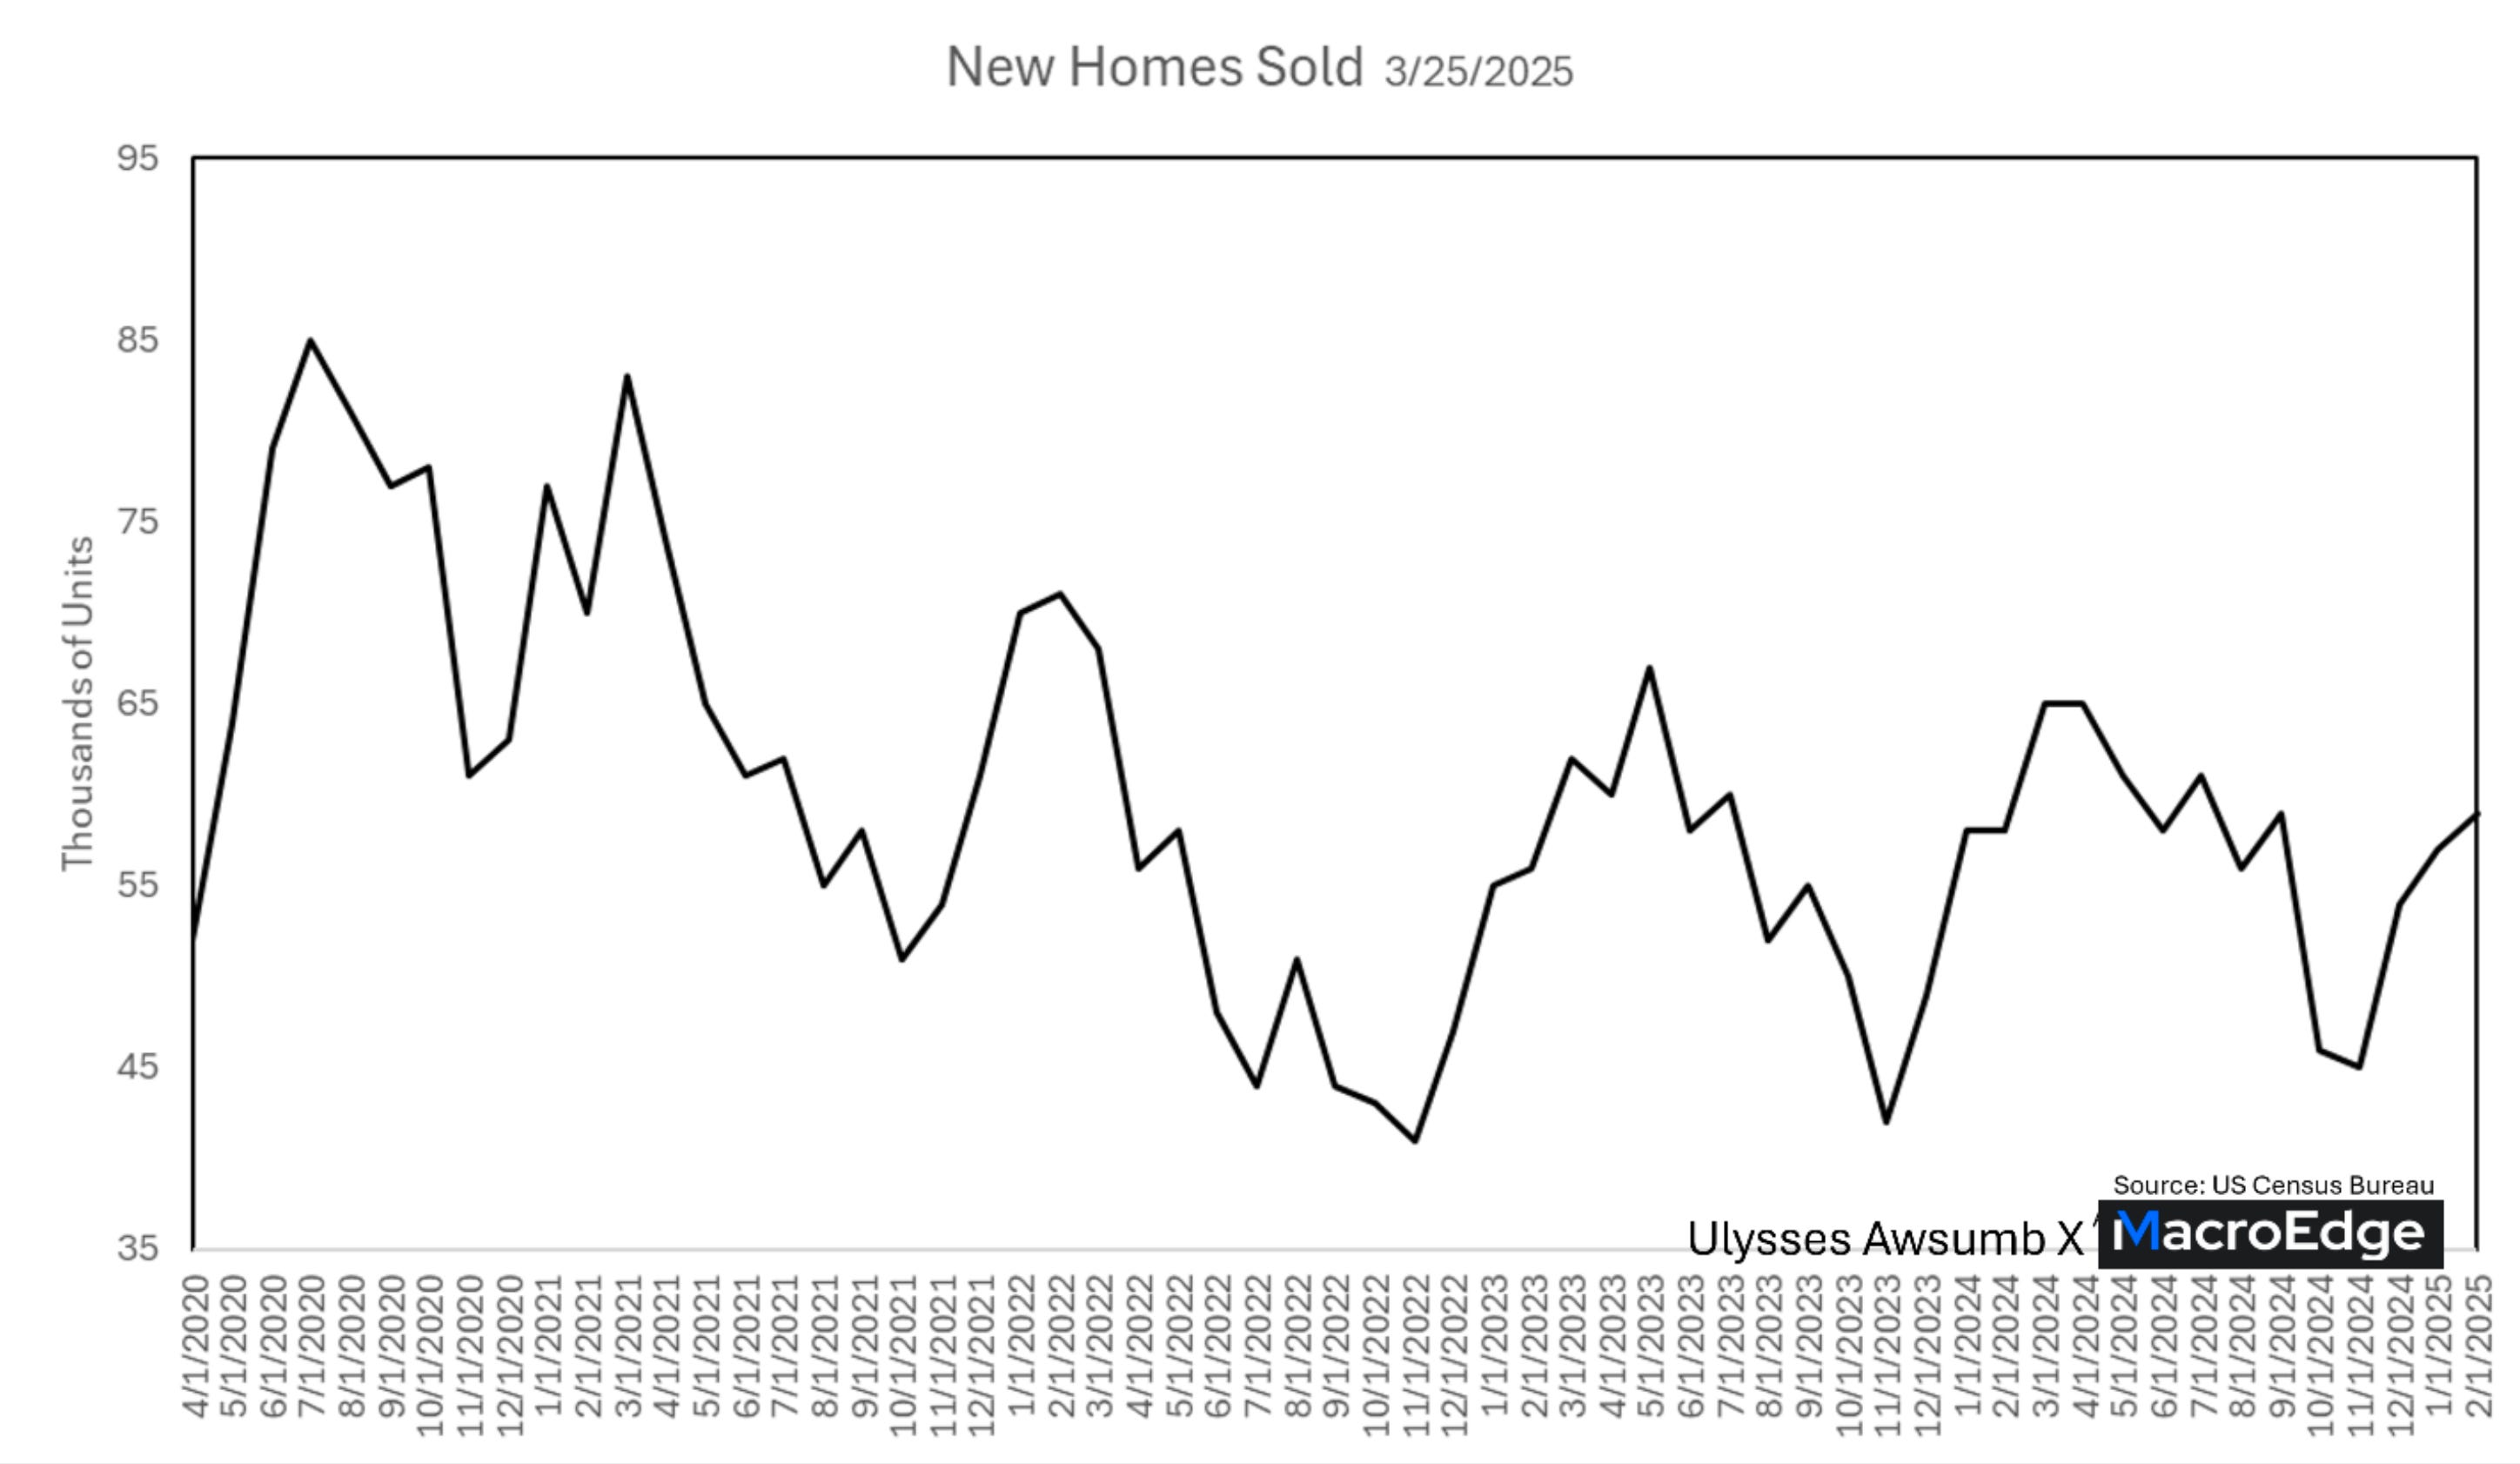
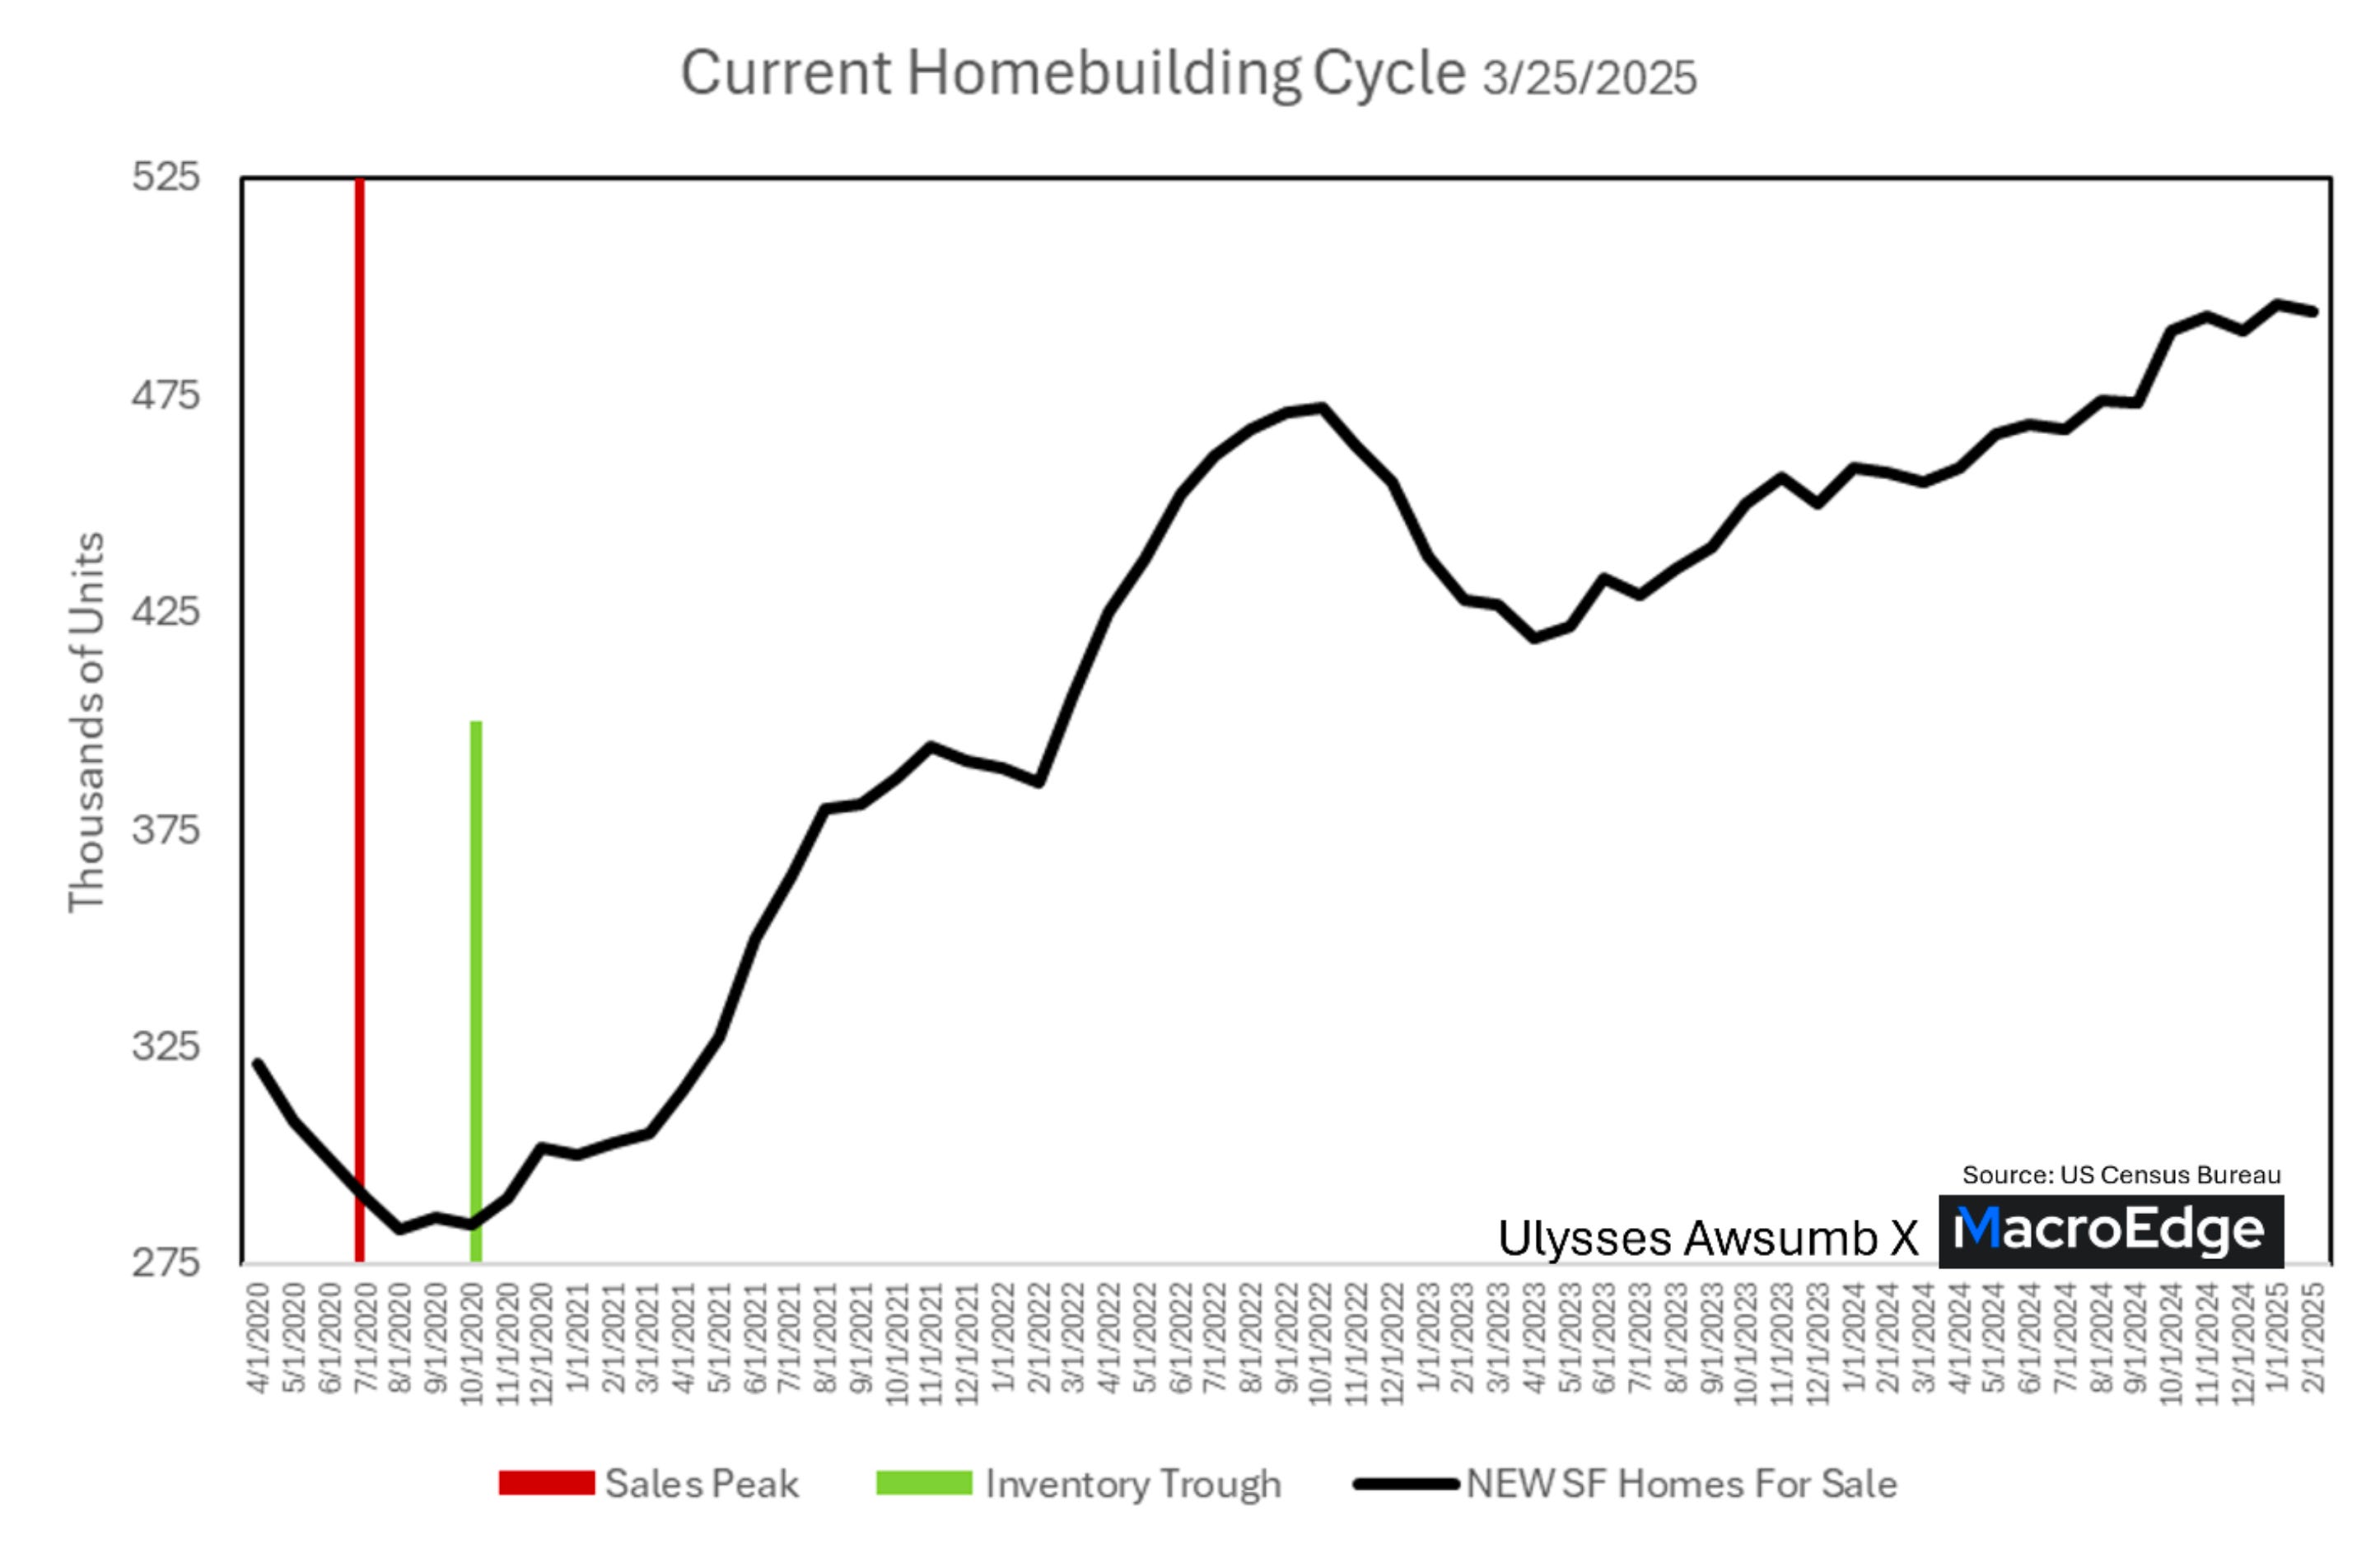
Those sales haven’t improved much since then. Barely above the 58 year monthly average (54.6k Sales). Meanwhile, inventory has remained stubbornly high. So much so that we’ve had 5 consecutive months of 490,000+ new homes for sale, and on a seasonally adjusted basis, we just crossed 500,000. Something that’s only happened once in US history. Preceding 2007. In fact we have more new homes for sale now than we did in December of 2007.
Just to clarify, here’s the current building cycle, and Sales since the cycle jumpstarted
If that trend-line wasn’t telling enough, here’s what inventory looks like:
Now that we’re wrapping Q1 of 2025, let’s take a look at what’s happened and where we’re likely headed given the confluence of issues facing the industry.
The last six months have seen the 20 largest publicly traded homebuilders average a per share loss of 34%.
Hovnanian being the biggest loser on a per-share percentage basis, at 55%. Just to clarify this isn’t a meme coin or internet craze. This is a Homebuilder founded in 1959, that has sold more than 300,000 homes since inception.
Remember, this is the building of homes business, so while it doesn’t get reported, I like to see what the values are on a per-home-sold basis. While I’ve been compiling calendar year sales totals, I’ve used the 2024 BuilderOnline homes closed figures for this dataset, so it’ll need a slight update in Q2. However, on a per-home sold/closed basis, the top 5 losers are:
1. American Homes For Rent -$695,710 share loss per closed home
2. Toll Brothers =$610,424 share loss per closed home
3. Green Brick Partners -$359,505 share loss per home closed
4. Ryan Homes (NVR) -$359,187 share loss per home closed
5. Pulte Homes -$312,506 share loss per home closed
To highlight the largesse of the biggest builders, on a total dollar loss basis, we can round out the top 5 with:
1. DR Horton $21.6 Billion share value loss (Largest builder by sales volume)
2. Lennar $15.6 Billion share value loss (2nd largest builder by sales volume)
3. Pulte Homes $8.9 Billion share value loss (3rd largest builder by sales volume)
4. Ryan Homes $7.4 Billion share value loss (4th largest builder by sales volume)
5. Toll Brothers $5.9 Billion share value loss (8th largest builder by sales volume)
That’s $59.5 Billion gone amongst 5 builders.
One thing each builder has done in abundance, is buyback stock shares. In fact, between the two largest builders, DR Horton and Lennar, they combined to buyback $3.2 Billion in shares during the fourth quarter and YTD of 2024.
Those shares have lost $1.1 Billion in value, while their quarterly earnings represent $1.3 billion combined.
Here’s what that looks like for Lennar:
And for DR Horton
Now, these two provide earnings per share of $4.04 $LEN and $2.61 $DHI.
The share prices as of today are:
1. $LEN trading at $113.93 making that $4.04 per share a 3.5% return
2. $DHI trading at $125.99 to deliver a whopping 2% return on the $2.61 per share earnings.
That’s an entire quarter of net income that just disappeared. And I’ll let you judge the share value for yourself on your own terms.
With that, as we head into Q2, the “true spring” market, we have Lennar and DR Horton both guiding sales prices and margins down.
Lennar just posted the lowest net and gross margins in 10 years (2015 wasn’t exactly booming in data terms, albeit homebuilding started truly recovering from “GFCi” also known as the ground fault circuit interrupter. Sorry, homebuilding joke.)
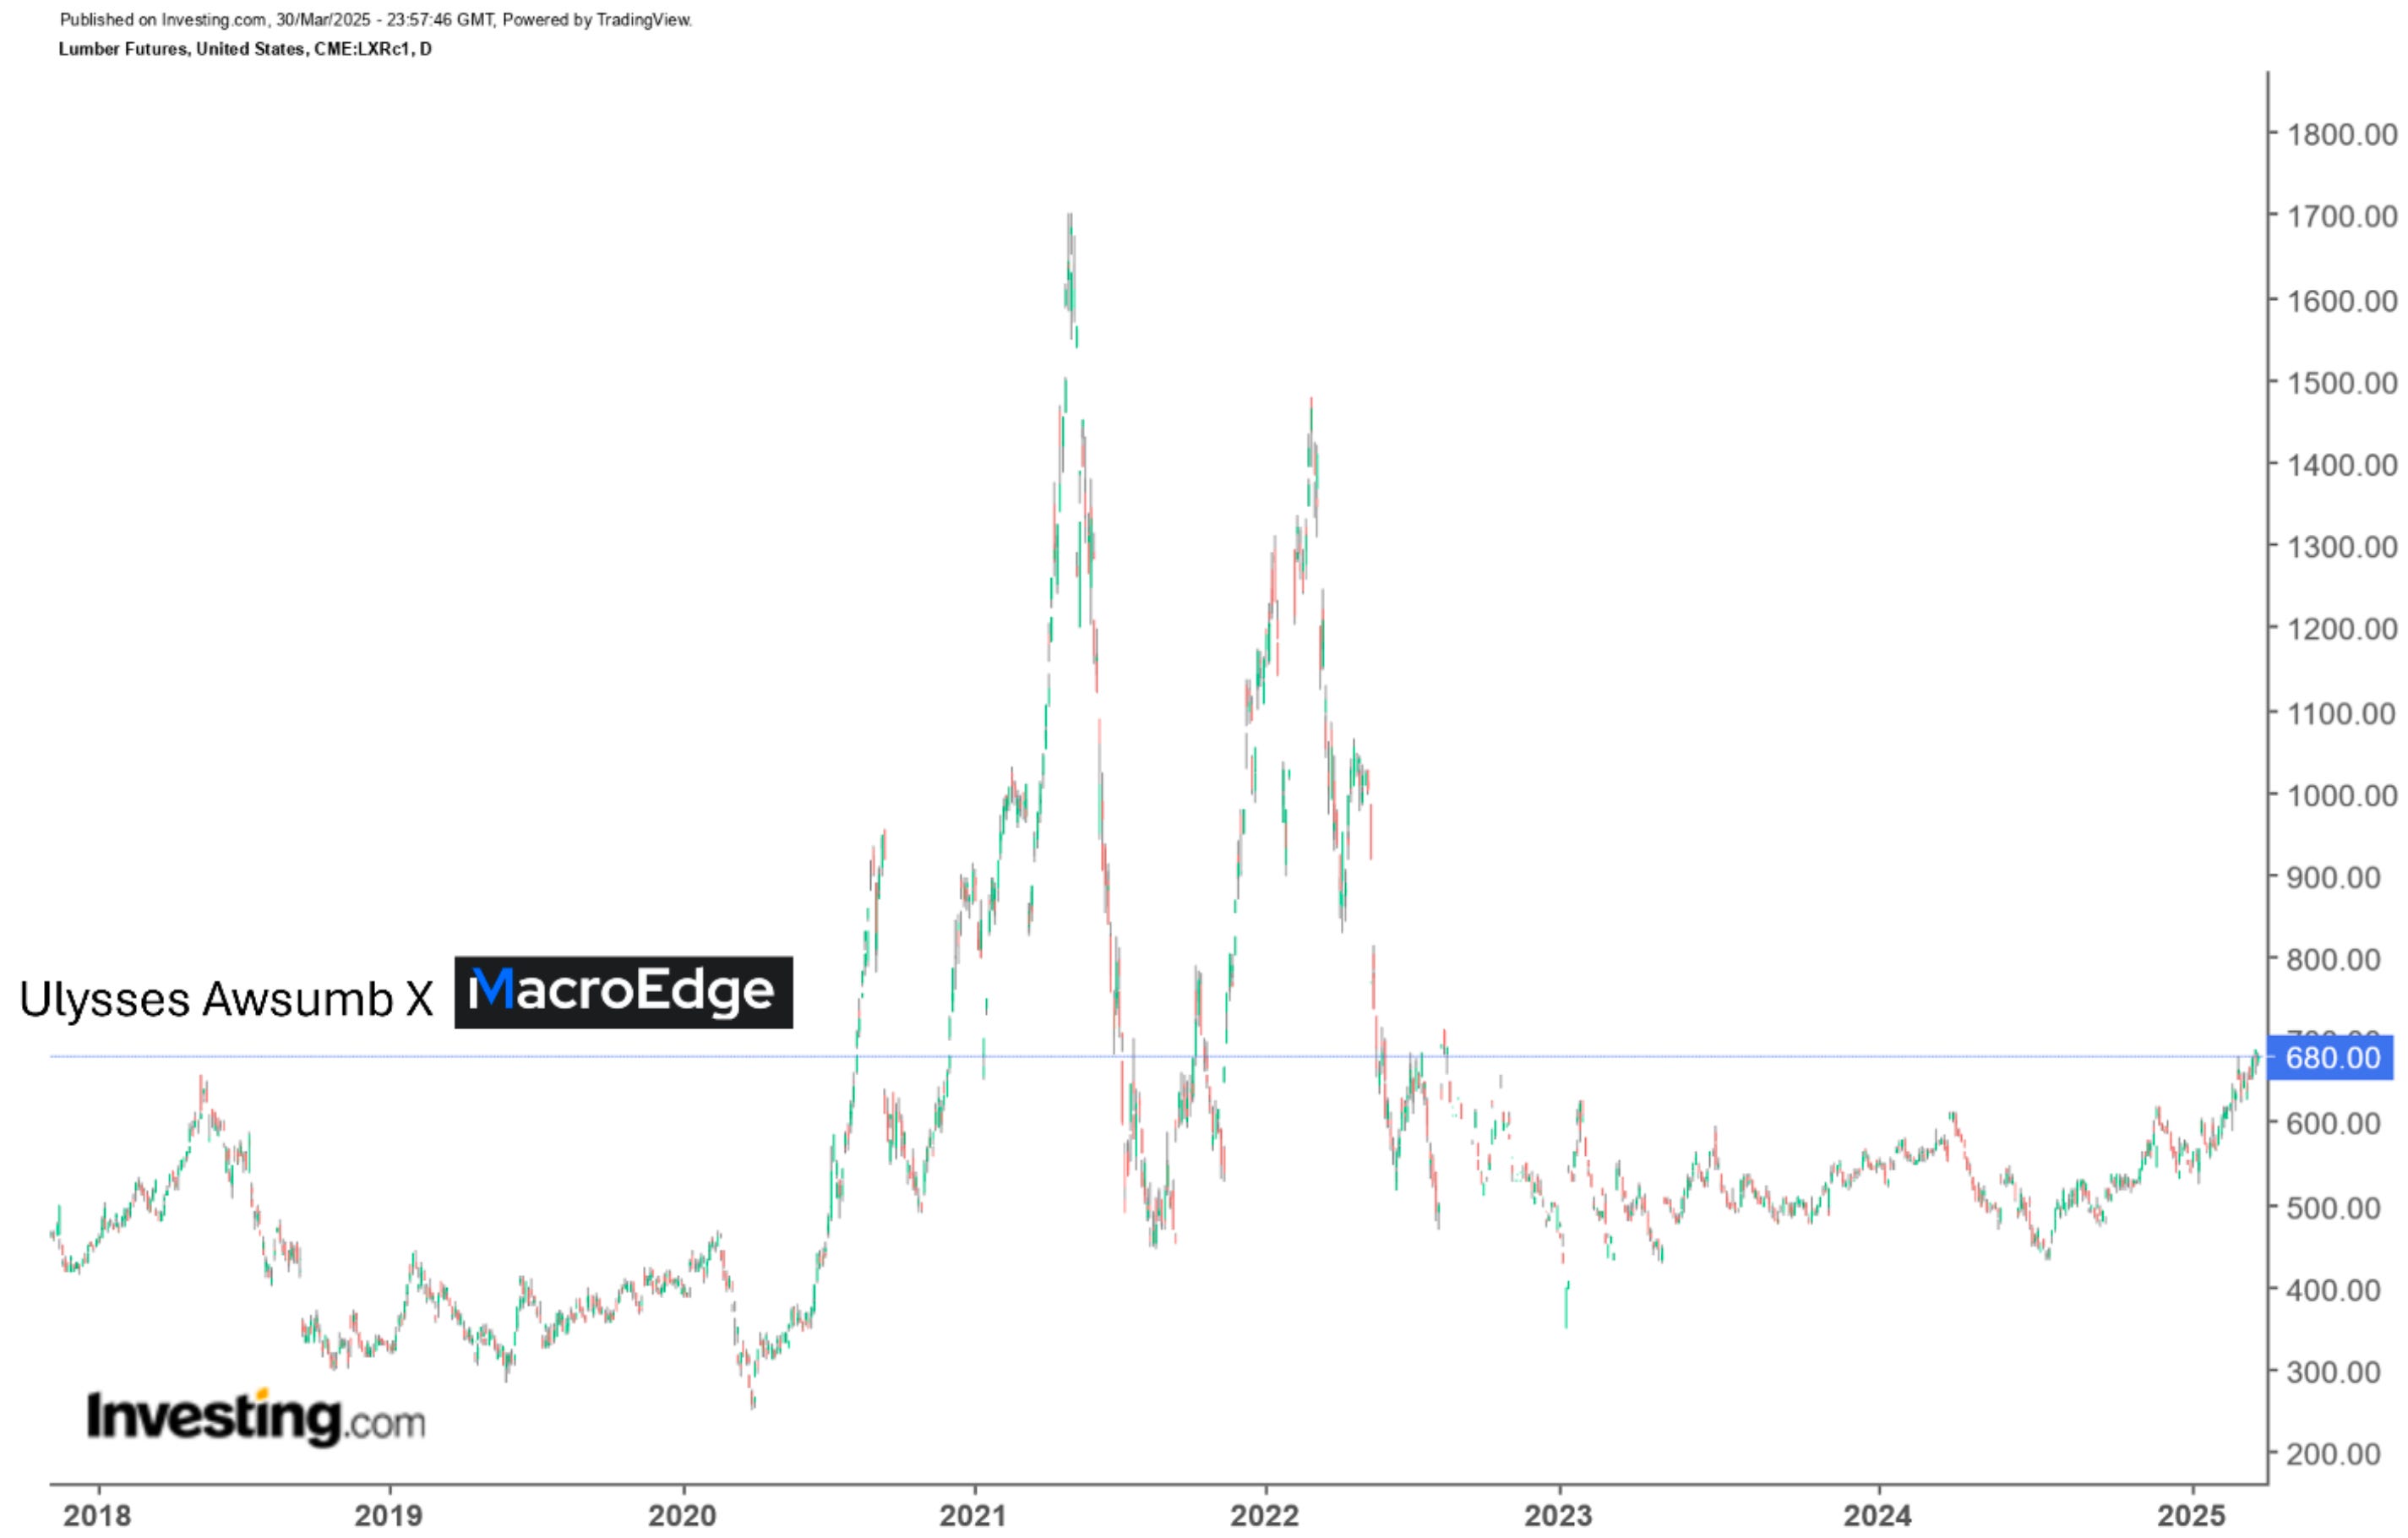
We have the average 30 year mortgage rate at 6.65% which was higher than March of 2007, tariffs on lumber about to hit (read building materials), builders spending north of 10% of sales price on incentives and acknowledging prices are coming down.
So you tell me, what fixes this situation in the near term? We’re at 86% of GFC inventory, 41% of mortgage refinance and 14% of purchase applications are being rejected according to the Federal Reserve Bank of New York (decade long highs) XHB did add one builder back to their top 10 holdings though.
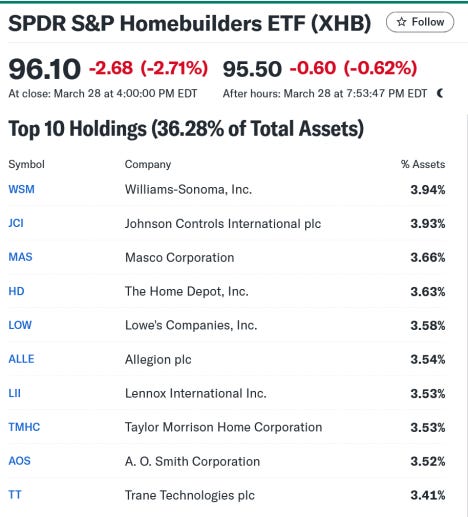
However those refinance rejection rates might suggest the other top ten holdings have some potential pain ahead too.
SPDR Selects portfolio rearrangement. Again.

Evening Run in Kyoto Pt. 2 (@DonMiami3, MacroEdge Chief Economist)
Macro Data Outlook
Monday:
> Housing Starts YoY and Construction Starts (Japan)
> Chicago PMI (USA)
> Unemployment Rate (Japan)
> Tankan Data (Japan)
Tuesday:
> S&P Global Mfg (USA)
> ISM Mfg (USA)
> JOLTS (USA) > Dallas Fed Index
Wednesday:
> Factory Orders (USA)
> Jibun Bank Data (Japan)
Thursday:
> Exports & Imports (USA)
> Claims (USA)
> ISM Services (USA)
> Household Earnings (Japan)
Friday:
> Payrolls and Employment (USA)
> Fed Chair Powell Speech (USA)
Technical Frost
In our Friday evening report - which I recommend you catch up on - you can view our technical analysis deep dive from the week. Tonight we’ll review our outlook below of the next potential Wave 2 move – which I think will continue to occur this week. We’re using a combination of historical data, calculated forward returns, internals, and technicals to map this technical breakdown that is underway.
Keep reading with a 7-day free trial
Subscribe to MacroEdge to keep reading this post and get 7 days of free access to the full post archives.