
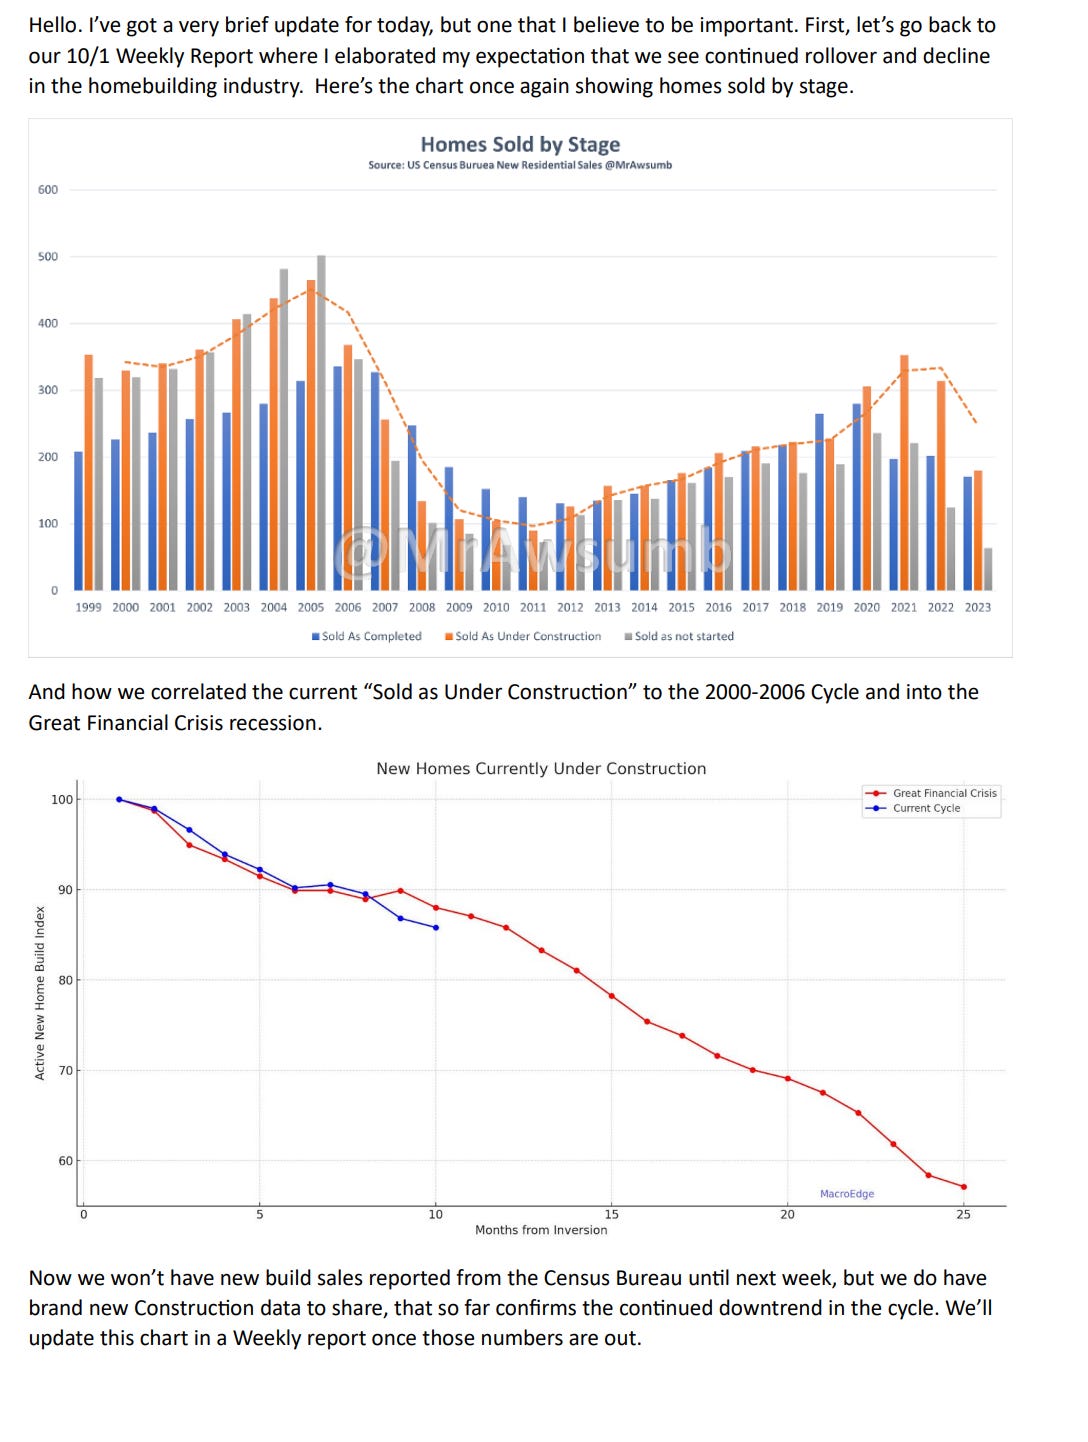
10/19 - Thursday Special Report "Employment Data, Spooky Yield Surge, Real Estate Update, and Uninversion Time?"
In this special Thursday report - Don, Six, and A tackle the latest employment, housing/RE, yield, Conference Board data, and more.

10/19 Thursday Evening Special Report
@DonMiami3, MacroEdge Chief Economist
@SixFinance, MacroEdge Head of Research
@MrAwsumb, MacroEdge Contributor
Employment Data, Real Estate Sales, and Spooky Bond Yields (@DonMiami, Chief Economist)
Hi all - wanted to get out a short Thursday evening report to you all to cover the employment data, the NAR data released today, the CB Leading Index, and cover yields that are continually rising sharply (especially on the long end of the curve). Hope you’re all having a great week as October continues to fly by. Appreciate Six and A joining in this evening to deliver a great report.
If you want to join our signup list for the ME institutional reports starting Nov 5th (as always at 9 pm ET) along with pre-access to the Insights Data Dashboard, feel free to complete the form at: https://www.macroedge.net/get-ascend. Appreciate all of you who have submitted a form so far, our team on the backend been getting in touch with you all.
First off, our MacroEdge Job Cuts Tracker stands at ~58,004 job cuts, is sharply up on a month/month basis. Looking first at the BLS initial claims (ICSA) of 197,000 it looks pretty “impressive” at first glance - being the lowest print in 9 months. Important to note with the BLS adjustment made from 2022 to 2023 it would’ve been slightly higher, but this headline initial claims figure is continuing to lag a spike in WARN notices filed this month (by about two months). If many of these workers don’t find work in that timeframe - usually operating in a 4 to 8 week severance window - they will be added to the ICSA count and subsequently the continuing claims figure which points to the real reality of the mixed jobs market right now. Even though the job market continues to cool - as the Fed wants - data under the surface continues to point us toward a downturn somewhere on the scales of 89/00 on the labor market front. The demographic and qualified candidate shortage continue to operate as headwinds against the slack really ‘snapping’ from the labor market (at least so far). The trend on openings will likely continue for the next 3-4 quarters as companies pull back expenditures and see less need to bring on new human capital next year in the face of growing uncertainty.
Continuing jobless claims paints a different story than initial claims for now - as it’s clearly becoming more difficult for some job seekers to find work. The trend continues to progress right around the average of all previous recessions. States like CA, NV, and TX are seeing continuing claims remain elevated well off of their lows. Continuing claims update for the data today (versus average) in figure 1 below, and highlighted against all previous cycles in figure 2 below.
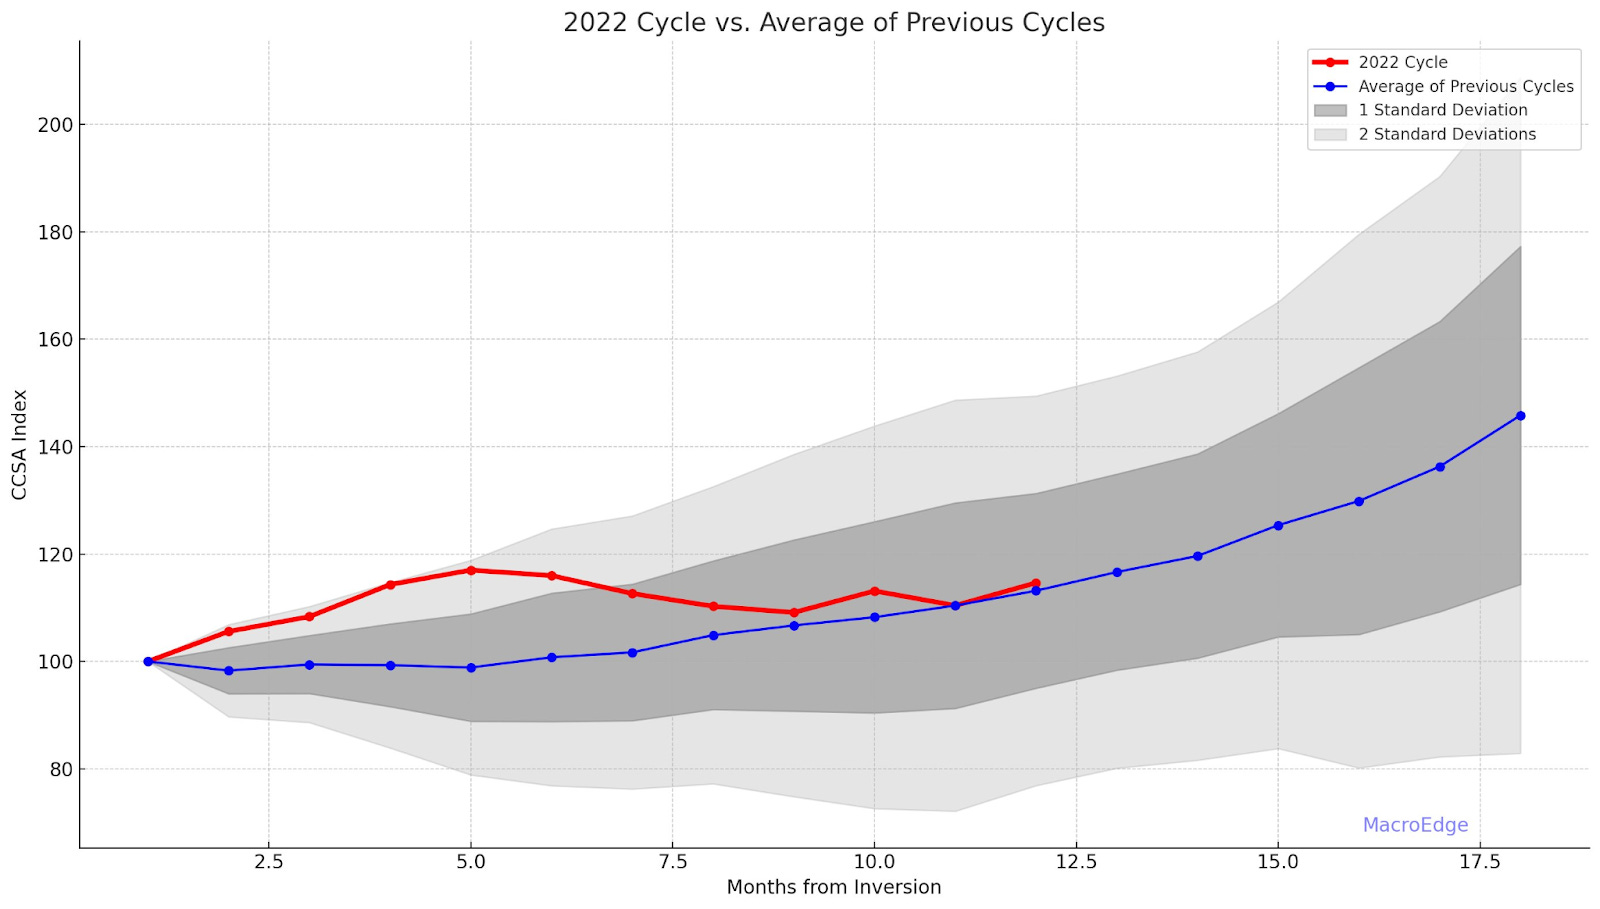
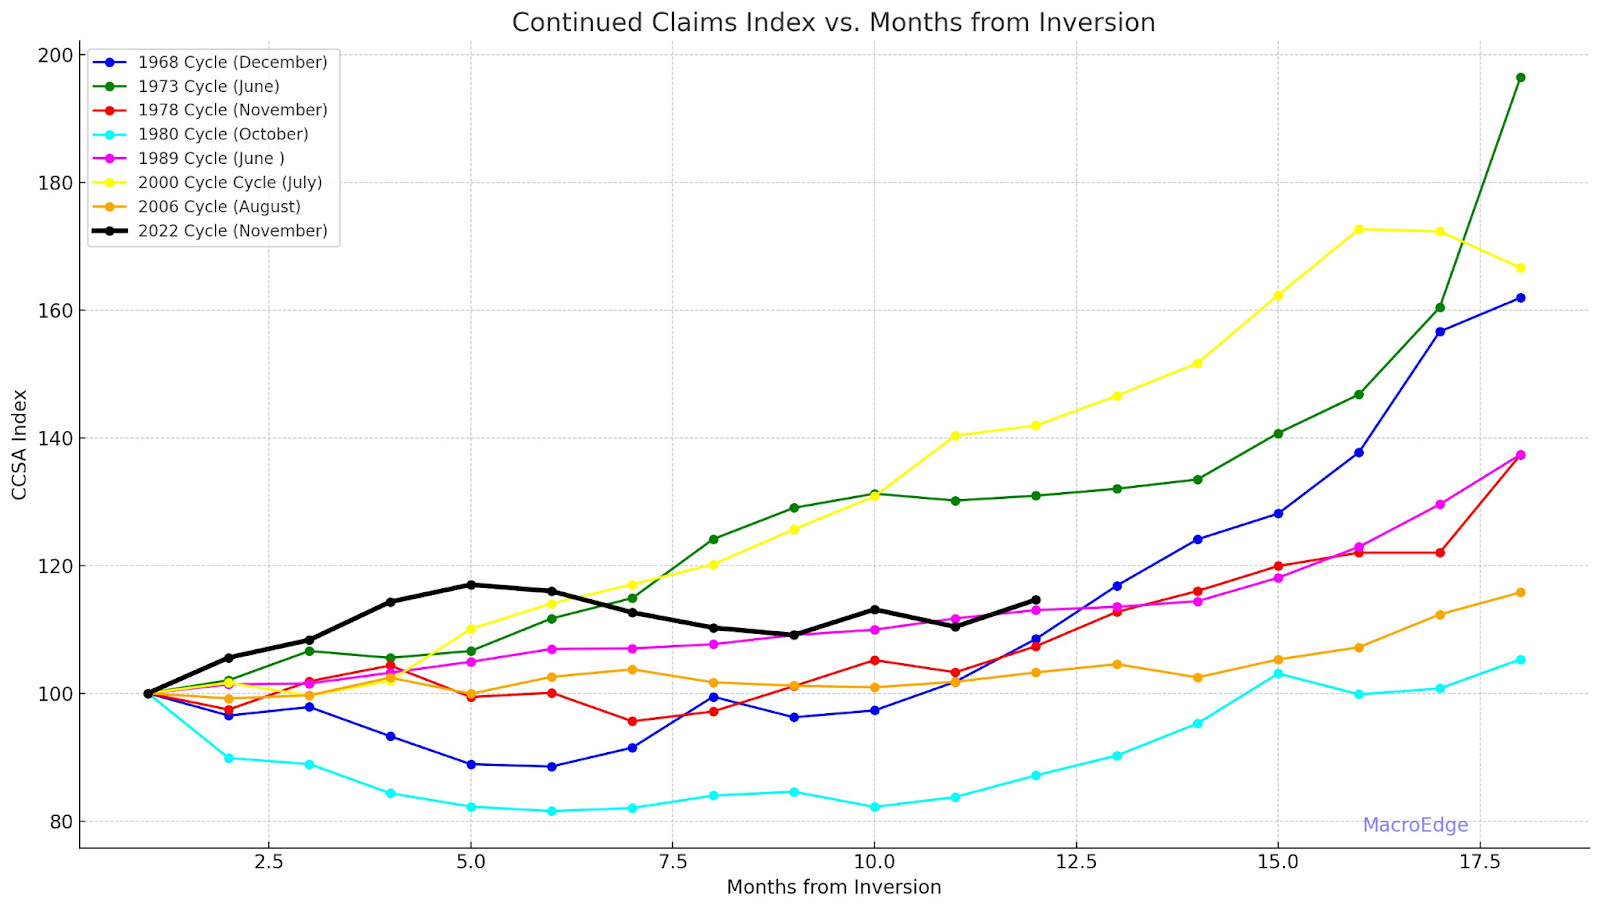
Of note: the difference between cycles is fairly large. 2006 was very slow-moving, along with 1989 (the closest index to the figure we have today). Each cycle is different. I continue to anticipate continuing claims ‘walking’ higher from this point especially as job openings continue to close.
Turning our attention to the home sales data from the NAR today… abysmal to say the least. Existing home sales dropped to the lowest level since 2010 (when home sales were rock bottom following the GFC). This was also the lowest of this cycle. Expect this to continue to ‘discover’ new lows as long as yields/the spread remain awful and mortgage rates stay north of 7.5%.
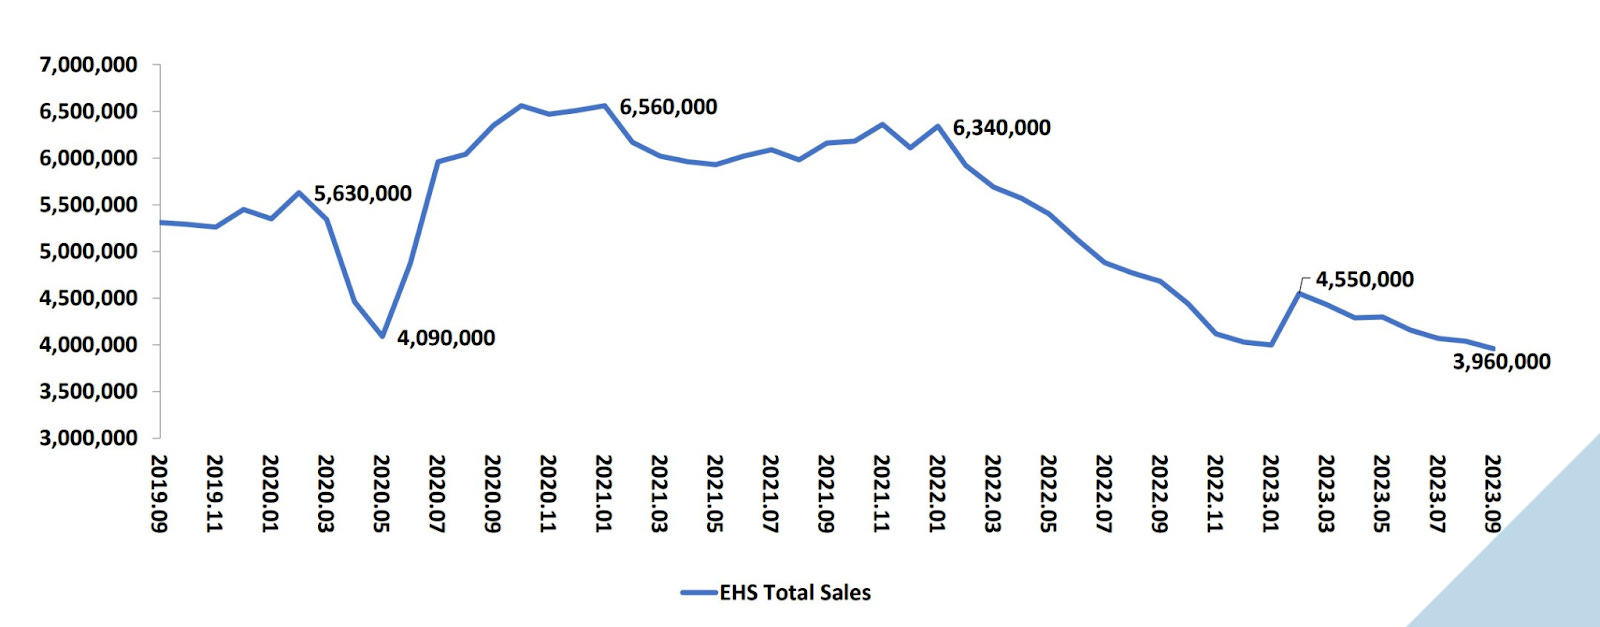
(Existing home sales: NAR)
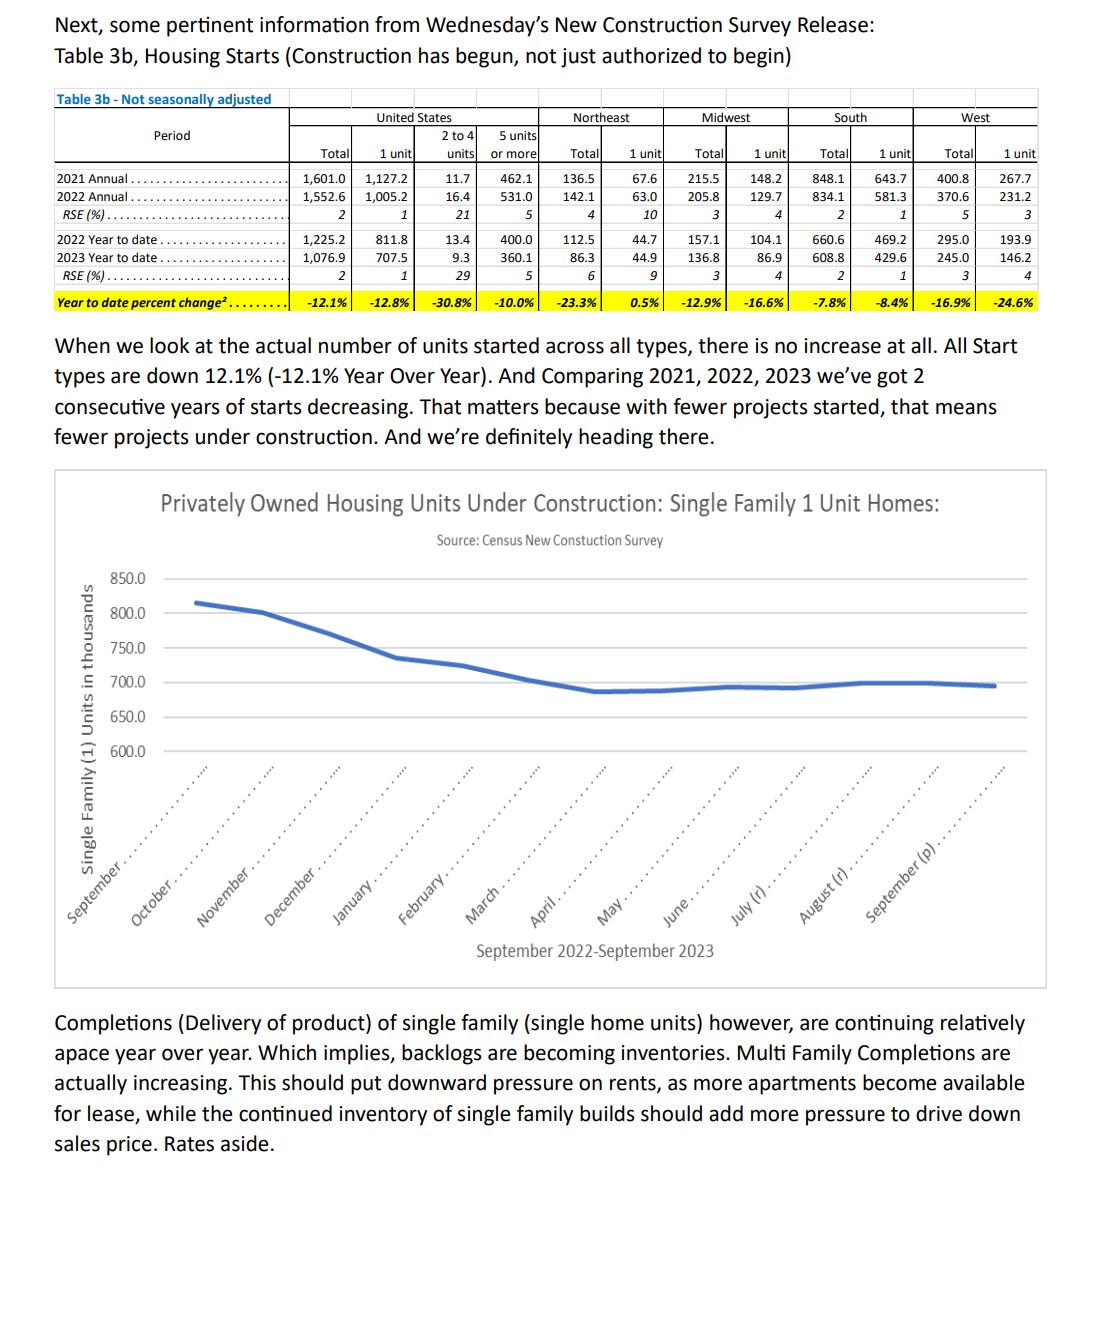
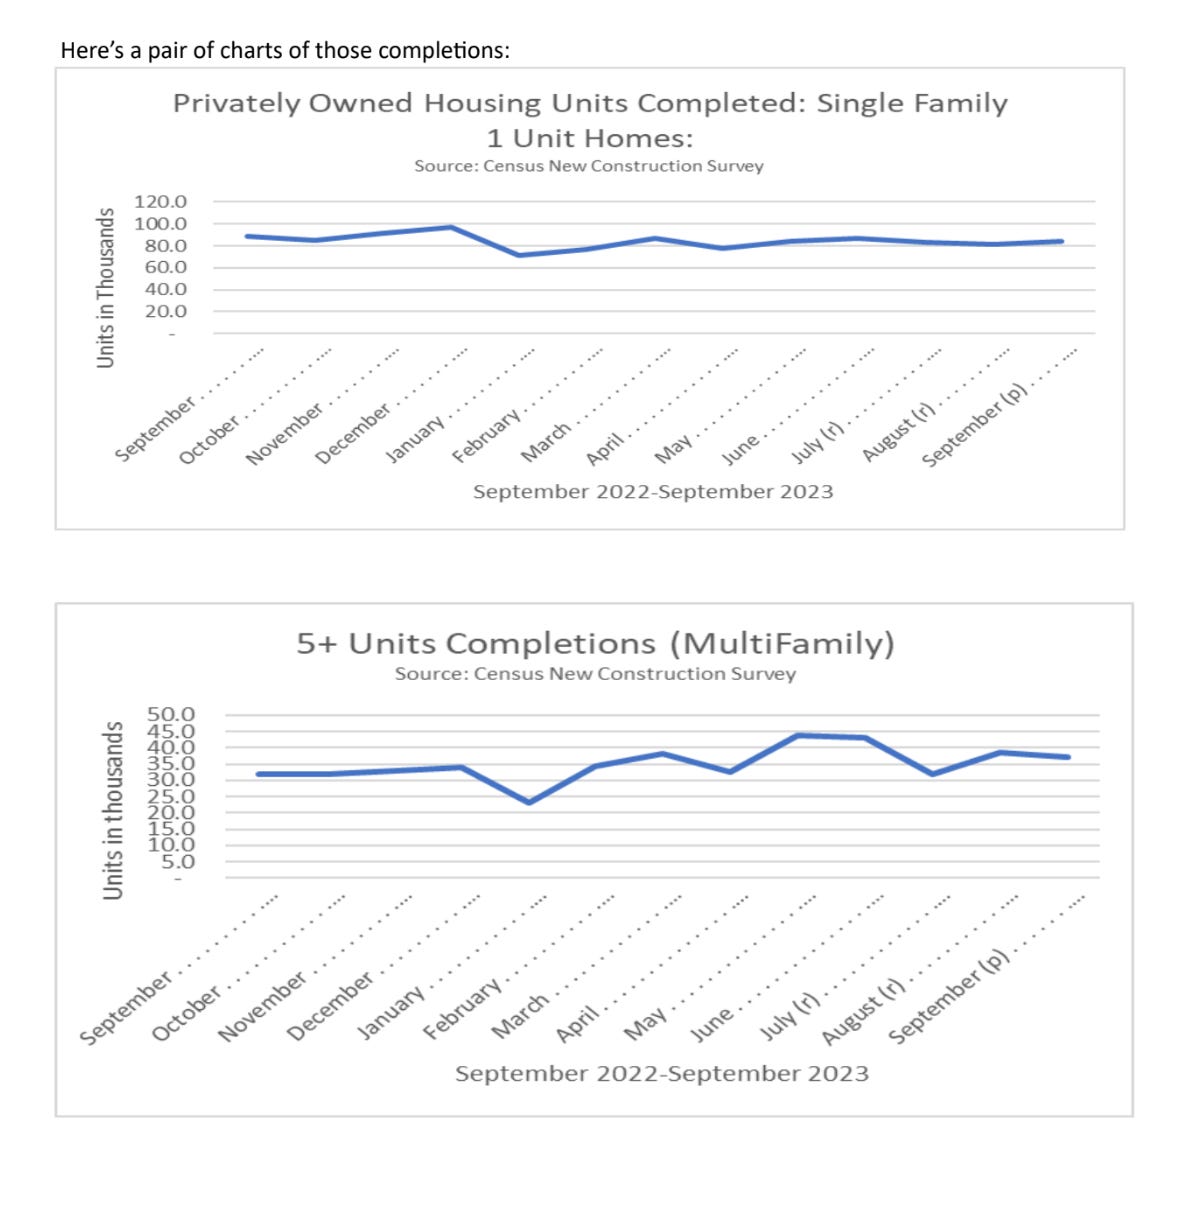
On the new home side - builders are reporting slowdowns as well with rates where they’re at and inventory is rising nationally. The NAHB index declined to 40 again, showing dropping confidence in the homebuilding sector. The housing sector continues to remain in an activity recession and the pricing story will remain one that plays out on a local/market-by-market basis depending on the employment and inventory environments in each location. (Sure, AirBNBs etc… may have a bonus effect on the inventory side over the next year as well). We continue to anticipate a rollover in residential construction at some point and that will likely occur when the multifamily mania finally pops (seeing early signs of this in places like Austin). On the commercial side - well yikes is all I’ve got to say there.
The Conference Board updated their leading index (LEI) today which saw a decline of .7% m/m:
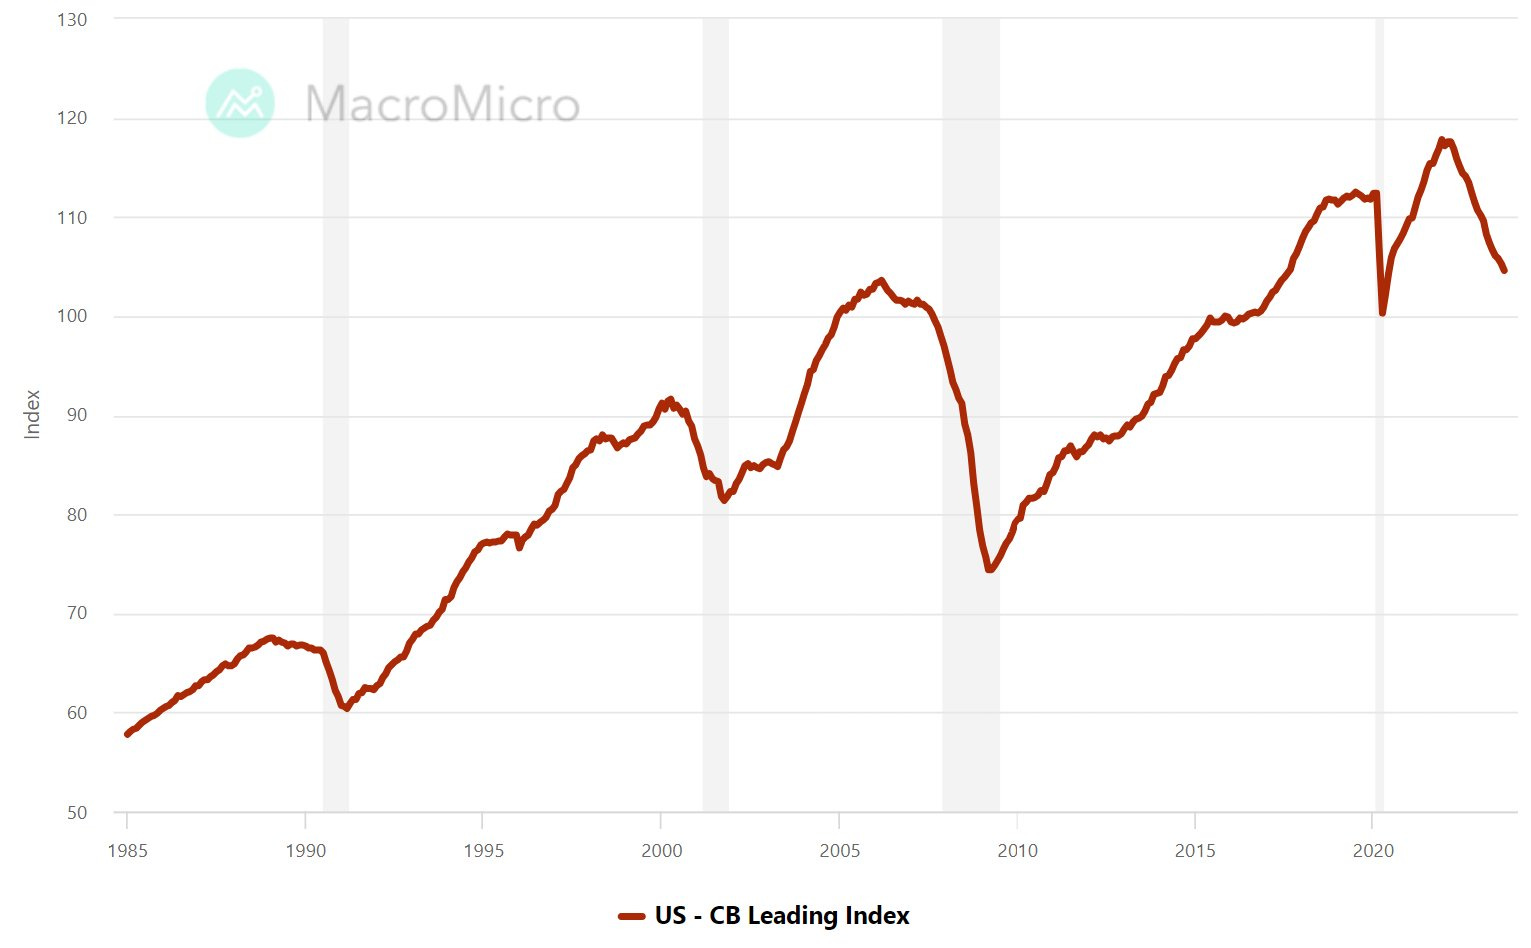
This puts us pretty on par on a % basis with the drop seen in 89/00, and the 6 month rate of change has begun to become less negative for now. In examples like 00-01, you can see that the LEI can decline for extended periods of time before labor weakens. How much will labor will weaken this cycle? As stated above, I don’t think an 89/00 scenario is unreasonable. Let’s see how the rest of the quarter plays out.
The market overall has continued to show weakness under pressure from surging yields (10Y>5% today) which is the highest since 2007. This has resulted in a ‘steepening’ of the 10y/3 month curve to -49bps as of this writing as the 10y has begun to catch-up to the 3 month yield which has been relatively unchanged now for a few months. Fed speakers continue to point towards this being the terminal rate for the cycle and I’ve stated going back to late summer now that they’re done hiking in this 525-550bps range. You can view the latest 10y/3month relationship I’ve been tweeting daily since August here:
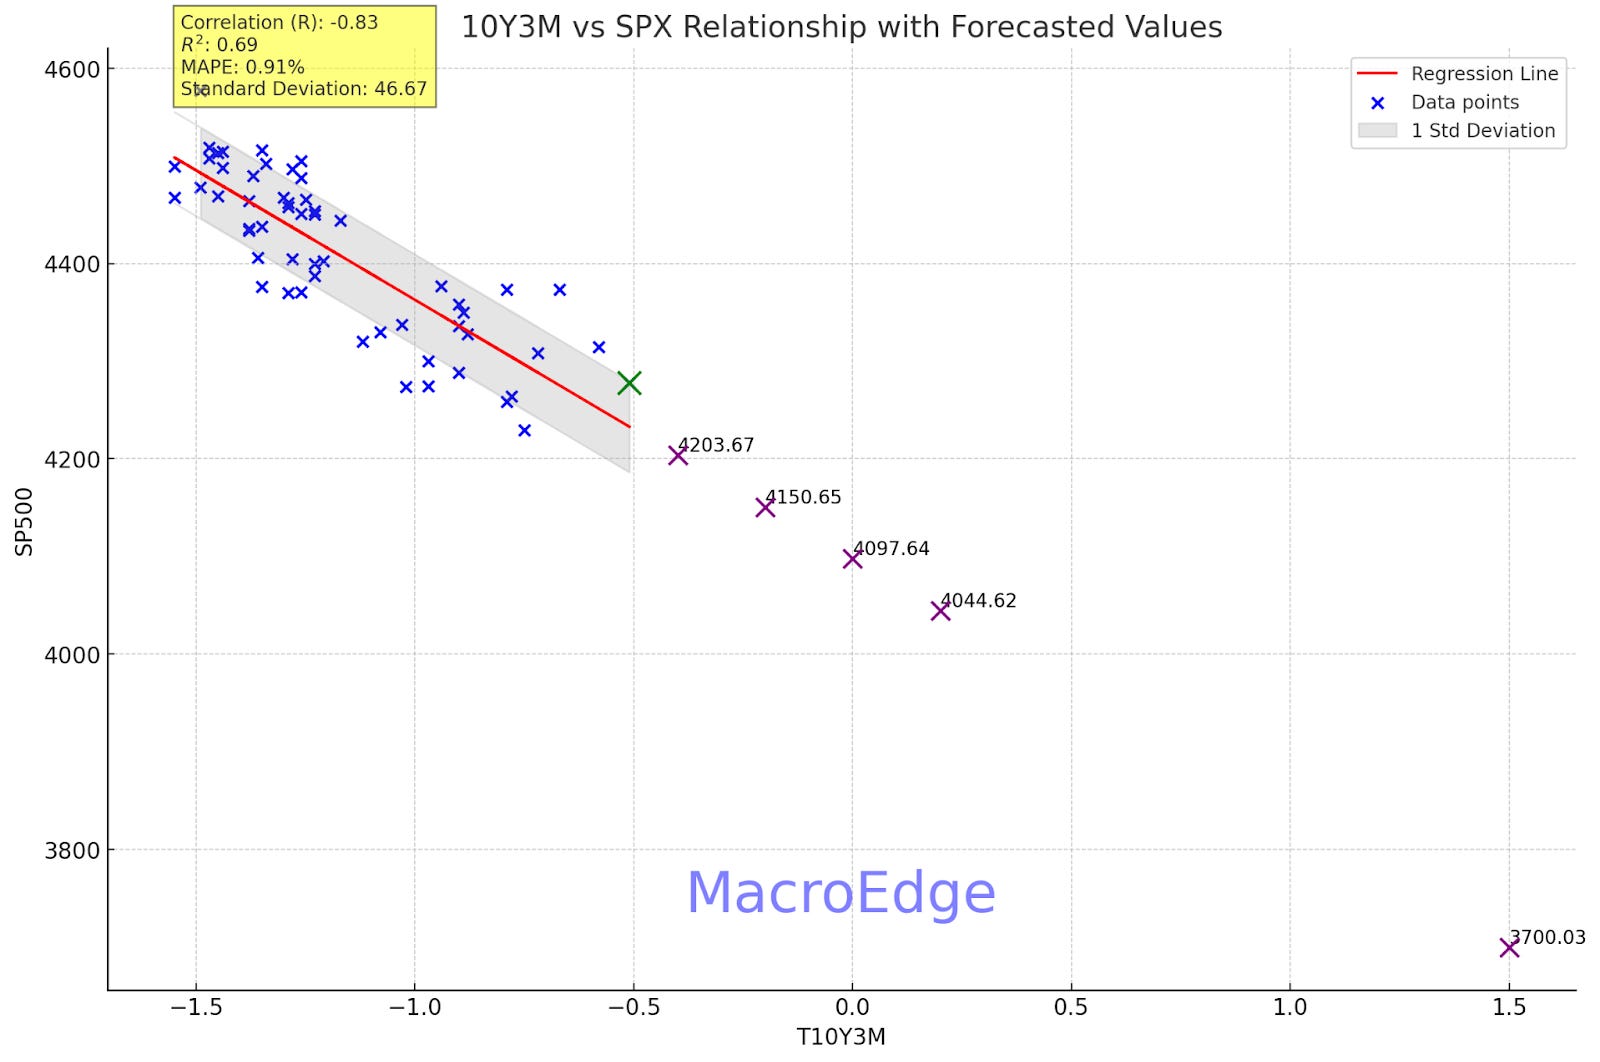
Once the spread hits zero - we can officially begin our ‘likely recession start window’ - which may begin within the next month or two. Will keep you posted on this. Hope this was helpful for now, I don’t want to keep rambling on for the evening, and enjoy the pieces from Six & A.
Have a great evening and may the VIX be with you (not good if you’re Jensen Huang),
DJ
Intra-Week Market Update (@SixFinance, MacroEdge Head of Research)
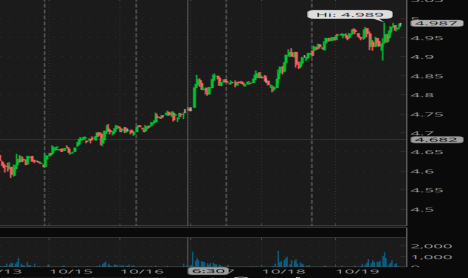
Yields have exploded higher this week as bonds cannot find any kind of a sustained bid. At the time of writing, the 10 year yield sits at 4.99%, nearly a full percentage point higher than when high yields caused the collapse of Silicon Valley Bank, Signature Bank, First Republic Bank, and historical goliath Credit Suisse( who had been having issues for years but this was the final straw).
This move in yields becomes extremely toxic for long equity positions. The 10 year yield now is close to exceeding the forward earnings for 2024 on the S&P 500. The 20 year yield already does.
The risk here for equities is tangible. We already have seen what the decline in treasury prices did to banks earlier this year before the FED stepped in to provide emergency liquidity via the Bank Term Funding Program BTFP. Other institutions such as insurers, pension funds, even social security, are major buyers of Treasuries that are now deeply underwater on current market value. Systemic risk is rapidly increasing.
Oil continues to ramp this week as Middle East tensions continue to increase. Hezbollah in Lebanon has engaged Israel via back and forth launches of rockets and on Israels’ end, airstrikes. Iraq resistance groups have attacked US bases in Iraq with drone strikes. Israel used airstrikes on two large airports in Syria. Iran has said the “time is up” on Israel to cease its campaign in the Gaza Strip, to which Israel responded on Twitter/X:

The US has deployed multiple carrier strike groups to the Middle East and Israel has been accused of bombing a Gazan hospital, which both groups are insistent on pointing fingers at the other over whether it was an Israeli bomb or a Hamas missile misfire.
Putin went to China during this to strengthen their percieved alliance with an attempt to get the UN to condemn all violence against civilians in the Israeli-Palestinian conflict, which the United States vetoed.
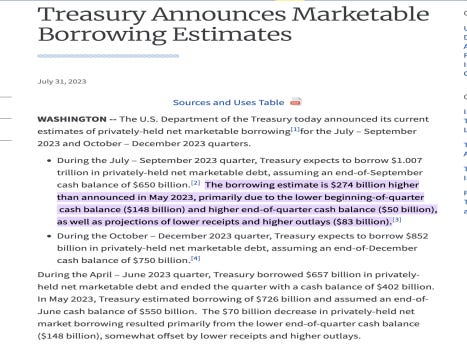
An enormous amount of Treasury issuance lies ahead to add to the demand woes of the Bond Market. The most likely course of yields in my opinion is higher until something breaks.
I have sold all long positions except for my long oil position which I plan to continue to hold until the Middle East resolves and my target is a retest of the year's high, and if that holds, $100 on crude futures /CL.
As of today 10/19/2023 I am long index puts that expire in January.
I believe the risk here for equity markets cannot be understated and that long positions if held must be hedged due to the enormous amount of risk to the markets with yields at these levels. Until yields come down meaningfully, the S&P 500 is significantly overpriced. If conflict in the Middle East were to escalate, risk to the equity markets only increases.
Home Construction Update (@MrAwsumb, MacroEdge Contributor)
Disclaimer: MacroEdge aggregates content from various contributors who discuss the market in an educational manner. In no way do we endorse various holdings, positions, or statements made in any report.
I dig your newsletter and how it’s developing even if you keep referring to this as an extended bear rally I can forgive that 😀