
10/1 Weekly Report - 'MacroEdge Leading Employment Index, Casino Revenue Data, a Nashville Winter, Boomer NFTs, and More
In this latest edition of our weekly report - the MacroEdge team takes on everything from 'Boomer NFTs' to important discussions about Nashville economic data, what's ahead for jobs, and more.

10/1 MacroEdge Weekly Report
@DonMiami3, MacroEdge Chief Economist
@TexasRunnerDFW, MacroEdge Contributor
@KennyCap_PhD, MacroEdge Contributor
@SquirtLagurtski, MacroEdge Contributor
@GregCrennan, MacroEdge Contributor
@J77324, MacroEdge Contributor
Weekly Data Update and the Leading Economic Index (@DonMiami3, Chief Economist)
Happy Sunday evening all and welcome to Q4/October/Fall 2023. I am personally very excited for the ski season ahead and have always been more of a ‘winter guy’ once we get past about the 4th of July. Going to keep my article succinct this evening given the number of other contributors that have pieces for tonight’s reports. A reasonably quiet week for me ahead before the MacroEdge team hits the road to Nevada for our research trip on Las Vegas and Reno to see how various elements of the economy are holding up in the Silver State. Excited to report on our findings which will be available on the third Sunday of this month. It’s a pretty busy week on the data side of things this week with the ISM reports coming out along with further critical important employment data for the entire month of September which will allow us to update all of our labor market gauges/indexes. The focus of my piece today will be our Leading Economic Index, along with trucking employment, our SPX performance index, the updated Nevada gaming revenue index (promised last weekend), and our month’s end chart tracking the current 10y3m inversion length of this cycle. Based on all of the data - MacroEdge continues to anticipate a recession to begin sometime within the next 2-3 quarters - unless inversion continues and overall employment data continue to beats expectations (highly unlikely).
Before I jump right into all of the data - we have our final job cut tracker data available for September which saw 38,969 job cuts for the month. The press release is available at: MacroEdge.net. The largest job cuts were seen in healthcare, the automotive sector, and banking and more on expected October claims from our contributor J below on things to look out for.
Our Ozone Data Dashboard along with Ascend pre-access will again be available for signup sometime next weekend, we wanted to make sure and have everything ready before releasing anything out live via the new website.
I am very pleased that we were able to get the MacroEdge Leading Employment Index compiled - which uses weighted averages of sector sizes of 7 large cyclical sectors (Construction, Retail, Temporary Hires, Leisure, Manufacturing, IT, and Employment Services) which saw a decrease to 99.11 from 99.223 month/month from July to August. Next weekend both the website and my next report will have the latest update on this important data piece. As seen below, we are currently tracking down the middle of the 00/07 recessions on the leading employment side, and we can expect further weakness on this front into the winter.
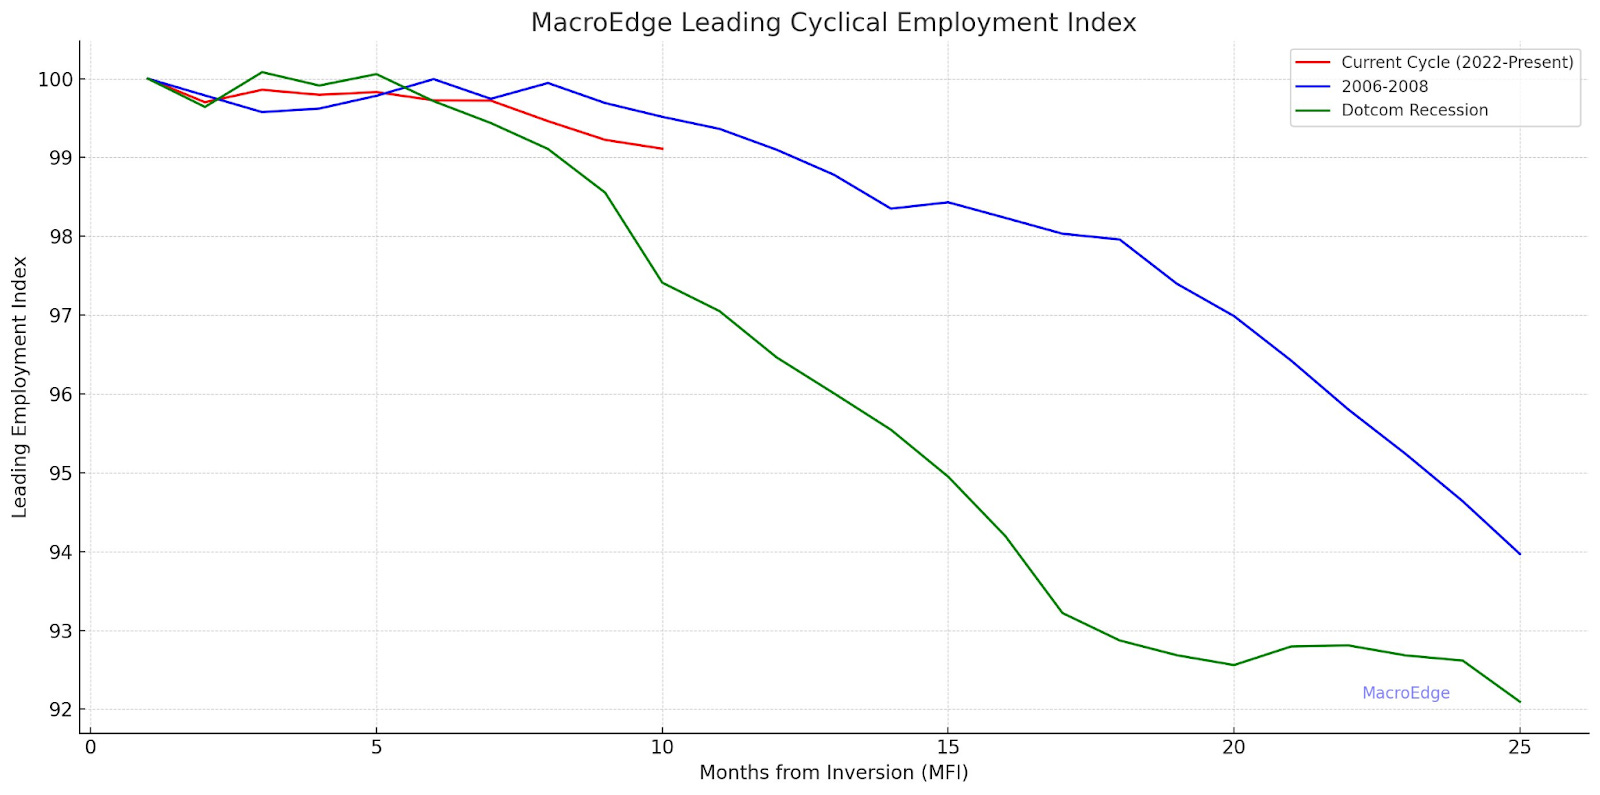
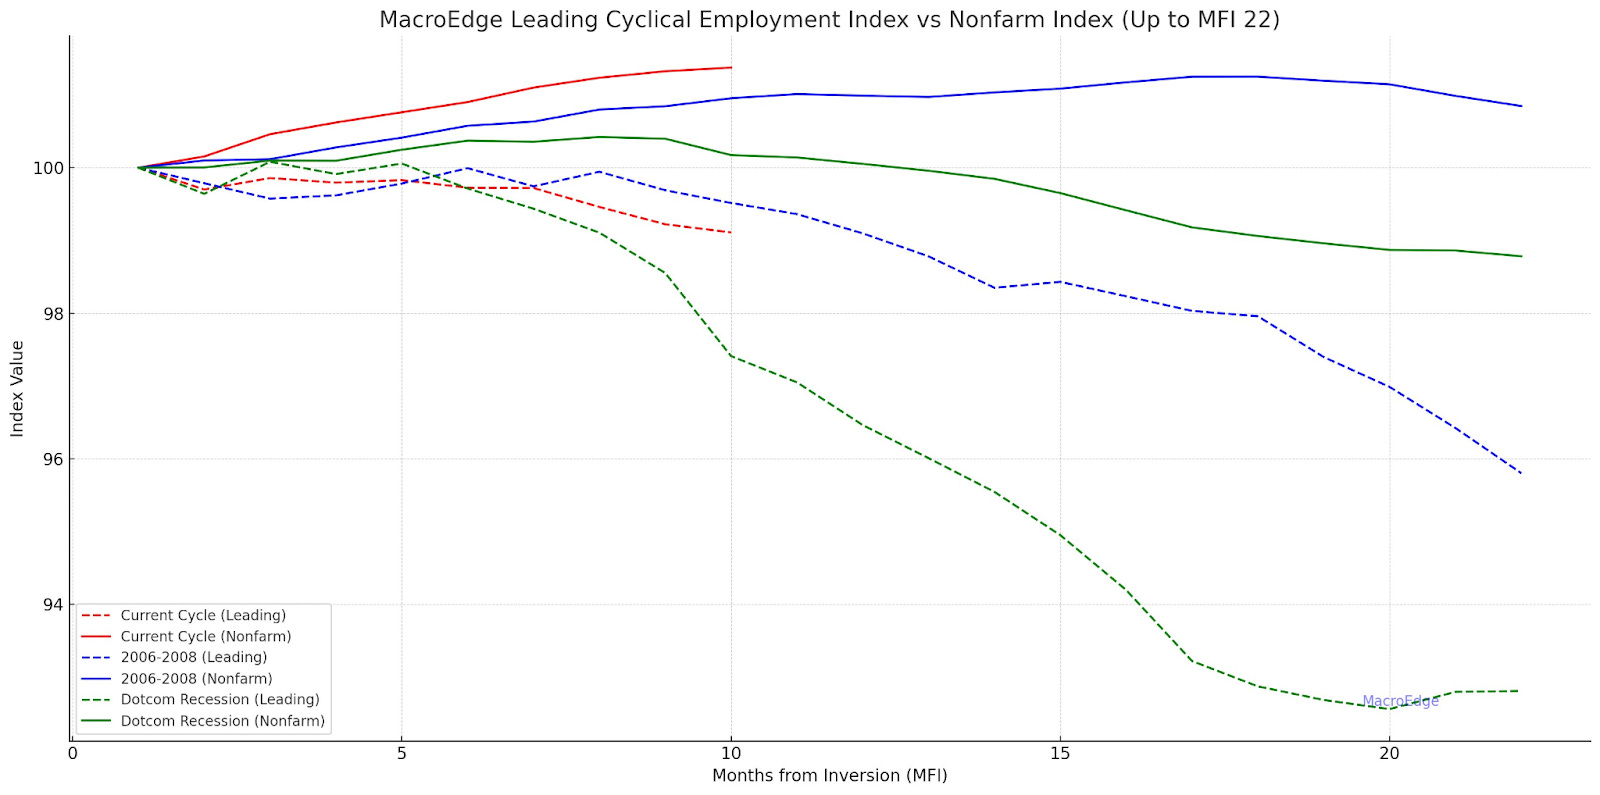
Here’s a snapshot of the Leading Economic Index versus the average aggregate total nonfarm payrolls for the current cycle, 2006-2008, and the Dotcom cycle. While payroll growth has remained strong (aggregate), our cyclical leading employment index is signalling recession well in advance of our total nonfarms. I expect that we will see a peak in nonfarms about the time claims spike.
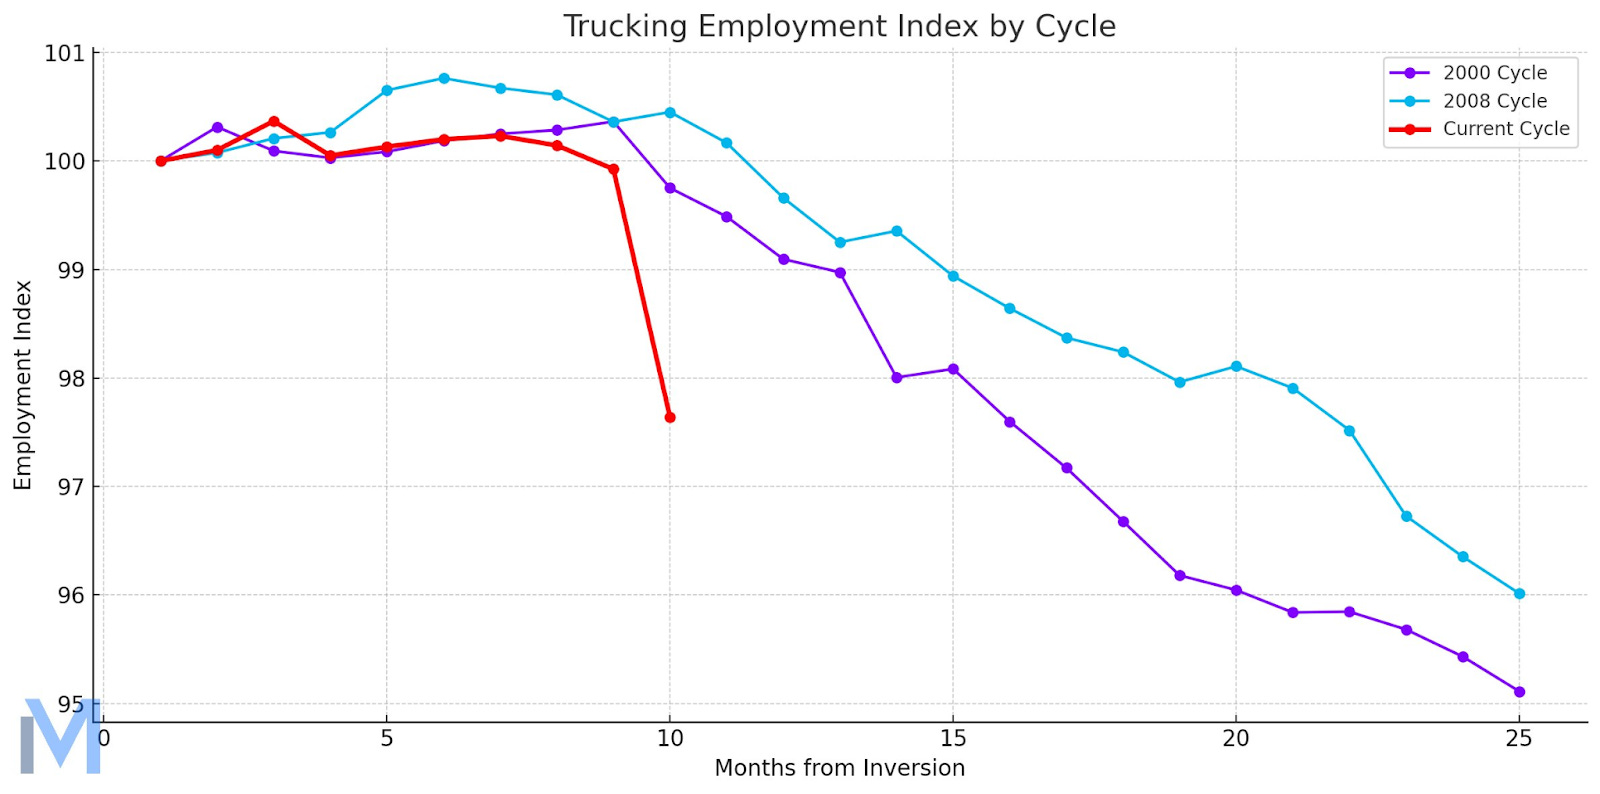
On the trucking employment front - this employment data is flashing a recession warning (although the large drop warrants a second look with the YRC bankruptcy) - though the freight sector is experiencing its worst downturn since 08.
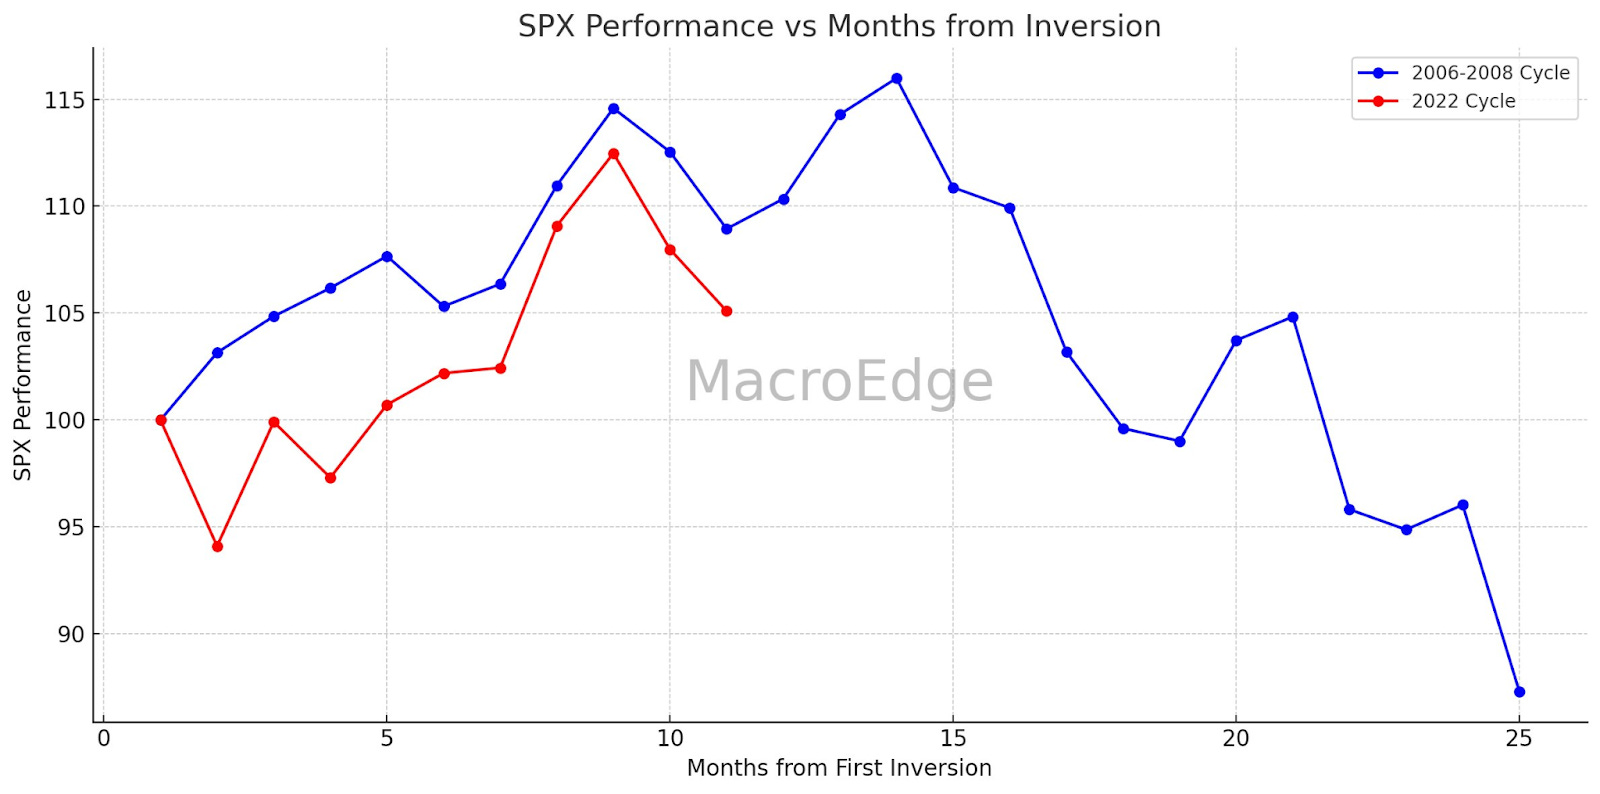
Our SPX performance index below provides us a good idea of the potential historical upside left for equity markets given that 07 saw the highest performance figure of any period following the inversion of the 10mo/3y spread. As I’ve stated for the last few months - the upside continues to look historically very limited, with 10bps on the index or so left to the upside if this cycle were to continue to following the pathway of 06-08. A key piece to watch for here in the coming months will be whether or not we begin to see a divergence of the two cycles, although my current expectation is for labor markets to begin showing weakness in late Q4/Q1 and markets tend to lead this by a month or so.
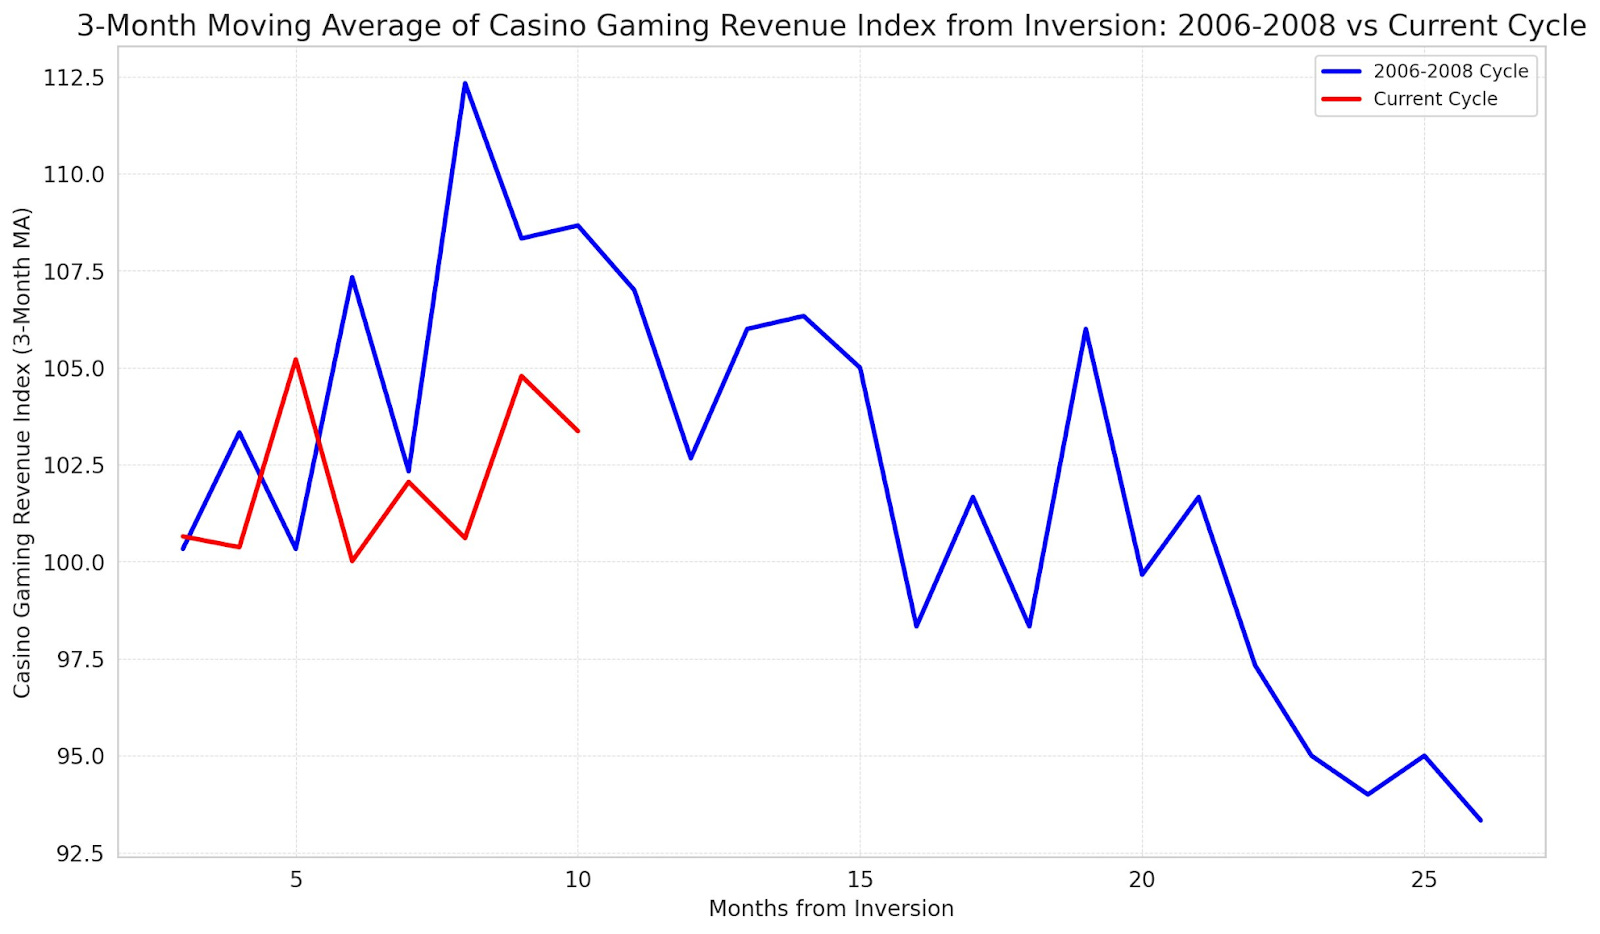
Looking at the August update from the Nevada Gaming Control Board - we can see that the current cycle is clearly underperforming the 2006-2008 cycle. I smoothed this graph with a 3-month moving average to smooth the data. One thing to watch out for here will be the winter spike that tends to show up in Nevada gaming revenue data as revenue has historically trended up into the hot months of December/January (New Year). One thing that might be pointing towards a more lackluster winter for Nevada gaming revenue is the last 2 months of horrific performance for the Vegas casino companies which have been crushed in this period of time, along with airlines. I will continue to update the below chart as the revenue data comes in, and it will be a useful gauge of entertainment spend as this cycle progresses:
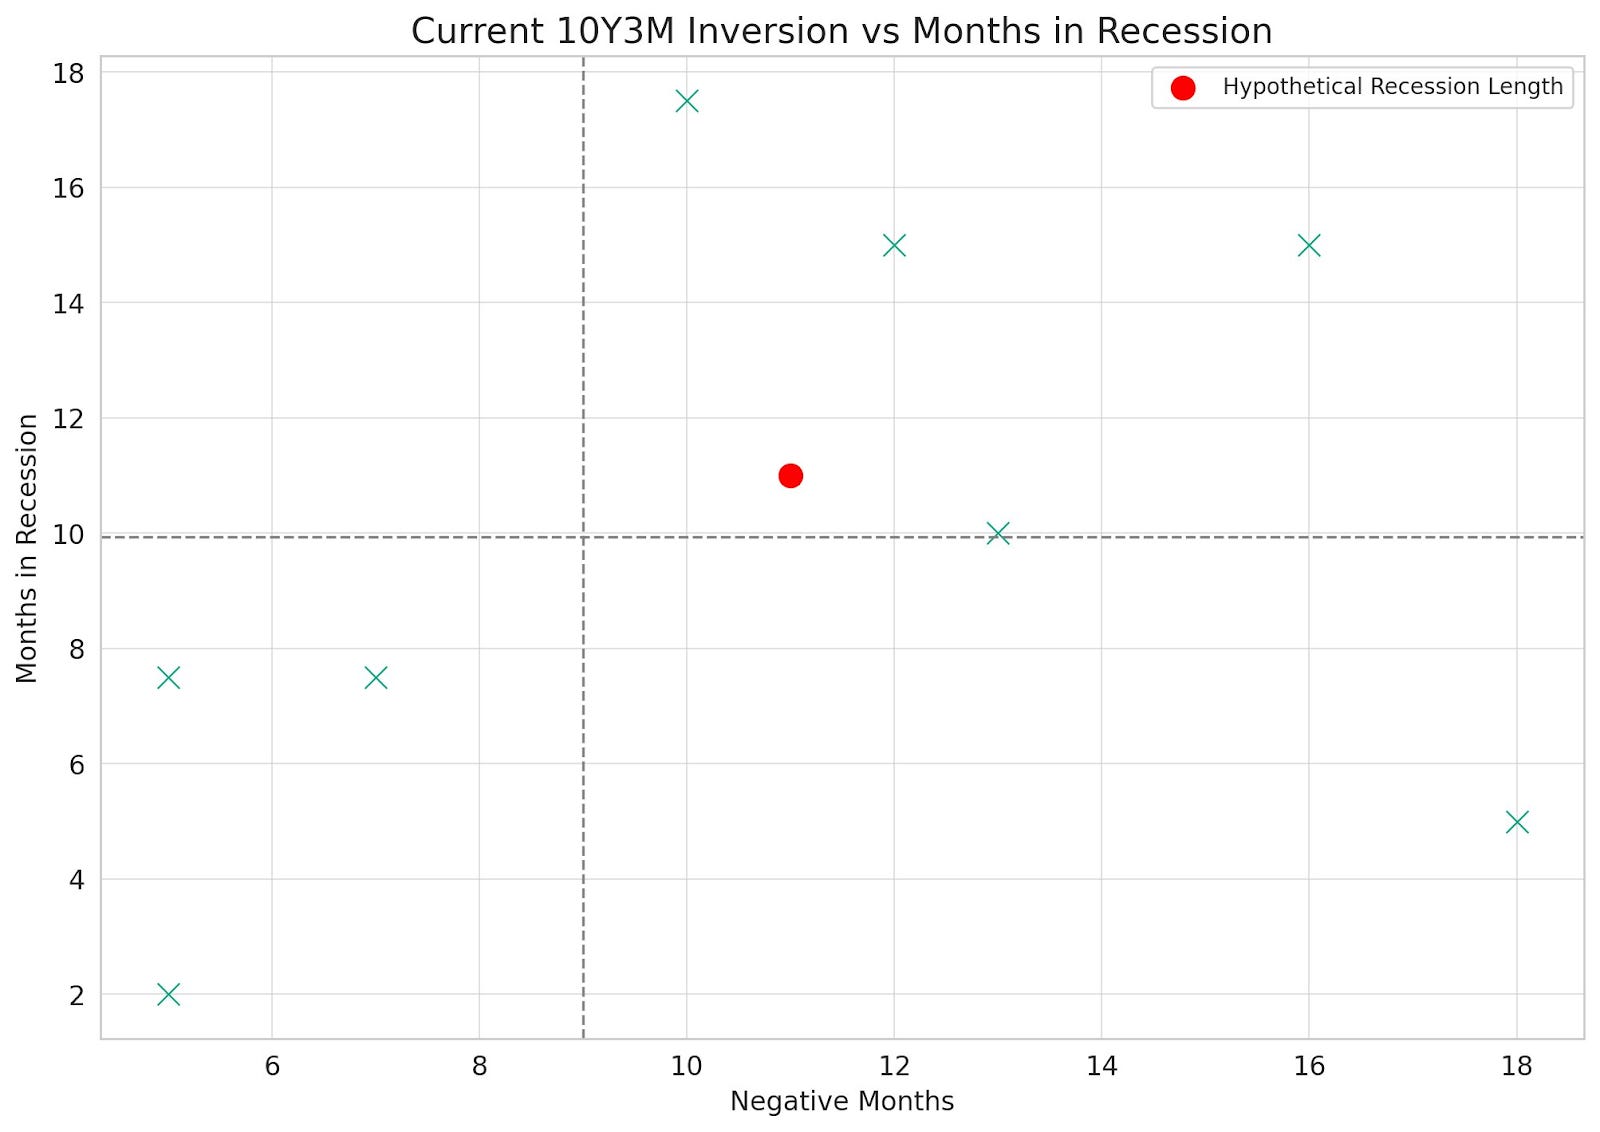
(Above) Looking at the latest update on the 10y3m inversion total length - we are now at 11 months fully inverted - which confirms this as the 5th longest inversion to date of all modern economic cycles (post 1969). Given past cycles of this length (in the right upper quadrant) - we can expect a recession >9 mo’s which excludes the 18-month inversion preceding the 1980 recession because rates were cut to such a degree that is impossible today given where the current Fed Funds rate is at.
Hope this was very helpful to you all and I will let the rest of our team take it away below.
Have a great rest of your Sunday evening.
DJ
Houses are Boomer NFTs (@TexasRunnerDFW, MacroEdge Contributor)
I had a tweet go viral this week that featured a Facebook post written by what can only be described as an HOA Karen lost in an NFT Discord Chat. This woman was admonishing homeowners in her neighborhood listing homes for sale as being cowards because they are listing their homes for less than they she believes they are worth (AKA: market price). Prisoners are starting to break the dilemma and Karen isn’t happy about it.
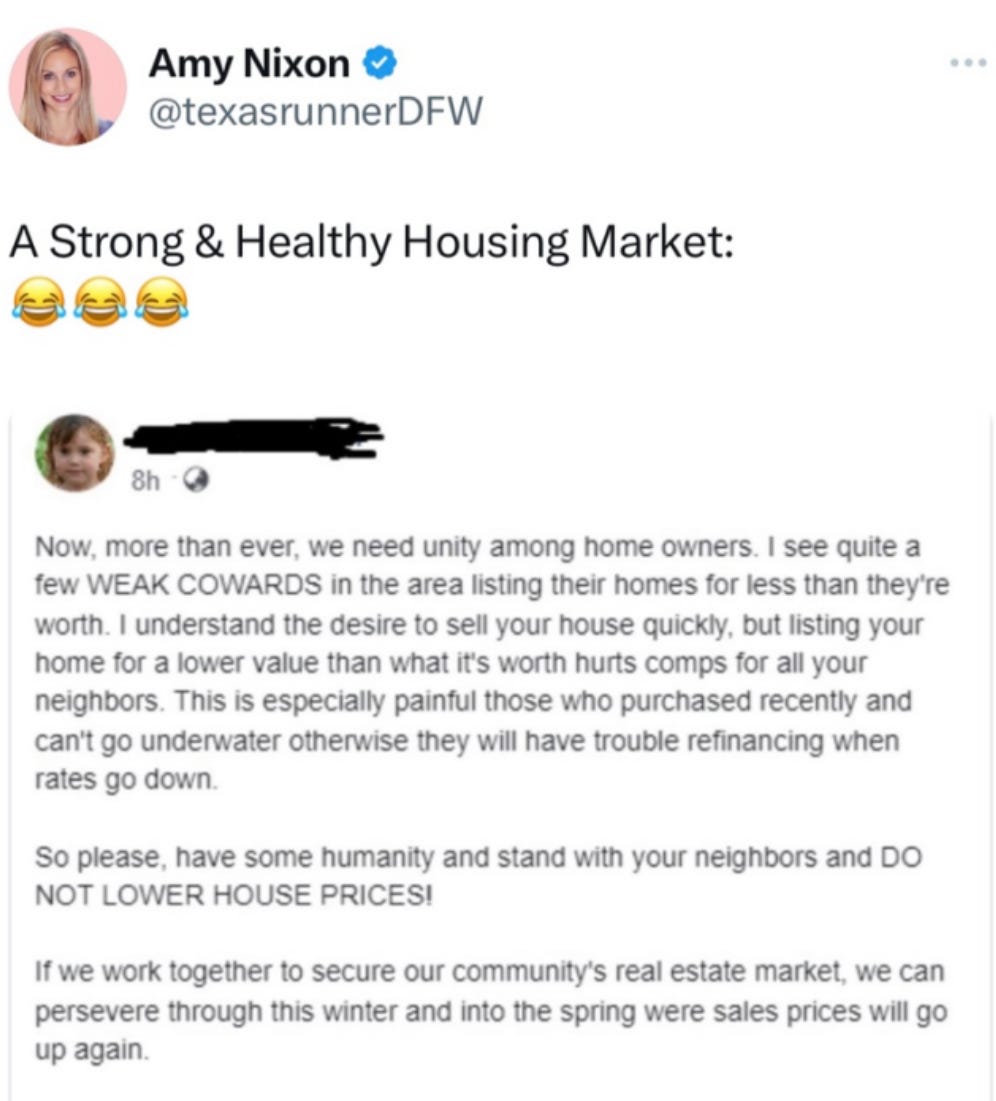
Her line of thought: If we all just diamond hand these houses, we can keep comps propped up until Spring, when prices should resume their climb again because, IDK, I guess in the Spring home prices magically defy whatever macroeconomic environment they’re in and bloom upwards like flowers. I hate to inform her, but it’s looking increasingly like we’re in for a long hard economic frost this winter and those reliable perennials aren’t going to make it this year.
There’s a lot of both collusion and delusion going on in her post, but I suppose the same can be said for much of the US economy at the moment. Everyone seems to be holding both their breath and their assets, waiting for the elusive moment when the Fed cuts rates again and “everything can go back to way things were before”.
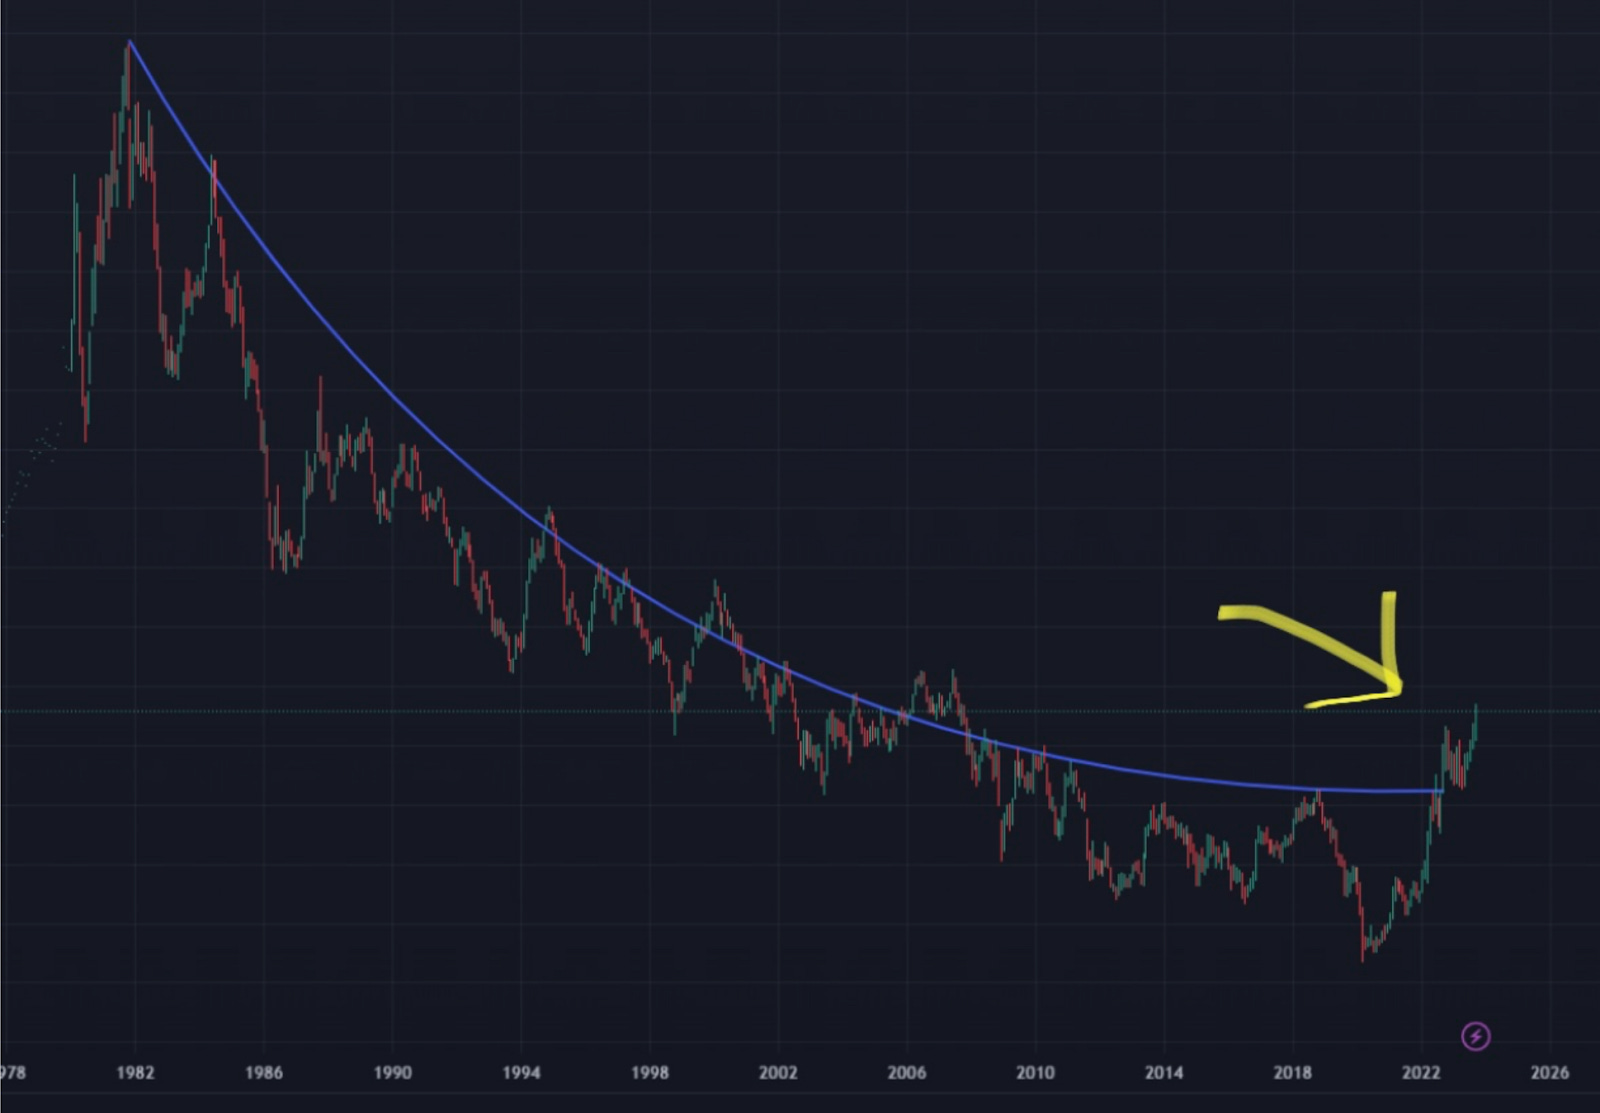
I have news for you: The recent 10-year yield breakout is telling us that things are not, in fact, going back to the way they were before. We are entering a new regime of interest rates, and NOBODY knows what it’s going to look like. It is not safe to assume that certain risk assets will continue to perform the way they did under the prior regime of continuously falling rates—a regime that relied on rates bottoming ever lower.
In this new “higher for longer” rate environment, homes still need to be bought and sold. The housing market has spent the last year delaying the inevitable--finding workarounds with cash deals and builder rate buydowns. Eventually the market is going to hit the wall of higher rates. If rates do not move down, prices will. It will not be a linear drop and it will vary greatly by region. Some regions may not see much drop, while others may undergo massive corrections.
It foolish and comical to think asset holders can simply join diamond hands in solidarity and refuse to have a functional market in order to protect comps from true price discovery. A home is not a meme stock that people simply HODL forever in hopes of creating a permanent price floor. Residential real estate is not supposed to be a risk asset, but our prior monetary policy has de facto made it one. Homes were once places where we raised families. Now? They’re Boomer NFTs.
A Dreamy Nashville Country Winter… or not? (@KennyCap_PhD)
For those of you who know me, I tend to focus on 3 things: healthcare, housing, and anything related to employment.
Why? Because healthcare and more recently bachelorette parties are the backbone of my long-time hometown- Nashville, TN. Ok- maybe I’m slightly exaggerating for effect, but there’s actually a lot of data to substantiate this.
All kidding aside, I tend to think Nashville is uniquely positioned in this economic cycle to really gauge the strength of the consumer, and then some.
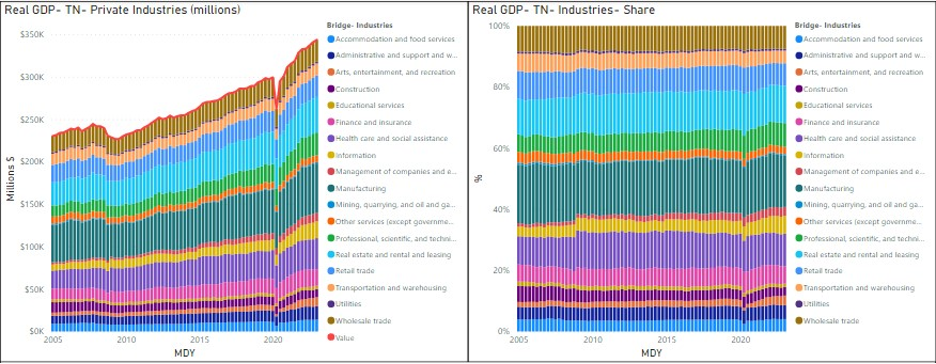
Most know housing is by far the largest/top contributor to inflationary metrics (Headline CPI: ~32%; Headline PCE: ~16%), which is the primary reason rates will stay higher for longer (until something breaks, that is). For this reason, I believe it’s critical to follow home prices, and locally they have been remarkably buoyant thus far (as is the case for a lot of southeast metro areas).
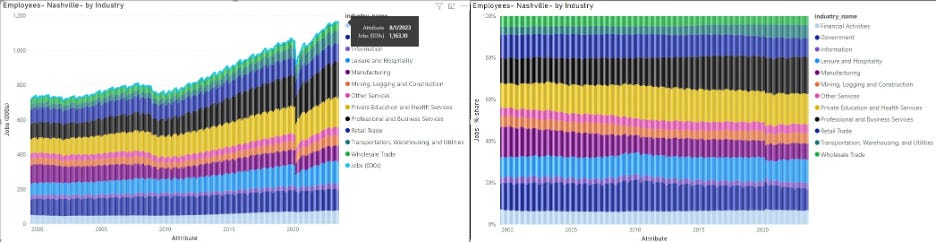
And we all know employment plays into the stability of home prices, so let me paint the picture of my local economy. Nashville has a decent representative mix of all industries- manufacturing, information, professional & business services, financial activities/construction, and all things healthcare to name a few. Companies HQ’d or with large satellite offices in the surrounding area include names like Bridgestone, Nissan North America, Dollar General, HCA, Lifepoint, CHS, Genentech, Sony BMG, LP, Alliance Bernstein, soon to come Oracle, and Amazon HQ2. Lest we forget about the small operators around here- lots of realtors/construction, leisure & hospitality/retail trade workers. Gotta support the short-term rental market, no?
To that point, everybody somewhat understands the Airbnb bachelorette party reputation of Nashville, but there are underappreciated stresses in the jobs market here that might not seem obvious. Industries like provider-based healthcare, particularly Physician Practice Management (PPM), are not nearly as defensive as some might think, and is largely dominated by PE. Most don’t see the strain these companies are feeling- it’s already a low/no margin business. Add in the 2022 No Surprises Act, which prohibits out of network billing, and that has proven to be the last straw for many of these companies. Even in its compromised form, this legislation is adding pressure to the PPM space- just ask Envision. Simply put, there’s lots of jobs/dollars behind anything that touches the PPM ecosystem- I see you professional and business services!
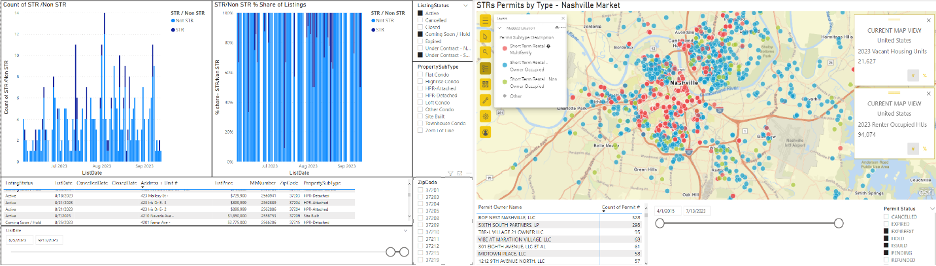
Plus we haven’t even started talking about the obvious froth in all things real estate here- multi family, single family, and everyone’s favorite, STRs! Nashville’s housing market is clearly being distorted by the proliferation of short-term rental investors (and yes migration trends). By my conservative estimates, STRs have tripled as a share of our housing inventory since 2015! National metrics (~.8% of total housing inventory) completely misrepresent what I’m seeing here. On top of that, Nashville’s home prices did not experience a large drawdown during GFC- lots of recency bias and a complete lack of price discovery by local developers (single family, in particular).
Essentially, what I’m saying is Nashville’s economy is structurally more cyclical than it used to be. And of course we’re not alone.
Pair all this with unprecedented stimulus, work from home/post COVID migration patterns, the
resumption of student loan payments- and that’s a cocktail even Kenny Powers himself wouldn’t touch!
Look- you can probably guestimate the average age of a bachelorette party. See where I’m going with this? That’s why I think Nashville and other areas in the southeast will behave differently in this cycle.
Since I tend to think this is nothing more than a case of extreme demand pull forward- here are a few things I’m watching:
TSA National and local (BNA) passenger data- it’s slowing!
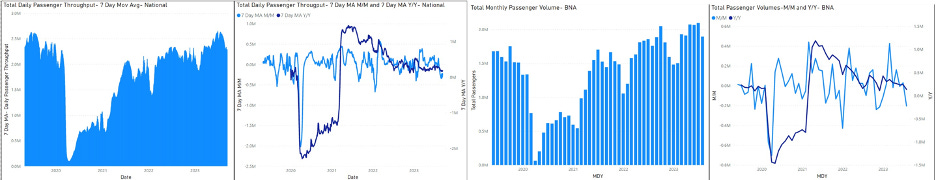
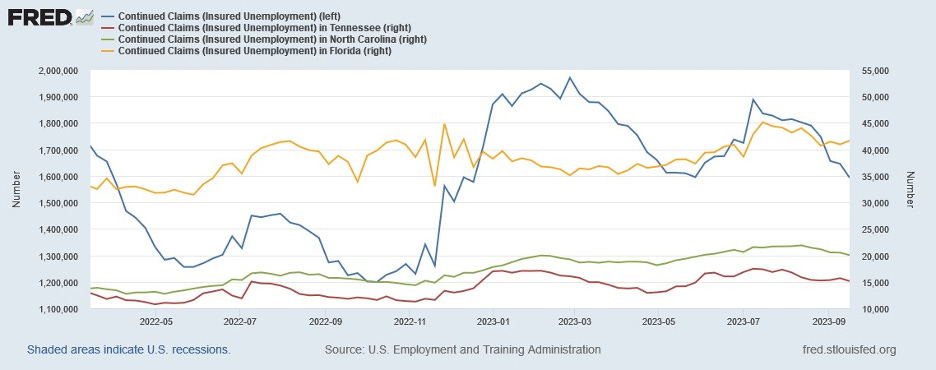
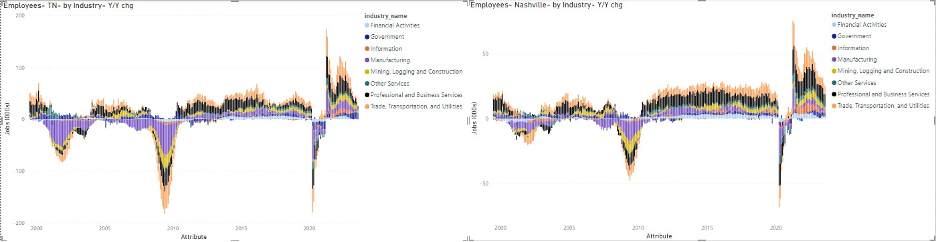
Anything employment related- the structure and trend of labor/GDP, jobless claims etc. Speaking of which, continued claims are in a well-defined uptrend nationally. It’s no different for southeast states, although participation has varied compared to prior cycles. And job growth is clearly slowing across the country and locally
Local STR active listings and permitting trends.
Rent vacancy rates, which are at ~20-year highs locally, with more supply set to come.
And much more
Is it different this time? Well yes…yes it is. For Nashville, at least. And not in a good way!
Sources:
BLS- https://www.bls.gov/
BEA- https://www.bea.gov/data/by-place-states-territories
TSA- https://www.tsa.gov/travel/passenger-volumes
BNA airport- https://flynashville.com/nashville-airport-authority/airport-data-and-reports
MLS (realtracs)- https://www.realtracs.com/
Nashville Davidson County Public Use STR Permitting Files- https://data.nashville.gov/Licenses-
Permits/Residential-Short-Term-Rental-Permits/2z82-v8pm
Nuclear News Update (@SquirtLagurtski, MacroEdge Contributor )
On September 20 th in a press release BWX Technologies ($BWXT) and Crowley, a titan in global shipping and energy supply chain logistics announced through a Memorandum of Understanding they are developing a first of kind 378 foot sallow draft hull ship. The co-development and subsequent deployment of the vessel highlights the commitment of private industry to reducing carbon emissions, while also innovating new technologies currently being developed in a growing sector within the clean energy space. It also holds vast potential in multiple applications throughout the landscape of industry as it will be the first example of offshore nuclear power generation since the 2970’s.
BWX Technologies develops nuclear energy components and commercial power generation since 2015, when Babcock & Wilcox Company spun off the power generation arm of the company to focus on nuclear reactors, and US Government operations. Their current notable projects include partnerships with Bill Gates owned Terra Power and their Natrium project in Wyoming, and the first ever nuclear-powered spacecraft, and all required support systems including HALEU fuel production for the DRACO (Demonstration Rocket for Agile Cislunar Operations) project through DARPA (Defense Advanced Research Projects Agency). BWX will be providing the reactor and support systems for the vessel and design various additional capabilities for the US government to provide applications in humanitarian, and military roles such as remote infrastructure support during natural disasters and in areas where there may be no possibility of on-site energy, for example, areas too remote to allow for cost effective electrical generation given current standards of construction and where terrain is too challenging. The Military applications for this type of ship are currently being considered and quite obviously have vast potential to the US defense sector and shows the nations evolving commitment to national security.
Crowley is a US based private logistics, marine, and energy solutions company. For over a century they have developed an impressive portfolio of marine logistics, fuel, and backend support/design solutions. Crowley’s history includes humanitarian support after a 1906 earthquake shook San Fransisco and has since then involved partnerships the US government and private industry in many ways, such as transportation of oil and container cargo. They offer a full-service suite and employ over 6,000 with annual revenues of $2.5 Billion. Currently they are working in alternative energy generation, including a joint venture CREST wind and will operate the vessel which houses and transports support technicians to maintain offshore US wind farms. The venture will work under a long-term charter with Siemens Renewable Energy.
The joint development of an offshore nuclear energy generation vessel between BWX Technologies and Crowley is part of a much larger nuclear energy trend I am seeing in the United States, the Department of Energy along with many US based private nuclear energy names focusing in on reducing carbon emissions while also providing a long term, stable alternative source of energy within the nation and abroad. The US has awarded billions in contracts for the design and deployment of Small Modular Reactors throughout the last three years, first beginning in 2019. This is a sort of contrarian effort to some as generally speaking Wind and Solar solutions have been in development/promoted in the public eye while advances in nuclear energy generation have largely gone underreported at best and scrutinized more heavily than its less productive counterparts.
A supply chain for the adjacent Uranium sector also being funded through the DOE and inside the private investment space of alternative energy as well. In a previous article I outlined some of those progressions and I believe nuclear energy will only increase in demand within the next 3-5 years as the investment stage across the nuclear space ramps up. There’s a clear need to make up for lost ground in the alternative energy space which has only proven wind/solar energy generation is inconsistent, financially volatile, and requires large portions of quality land to be littered with acres of solar panels. I think nuclear energy can not only make up for the shortcomings of wind and solar but can also take advantage of recent developments in safety to give the American people carbon free, long lasting clean energy choice that is more affordable per kWh, and more energy dense than wind and solar alone. The projects currently ongoing across the country and in multiple overlapping partnerships not just within private industry but other nations as well says to me the path forward includes nuclear energy generation at a higher level than previously sold to the American people. This will also create long term economic partnerships with other nations and the US, as it currently seeks to establish a stronger global presence with the supply chain to back the partnerships. It should also be noted this does not mean volatility is nonexistent, Russia on Friday halted Uranium exports to the US which relies heavily on Russia to provide Uranium for current reactors, that account for roughly 20% total generation nationally.
Another US based startup, Oklo, which is valued ~$850M will go public through a SPAC created by OpenAI founder Sam Altman, and Citi Group. The deal will provide Oklo with a fresh $500M in funding to continue its development of Small Modular Reactors. Oklo plans to deploy an SMR within the next four years and will also house a fuel recycling facility, which is part of a project to convert nuclear waste into fuel for advanced reactors. The technology behind the “fast” reactor is self-stabilizing, self-containing, and naturally cooled. It is said to be a pivotal point in the US energy narrative as it would essentially remove dependance on Russia for high concentration Uranium. Oklo recently received an award through the Defense Logistics Agency on behalf of the Air Force to build an Aurora Powerhouse at Eielson Air Force Base in Alaska and has the potential for a 30-year agreement allowing Oklo to advance the technology. The Alaska base was chosen due to its mission critical nature and “resilient power needs” again highlighting the effectiveness and stability nuclear energy provides.
The US, When in Rome? (@GregCrennan, MacroEdge Contributor )
Today, we embark on a journey through time and across continents, drawing parallels between the fall of the Roman Empire due to inflation and the current financial challenges facing the United States. Both stories share a common thread: the devaluation of currency and the shift away from precious metals as a standard of value.
The Wisdom of St. Ambrose: "When in Rome, Do as the Romans Do"

In the 4th century, during the division of the Roman Empire, Saint Augustine moved to Milan, where Saint Ambrose, the bishop of Milan, offered timeless wisdom encapsulated in the phrase, "When in Rome, Do as the Romans Do." This phrase emphasizes the importance of adapting to the customs and practices of the people in a particular place. Ironically, today, the U.S. seems to have borrowed a page from Rome's history, but not for the better, as it grapples with its own currency devaluation.
The Roman Empire: A Tale of Devalued Denarii
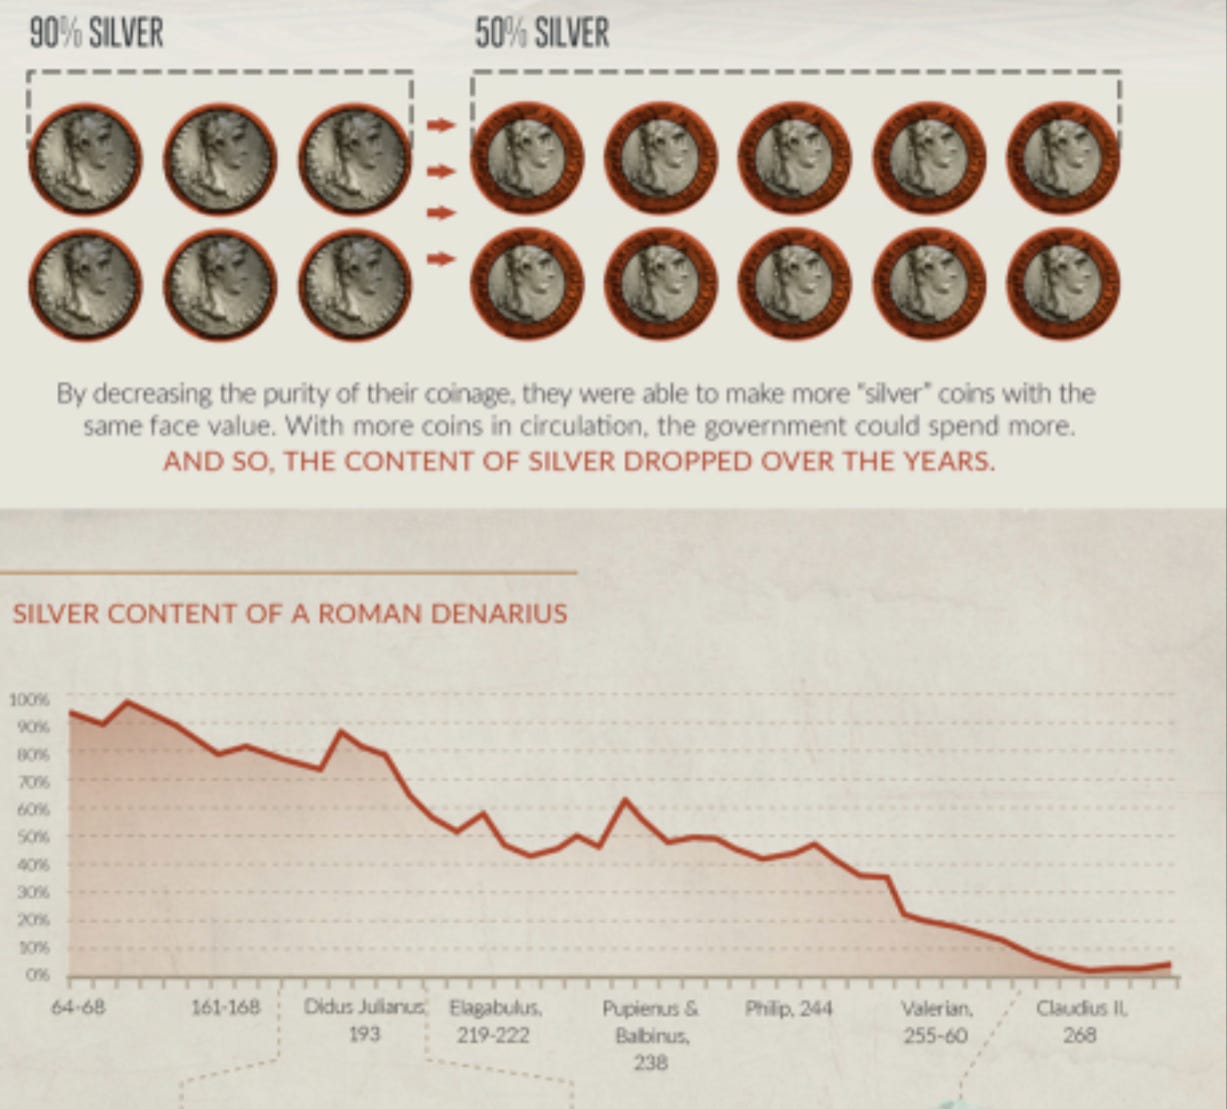
In ancient Rome, the denarius was the linchpin of the empire's economy. Originally crafted from pure silver, it stood as a symbol of Rome's economic might. However, over the span of 300 years, from Augustus to Diocletian (27 BC - 300 AD), the denarius experienced a gradual devaluation. This decline was attributed to several factors, notably the Roman government's struggle to generate adequate revenue through taxation to sustain its expansive military.
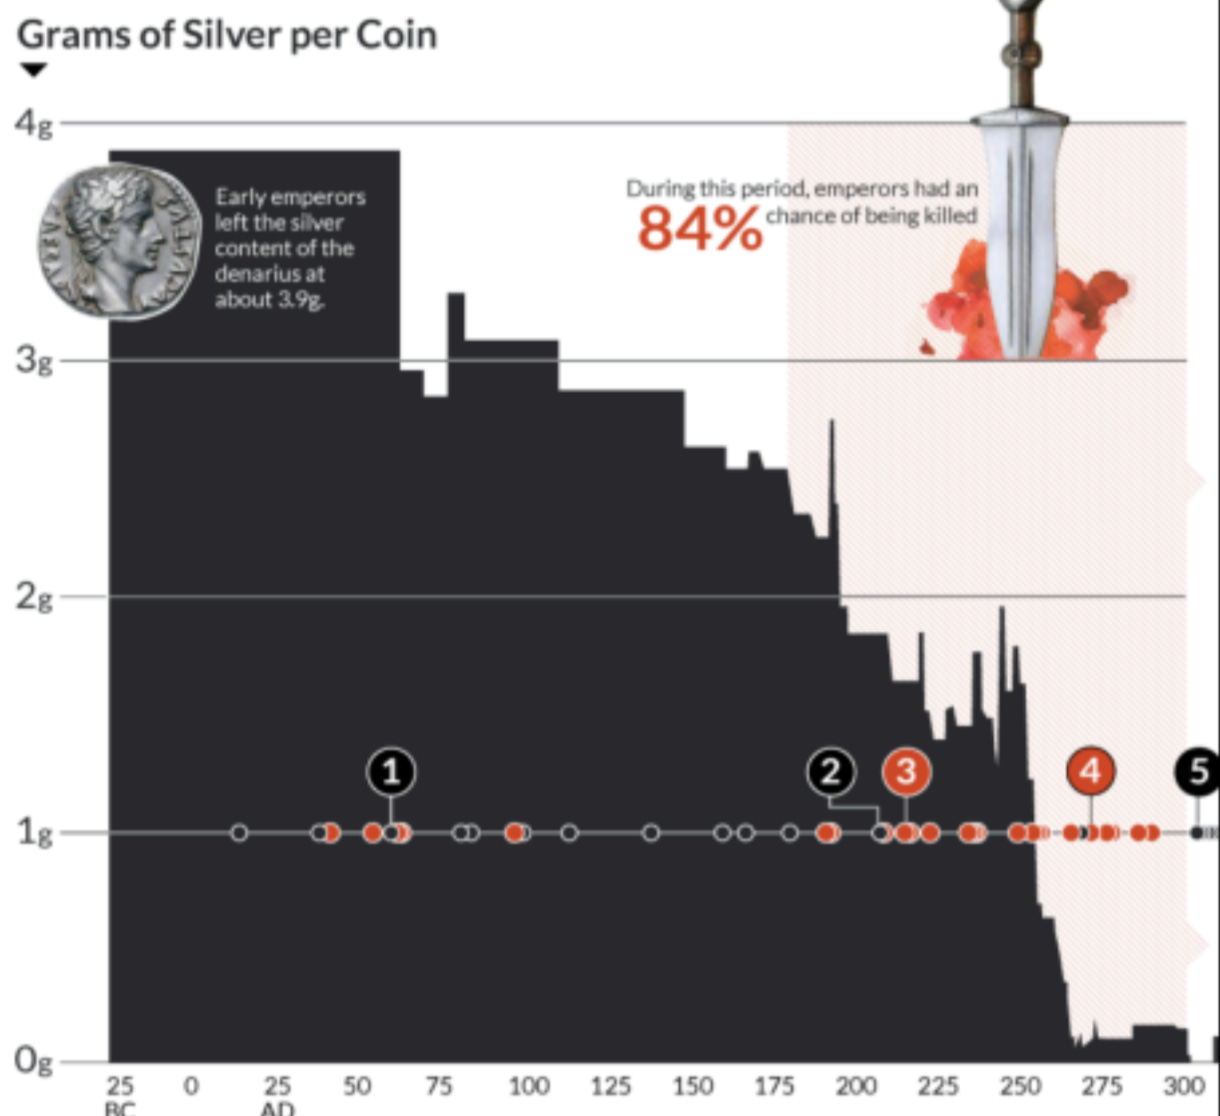
As the empire faced mounting military expenditures, it resorted to debasing the denarius by diluting its silver content with less valuable metals like bronze and tin. The ensuing inflation eroded the purchasing power of Roman citizens, contributing to the empire's downfall. This economic turmoil led to a loss of faith in the government, and soldiers grew disheartened, further exacerbating Rome's challenges.
The United States: A Parallel in Progress
Jumping forward to modern times, we encounter a striking parallel in the United States. The U.S. Constitution states that only pure gold and silver serves as legal tender in settling debts. For many years, this gold standard provided a stable foundation for the nation's currency and economic prowess since its inception in 1776.

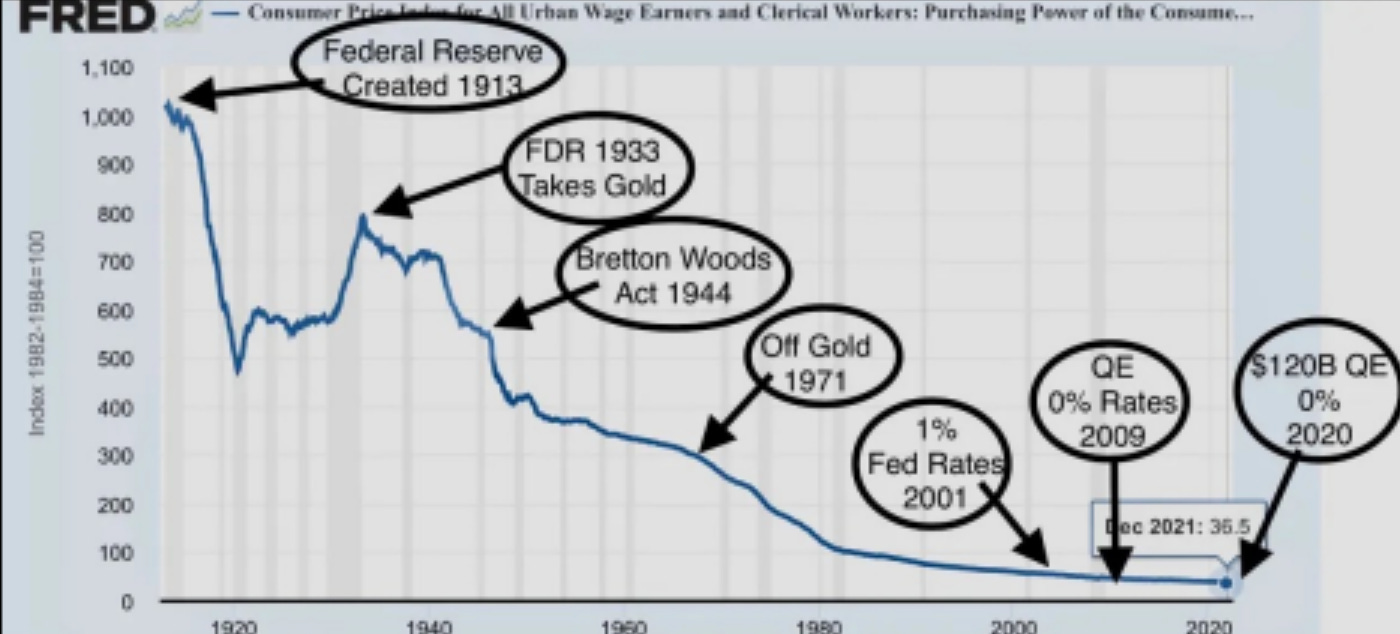
However, significant shifts emerged with the passage of the Federal Reserve Act in 1913. This established the Federal Reserve System, introducing a central banking system that could influence the money supply, departing from the free market principles. In 1933, President Franklin D. Roosevelt signed Executive Order 6102, which resulted in the confiscation of Americans' gold holdings and devaluation of the dollar by raising the value of gold from $20 to $35 an ounce.

Post-World War II, the Bretton Woods Agreement of 1944 pegged the U.S. dollar to gold, solidifying its status as the global reserve currency. Nevertheless, this did not prevent future devaluations of the dollar.

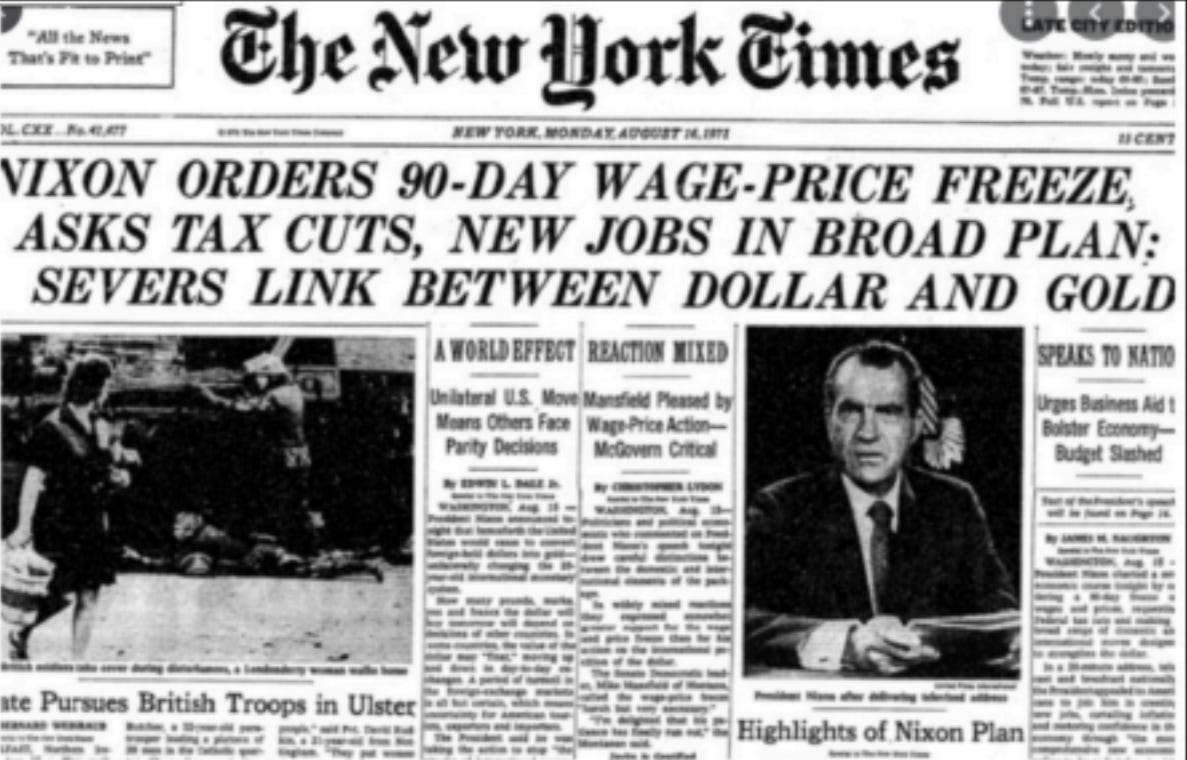
Further devaluation ensued after President JFK was taken in 1963, when President Lyndon B. Johnson signed the Coinage Act of 1965, removing silver from U.S. coins, akin to the Roman practice of assigning coins values exceeding their intrinsic worth. The final blow to the gold standard arrived in 1971 when President Nixon suspended the dollar's convertibility into gold, ushering in a global fiat-based monetary system, permitting governments to print money at will without the need for increased taxation.
Drawing Lessons for Today
The lessons from history are evident: devaluing currency and moving away from precious metals as a standard of value can have profound consequences for an economy, leading to inflation, social unrest, and economic instability. Both in the Roman Empire and modern-day America, these actions were responses to fiscal challenges and the pursuit of greater financial flexibility.
Though the eras differ, it is imperative to recognize the potential hazards of departing from a stable monetary standard. Inflation and currency devaluation can erode citizens' wealth and purchasing power, thereby imperiling economic stability.
As we navigate the complexities of the contemporary financial landscape, staying informed and vigilant regarding monetary policy decisions that could impact our economic future is paramount. History serves as a repository of invaluable insights to guide us in making informed choices and advocating for responsible fiscal policies.
**The Coastal Journal encourages you to stay informed, engage in conversations about the implications of monetary policies, and hold our leaders accountable for the betterment of our society.
From Boom Till Bust (@MrAwsumb, MacroEdge Contributor )
“The home building boom is collapsing. Mostly unrelated to the energy crisis, the collapse is so acute that housing starts in December will be at an annual rate of 1.3 million. The decline is plunging some builders into bankruptcy and has cost thousands of construction workers their jobs. Its ripple effect is moving through the economy, from sales of lampshades to lawn mowers. The decline started this summer when mortgage money became scarce and interest rates soared to as high as 10 per cent.”
Actually, I didn’t write that. That’s literally from a New York Times article written December 30th in 1973. You can read it here:
We’re at a similar place in time, interestingly enough.
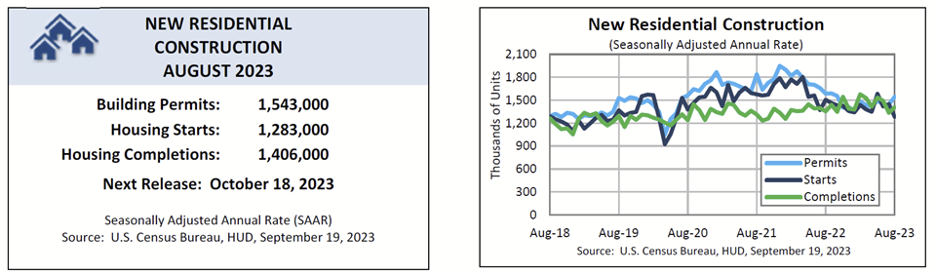
Home building is very much a cyclical business, like any other. To understand it’s cycles, let’s first zoom out.
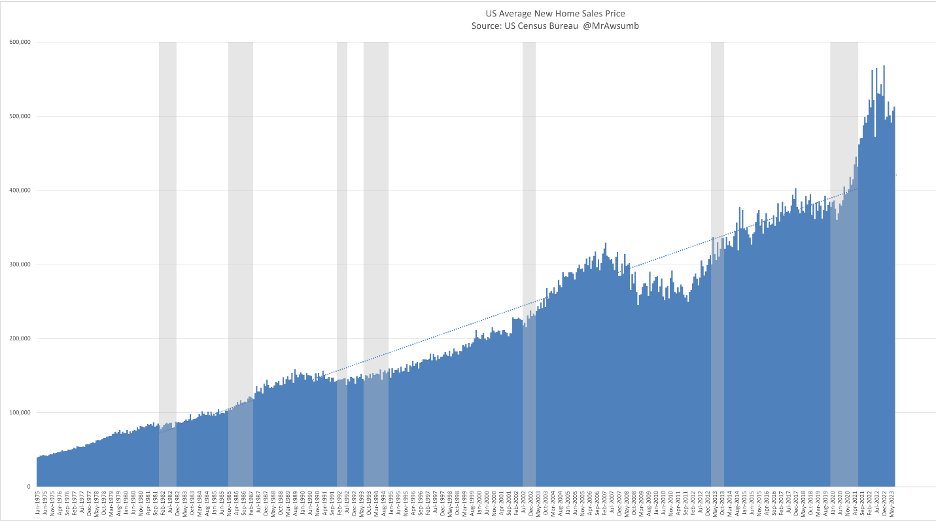
The Average Sales price of a new home is already off it’s peak from 2022. I expect with inventory ramping, that will continue to trend downward. In fact, when you look at sales by type of home, 2020-2023 is a very similar trend to the 05-07 and 18-19 stage where homes under construction outpaced completed along with finished lot sales. I expect that will roll over this year into sales of completed units to far outpace sales of under construction and lots. And for a considerable amount of time.
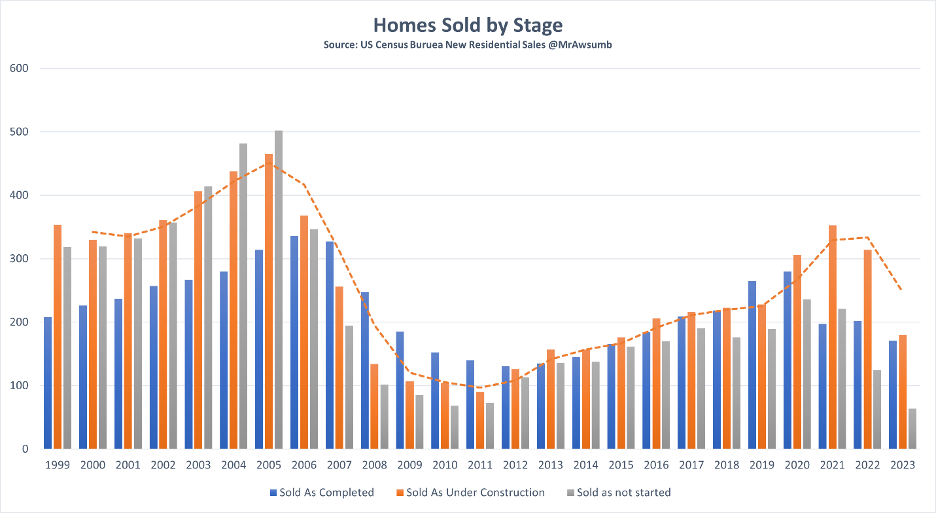
The census bureau doesn’t take into consideration sales cancellations. And while the most recent publication does indeed show inventory ramped up, I believe it to be considerably below actual inventory as previously published here.
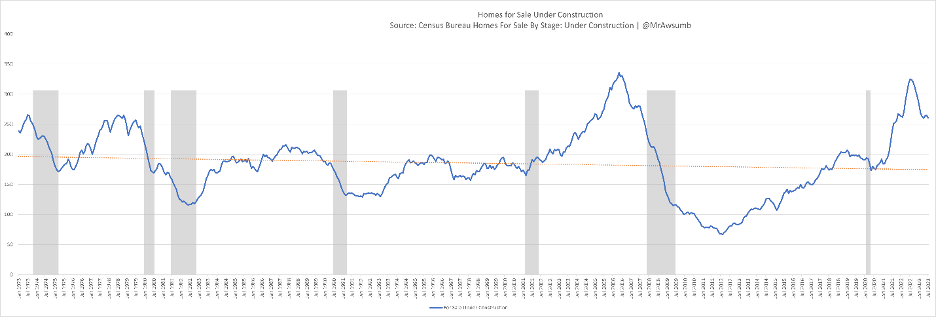
There’s another great way to gage the build cycles. Especially if we want to evaluate an investment in say, a publicly traded homebuilder. Let’s take a historical look at homes for sale “Under construction” stage. From 1973, (the first available data series point) to today, looking at the chart as cyclical, anytime the homes for sale under construction surpasses 200,000 units in any given month, we see growth stall, construction stall and subsequent contraction in construction for a time and amount nearly equal to the surpassing time of 200,000 units.
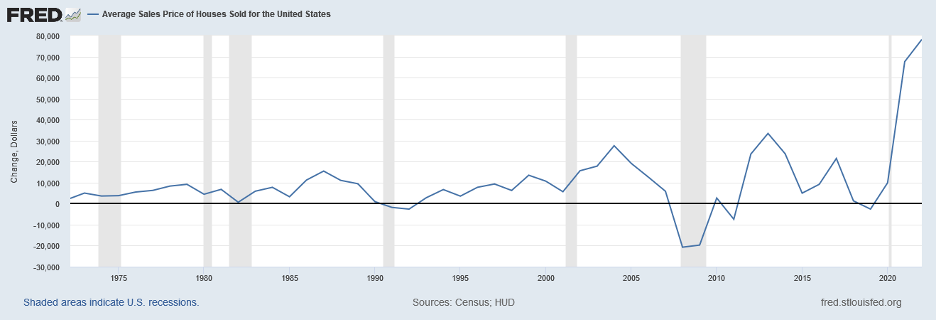
This stall coincides with Average Sales prices, which we shared earlier, but here again for reference using change in dollars:
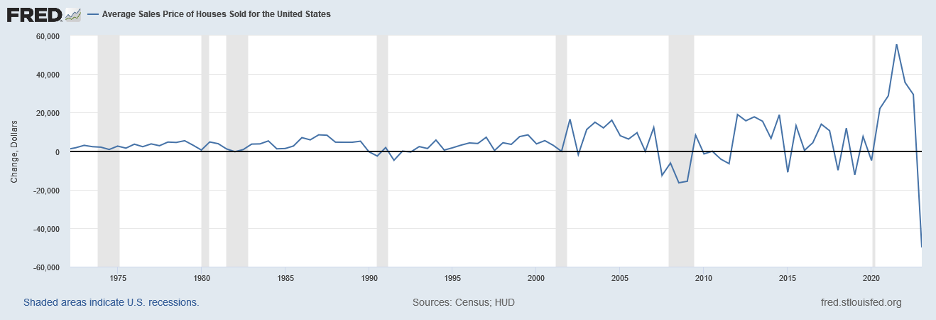
To wit here that is again, on a semiannual basis:
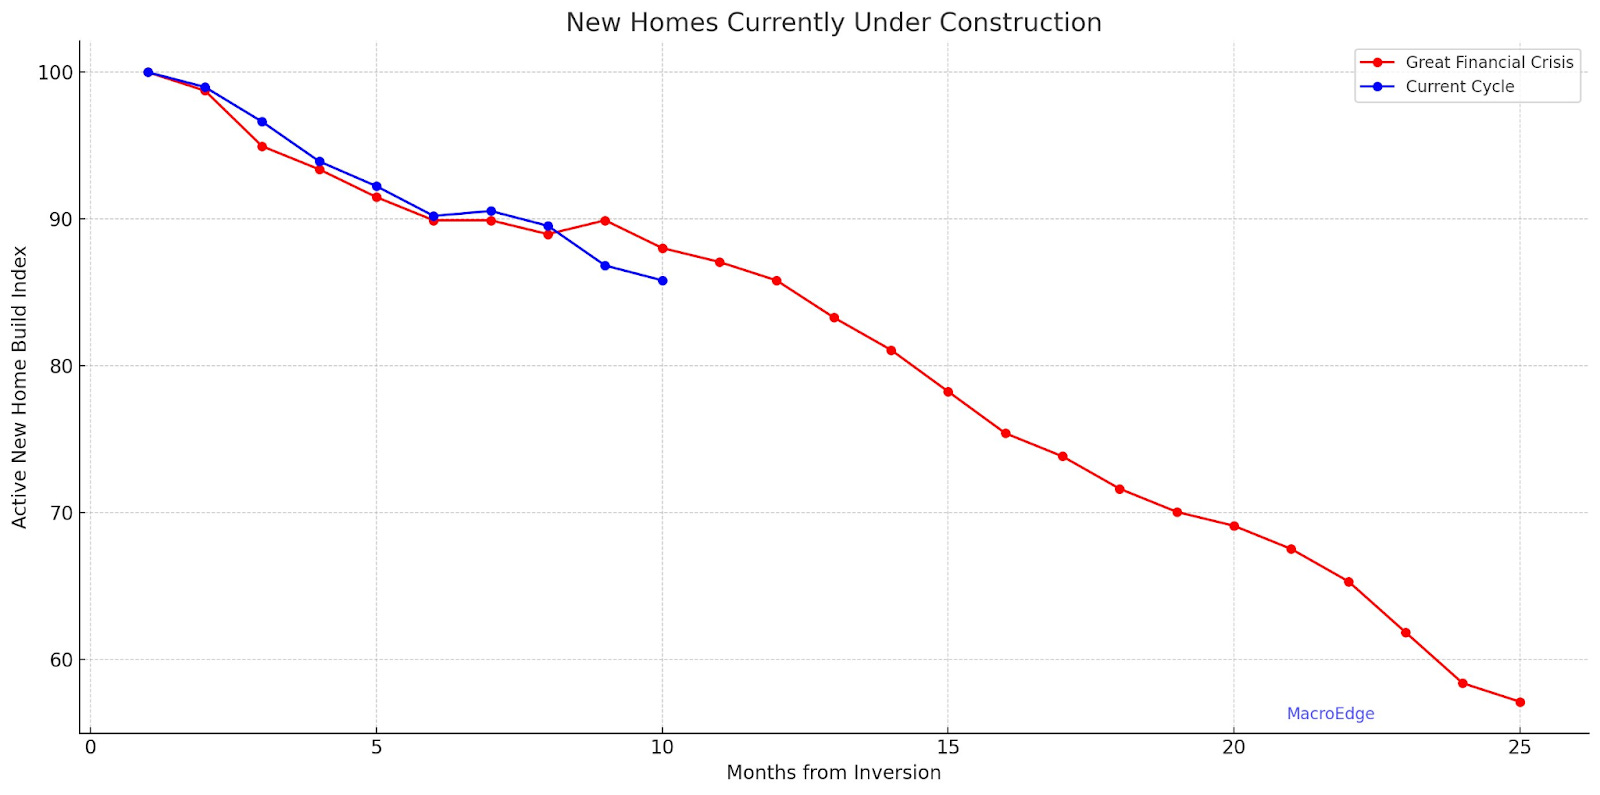
But we can evaluate this even further. One of the things I appreciate about MacroEdge and it’s Chief Economist @DonMiami3 is the continual effort to place things in context of each economic cycle, and track its pace and similarity to other cycles. The other great thing is the amount of cooperation amongst MacroEdge contributing writers. To that end, I want to hand the piece off momentarily to Don to present the Macro Edge version of the correlation and average of each cycle here, of homebuilding.
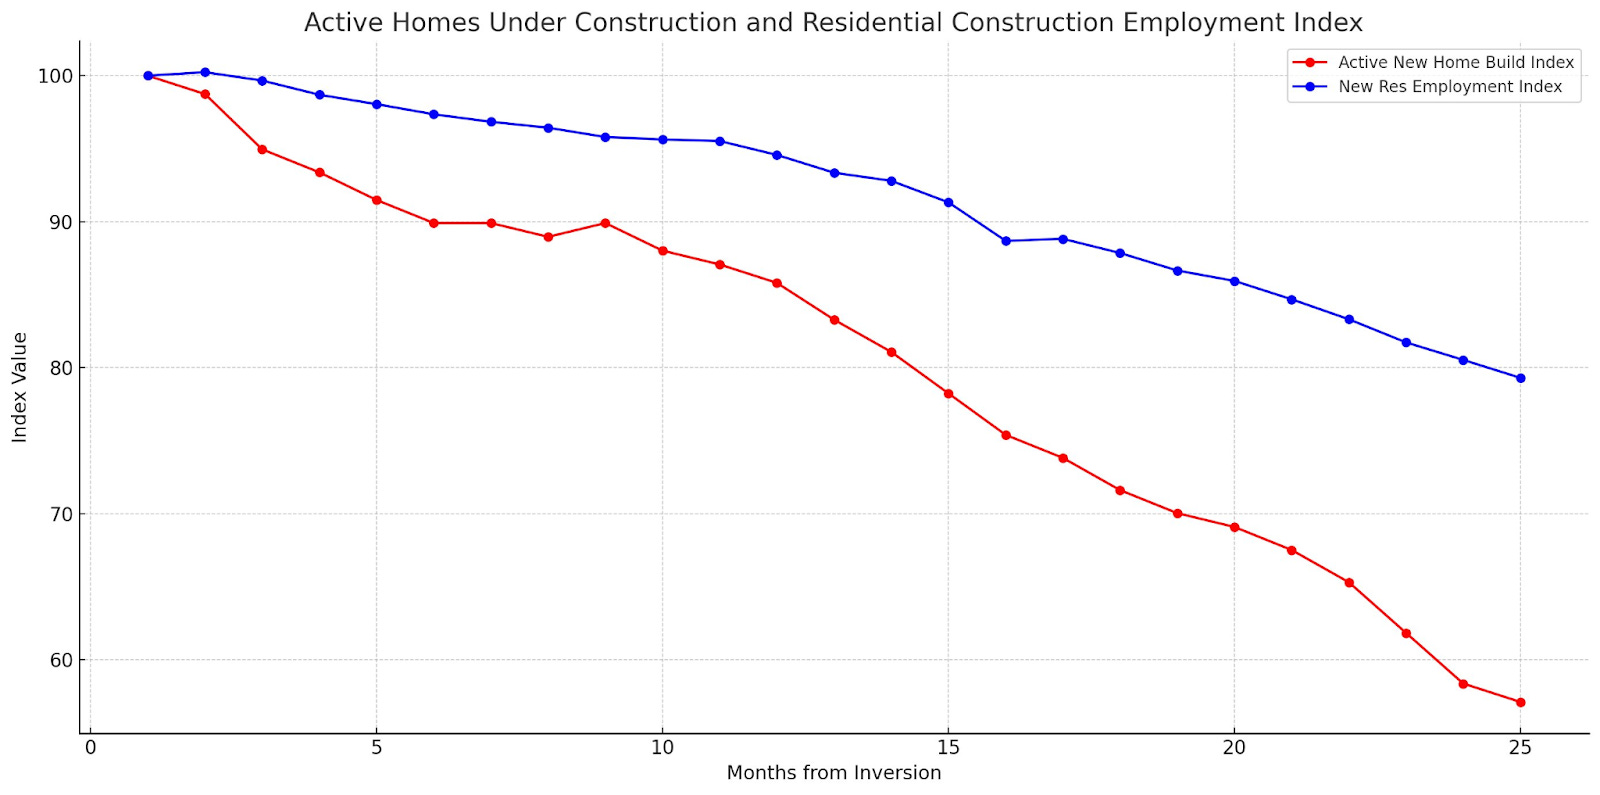
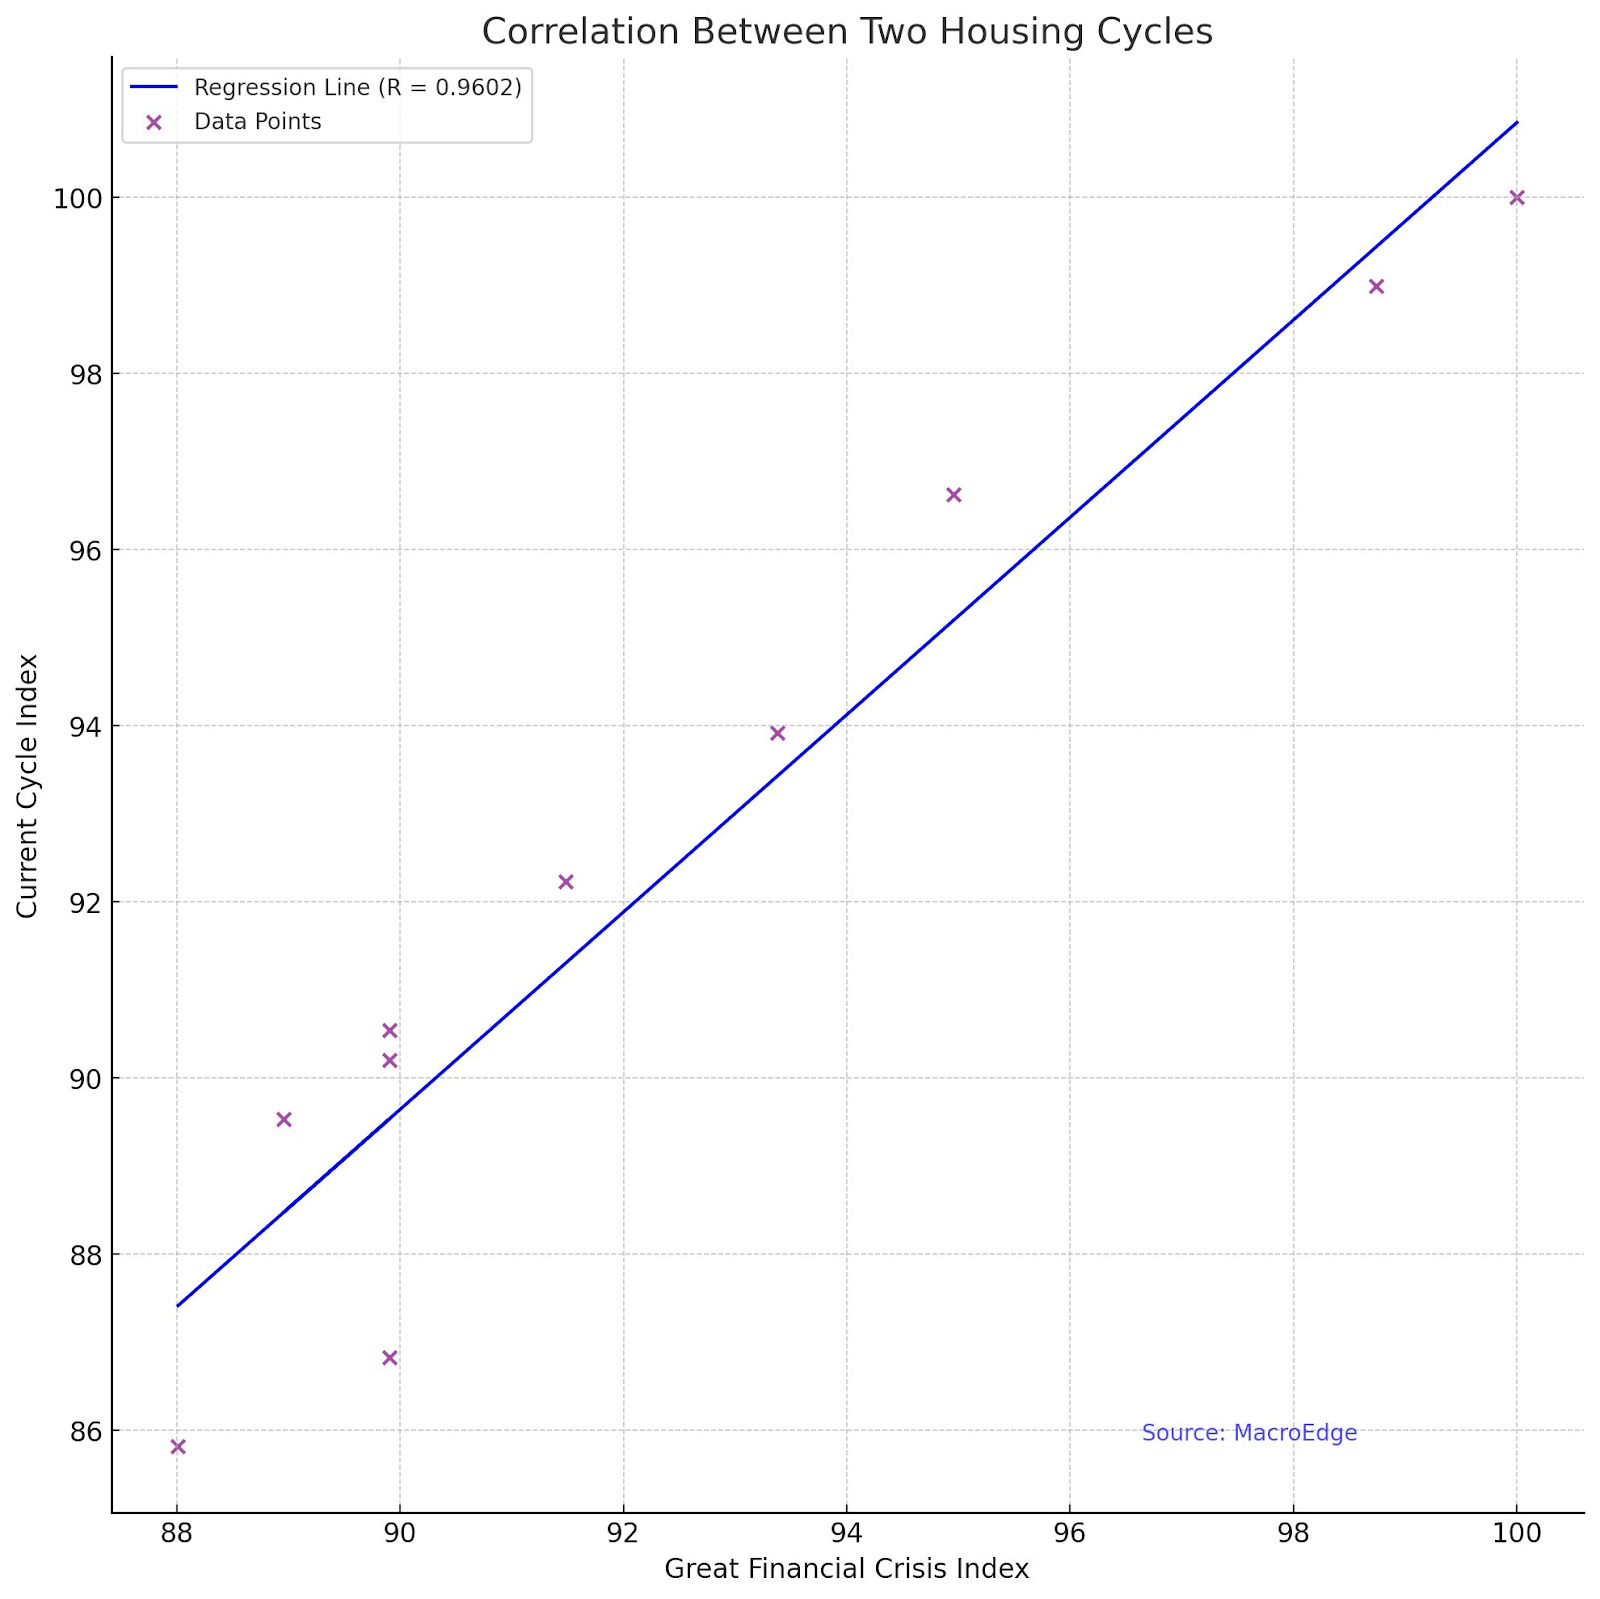
Thanks A… Jumping in real quick. The correlation on the active new builds under construction in progress data is pretty eye-opening… (see below). We’re currently running a 96% correlation to the track that proceeded the 08 financial crisis and this is absolutely something to keep an eye on in the coming months. As I’ve tweeted about - I anticipate residential construction employment to follow this (the second graph, with a lag) given the very interesting correlation we’re witnessing (third).
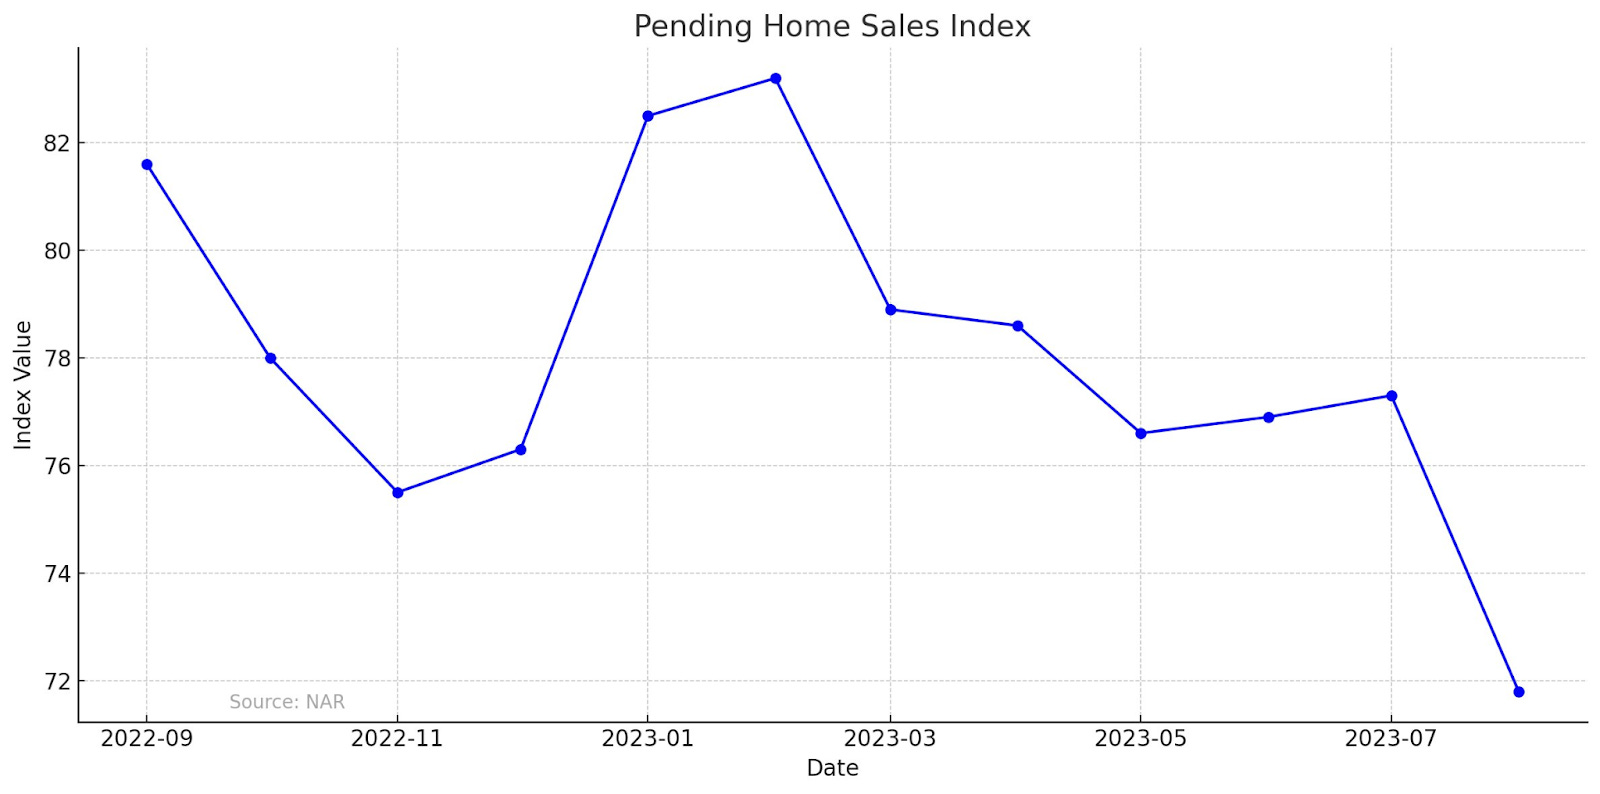
Pending home sales from the NAR points towards a rather ‘dark winter’ for homebuilders and sellers alike:
In closing, “The home building boom is collapsing. Mostly unrelated to the energy crisis, the collapse is so acute………”
I expect a few years of trouble ahead for public homebuilders as they attempt to offload inventory in a stagnating macroenvironment that’s on the cusp of turning negative and in a cycle where average sales prices burst well above all other cycles to date already in first stages of correction.
Unemployment Claims Data (@J77324, MacroEdge Contributor )
Unemployment Claims last week for initial claims were 204k (up 2,000 from an upwardly revised 202k), and continued claims were 1670k (up 12,000 from a downwardly revised 1658k). The seasonal adjustments for initial claims and continued claims were .855 and .954 respectively last week.
MacroEdge estimates for this week are 210.0k for initial claims and 1675k for continued claims. Seasonal adjustments for initial claims and continued claims this week are .836 and .948 respectively. This week’s adjustments are lower than last week, so the BLS may have anticipated non-seasonally adjusted initial and continued claims will fall this week.
MacroEdge expects non-seasonally adjusted claims to stay steady around 174,590, and non-seasonally adjusted continued claims to fall by 5,000 to 1,587,818. Also, these estimates assume no revisions to last week’s numbers, and the government shutdown does not last more than 2 days if it happens. (This was written on Saturday.)
The MacroEdge Layoff Tracker is at 36,567 for September. This number is preliminary and we are still waiting for layoff totals for Minnesota and Mississippi. We still expect layoffs to drastically rise next month as several banks begin to reduce headcount to cut costs. However, US Bank, Wells Fargo, BMO, First Savings Bank, have gotten a head start on the other banks, and Warn Notices from them have begun popping up.
ISM Manufacturing PMI will be out this coming week, and it is always a good idea to listen to Tim Fiore of ISM. We will be eager to hear if manufacturing companies are still preferring hiring freezes and attrition or if they have decided to optimize staff by handing out pink slips. Some manufacturers did lay off in September including: Westrock Company, Georgia-Pacific, Menasha Packaging Company, and Kayser-Roth Corporation. Check back next week for more updates.
This paragraph is brilliant:
"Residential real estate is not supposed to be a risk asset, but our prior monetary policy has de facto made it one. Homes were once places where we raised families. Now? They’re Boomer NFTs."
Really enjoy your videos and posts Melody! Any color on San Francisco appreciated. I'm feeling a bit lost navigating this bizarro market looking for a home for my family.
Great post, everyone. Lots of juicy nuggets, but special shoutout to @KennyCap_PhD! I am of the opinion everyone's eyes should be on Nashville.